Neck and Neck: US and European GHG Emissions Trends
Greenhouse gas emissions fell twice as fast in Europe in 2011 than in the US. But it was the US that outperformed in 2012. We analyze recent GHG emission developments in the US and EU and discuss the outlook for the coming year.
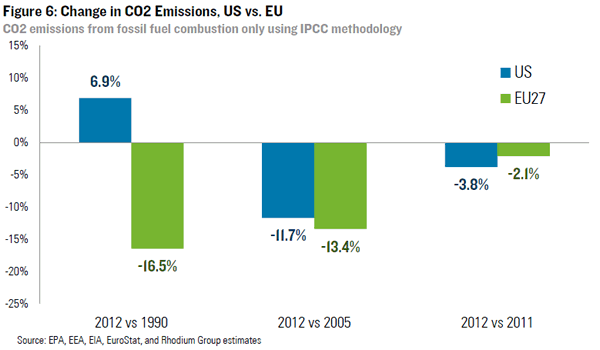
Today the European Environmental Agency (EEA) released their annual greenhouse gas (GHG) inventory. Emissions in the European Union fell 3.3% in 2011 to their lowest level since the EEA began keeping track. That’s double the year-on-year decline in American GHG emissions in 2011, but the US likely made up much of the difference in 2012. Preliminary data shows a 2.1% decline in European emissions last year compared to a 3.8% decline in the US.
Europe Takes the Lead in 2011
Compiling a robust inventory of GHG emissions is a complicated affair, and as a result official data often lags by over a year. Today, the EEA published their final GHG inventory for 2011 covering all 27 members of the European Union, and it shows a sharper drop from 2010 levels than preliminary estimates had suggested. Total GHG emissions in the EU fell by 3.3% in 2011 to 4,550 million tons CO2e. That’s the third steepest one year drop since the EEA inventory process began.
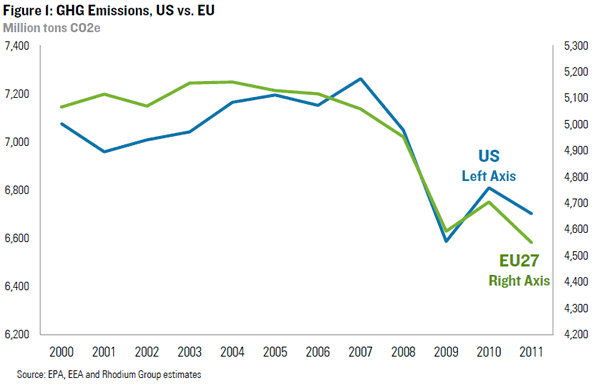
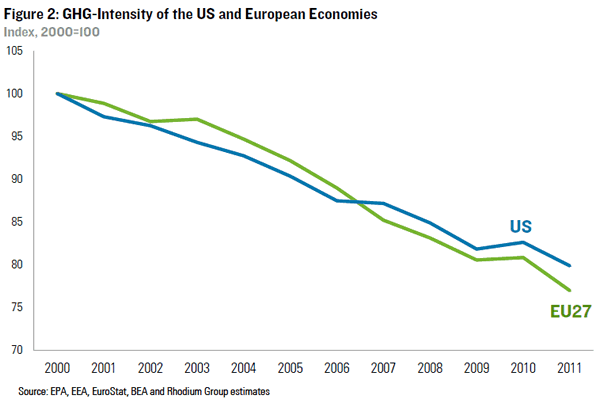
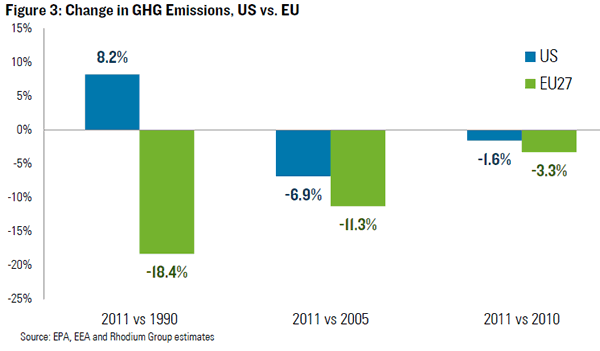
Europe is not the only part of the developed world where GHG emissions are falling. Emissions have declined in the US as well in recent years, thanks primarily to the global recession and lackluster economic recovery (Figure 1). But the 2011 drop was twice as sharp in Europe as in the US – 3.3% compared to 1.6% (Figure 3). Differences in economic growth are partially responsible. The American economy expanded by 1.8% while the Europe grew by 1.6%. More important, though, was the change in the GHG-intensity of the two economies (Figure 2). Thanks in large part to a particularly mild winter (and thus less demand for heating) the quantity of GHGs emitted per unit of economic output fell by 4.8% in Europe in 2011, compared to 3.3% in the US.
That drop put European emissions 18.4% below 1990 levels at the end of 2011 (Figure 3). And it put the EU within striking distance of their goal of a 20% reduction by 2020 (unless other major economies act in which case the target increases to 30%). In contrast US GHG emissions were 8.2% higher in 2011 than in 1990. Now as American climate negotiators like to point out, using 1990 as a base year makes Europe look particularly good. German reunification and a wide-scale switch from coal to gas in the UK led to a sharp decline in EU emissions in the early 1990s. But even compared to a 2005 base year (the year the US references in its international commitments), EU emissions were down 11.3% in 2011, while US emissions were only down 6.9%.
The US Catches up in 2012
While total GHG emission data for 2012 won’t be out until sometime next year, preliminary estimates of CO2 emissions in the US and EU are now available. CO2 emissions from fossil fuel combustion account for between 75-80% of total GHG emissions in both the US and EU. And today the EEA announced, based on preliminary energy demand estimates, that European CO2 emissions from fossil fuel combustion fell by 2.1% in 2012 (Figures 4 and 6). EU GDP contracted by 0.3% last year, which explains much of the decline. Indeed, the decarbonization European economy slowed to 1.8% in 2012, compared to 5.5% in 2011 (Figure 5).
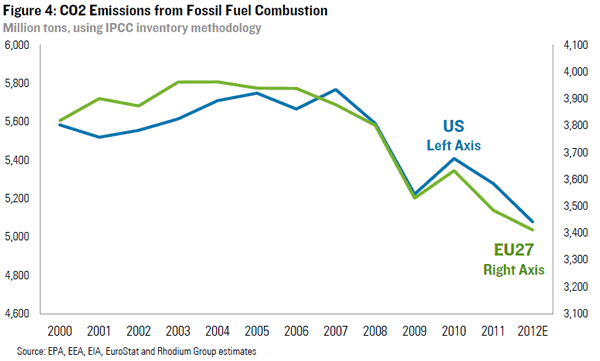
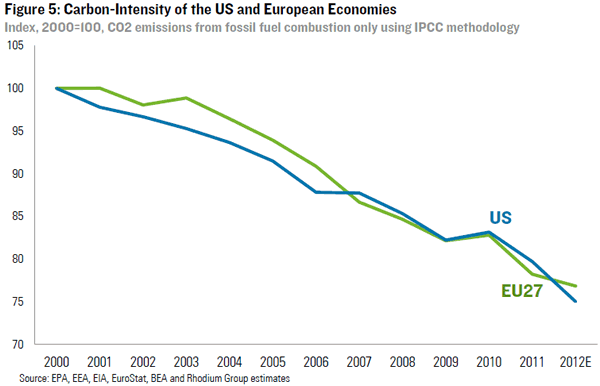
The American economy performed better in 2012, growing at 2.2% year-on-year. Yet CO2 emissions fell faster in the US than in Europe – by 3.8%. It was America’s turn for a mild winter. That combined with a large-scale shift from coal to natural gas in the power sector reduced the carbon-intensity of the American economy by 5.9% (Figure 5), which was more than enough to offset stronger GDP growth. US CO2 emissions are now 11.7% below 2005 levels, not far behind Europe’s 13.4%.
It’s important to note that because last year’s reduction in US CO2 emissions came largely from fuel switching in the power sector, while Europe’s came primarily from slower growth, Europe’s lead will likely increase once non-CO2 gasses are added into the equation early next year. Switching from coal to gas in the power sector reduces CO2 emissions but does little to reduce other GHGs. Indeed, at the higher end of the range of current methane leakage estimates, some portion of the CO2 reduction could be offset by higher methane emissions (another GHG). In contrast, a European reduction in CO2 emissions driven by slower economic growth likely impacted other GHGs as well.
The Outlook for 2013
As we’ve argued before, the impressive decline in US emissions in 2012 will be short-lived in the absence of new policy either from Washington or the States. Coal has clawed its way back into the power sector thanks to rising natural gas prices. Coal’s share of US power generation is back at 40%, after falling to a low of 33% in April of last year, and electricity demand is growing thanks to continued economic recovery and colder weather than in 2012. US CO2 emissions were up 1.5% during the first two months of 2013, and in its most recent Short Term Energy Outlook, the EIA projects full-year emissions growth of 2.6%.
The outlook isn’t much better on the other side of the Atlantic. Growth will likely be much slower in Europe this year than in the US. The April World Economic Outlook from the IMF expects GDP in the EU to remain essentially unchanged, compared to 1.85% projected growth in the US. Given the sharp drop in emissions to date, EU ETS allowances are trading at rock bottom prices creating room for coal to claw back market share in Europe as well. Oil demand will continue to decline, which will limit the impact of increased coal consumption on total emissions. And while natural gas is getting pushed out of the power sector, at least in Germany there has been a modest increase in heating-related demand so far this year. The net effect will likely be very modest decline in EU emissions in 2013, if there is a decline at all.