Final US Emissions Estimates for 2018
For the third year in a row, transportation was the largest source of US emissions. Electricity emissions ticked up after five years of decline.
In January, Rhodium provided preliminary estimates of US carbon dioxide (CO2) emissions in 2018. In this note, we provide final energy CO2 emissions data and preliminary estimates for economy-wide US greenhouse gas (GHG) emissions in 2018. CO2 emissions from fossil fuel combustion rose by 2.7% in 2018, the second largest annual increase since 2000. Economy-wide GHG emissions likely rose by between 1.5% and 2.5% last year. That puts US emissions at 10.7% to 11.6% below 2005 levels, leaving a decently large gap to close in the next two years to meet the country’s Copenhagen Accord target of a 17% reduction in all GHG emissions by the end of 2020.
Building and Power Sectors Drive a Sign Change in Energy CO2
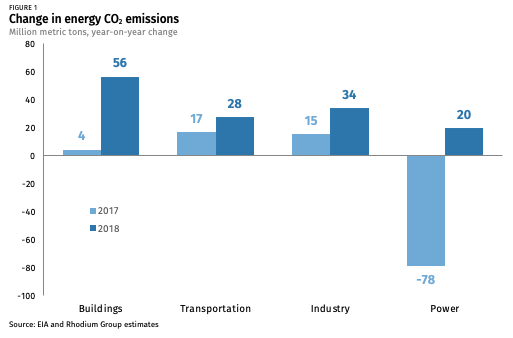
As discussed in our preliminary estimates note, energy-related CO2 emissions rose in 2018 after three years of continuous decline. Emissions in the transportation and industrial sector helped drive this trend, growing in 2017 and at an accelerated pace in 2018 on the back of stronger economic growth. But the big change year-on-year was in the buildings and power sectors. Growth in buildings sector emissions, as we noted in our January report, was primarily was due to a reversion to historical average winter weather after an atypically warm 2017. Colder weather increased building-related electricity demand as well. That was partially responsible for the increase of 20 million metric tons in power sector emissions, coming after a 2017 decline of 78 million metric tons.
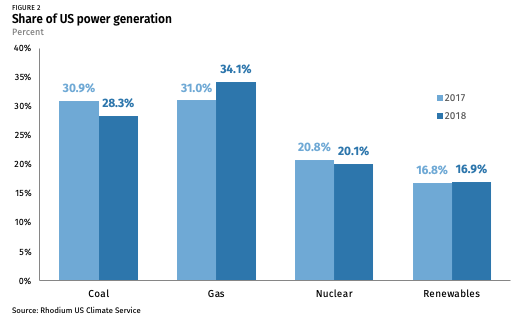
The pace of decarbonization of the power sector also slowed in 2018. Coal’s share of power generation declined from 30.9% to 28.3% but the share of natural gas rose from 31% to 34.1%, offsetting some of those gains. Nuclear’s share declined from 20.8% to 20.1% while renewable’s share remained relatively flat, due to a decrease in hydro that offset a modest increase in wind and solar.
The downward revision from our 3.4% estimate in January to the final 2.7% number was due primarily to a significant drop in coal-fired power generation in December of last year. Between January and November, coal-fired power generation was down 4.5% year-on-year. In December it was down by 9.2%.
All GHG Emissions
Energy-related CO2 emissions account for 86% of all GHG in the US. Here we provide preliminary estimates for economy-wide emissions in 2018 using recently released Environmental Protection Agency (EPA) inventory estimates for 2017 and our method for estimating economy-wide GHG from the modeling used for our annual Taking Stock report. Our methodology is consistent with reporting guidelines for countries tracking progress toward their national commitments under the UN Framework Convention on Climate Change. We estimate that economy-wide emissions increased by 1.5% to 2.5% in 2018.
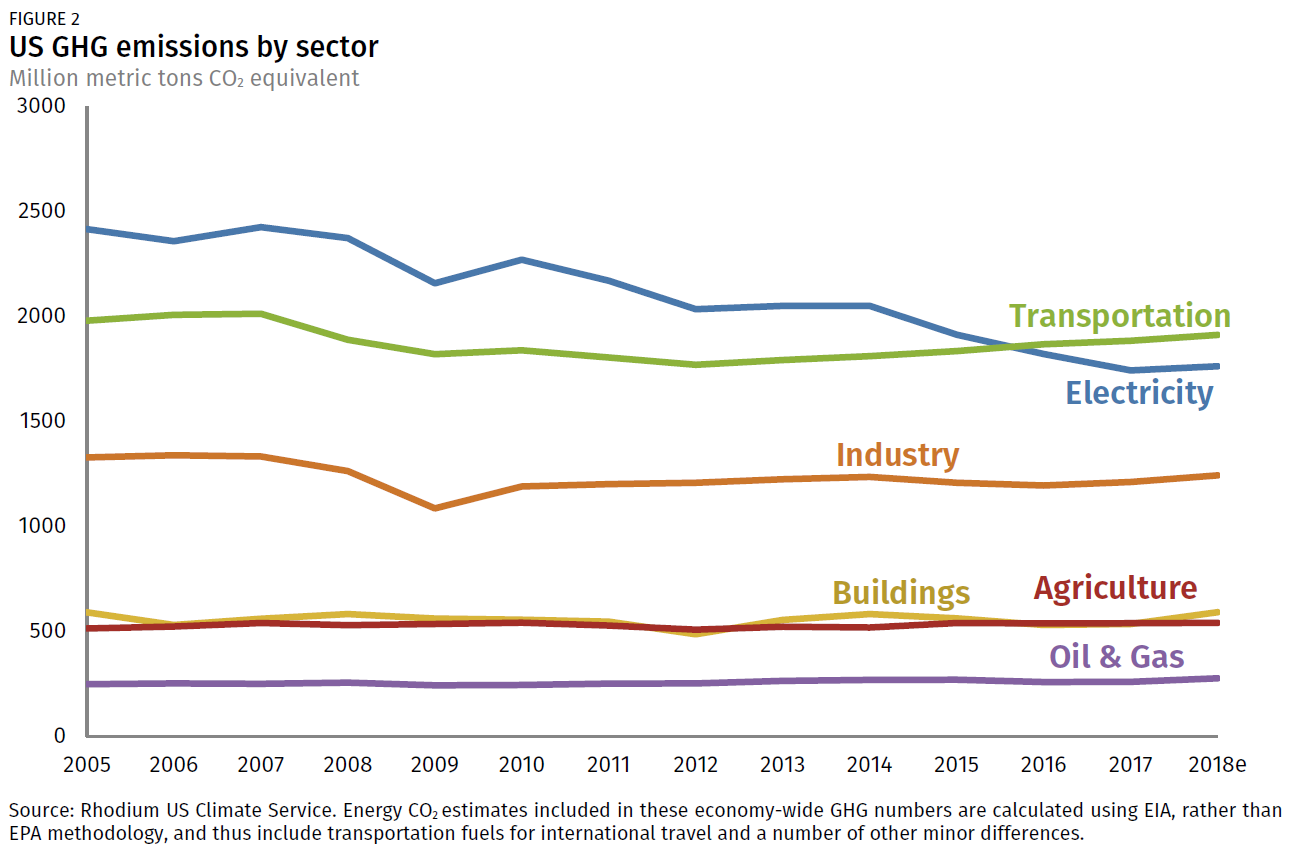
For the third year in a row, transportation was the largest source of US emissions (if fuels for international travel are included). Electricity emissions ticked up after five years of decline. Industrial emissions posted their strongest year-on-year growth since the 2010 rebound from the Great Recession, and methane emissions continued to grow on the back of expanded oil and gas production.
All told, we estimate that net US GHG emissions were 10.7% to 11.6% below 2005 levels in 2018. The US emission reduction pledge under the Copenhagen Accord was a reduction “in the range of 17%” below 2005 levels by 2020. Next month, in our 2019 Taking Stock report, we will assess the prospects of the US meeting this target over the next two years, as well as the potential to make progress on the Paris Agreement target of a 26% to 28% reduction by 2025.