A Diversification Framework for China
Although diversification is already underway, it proves difficult even in economies that have better security alignment with the US and the same attributes that made China attractive.
Executive summary
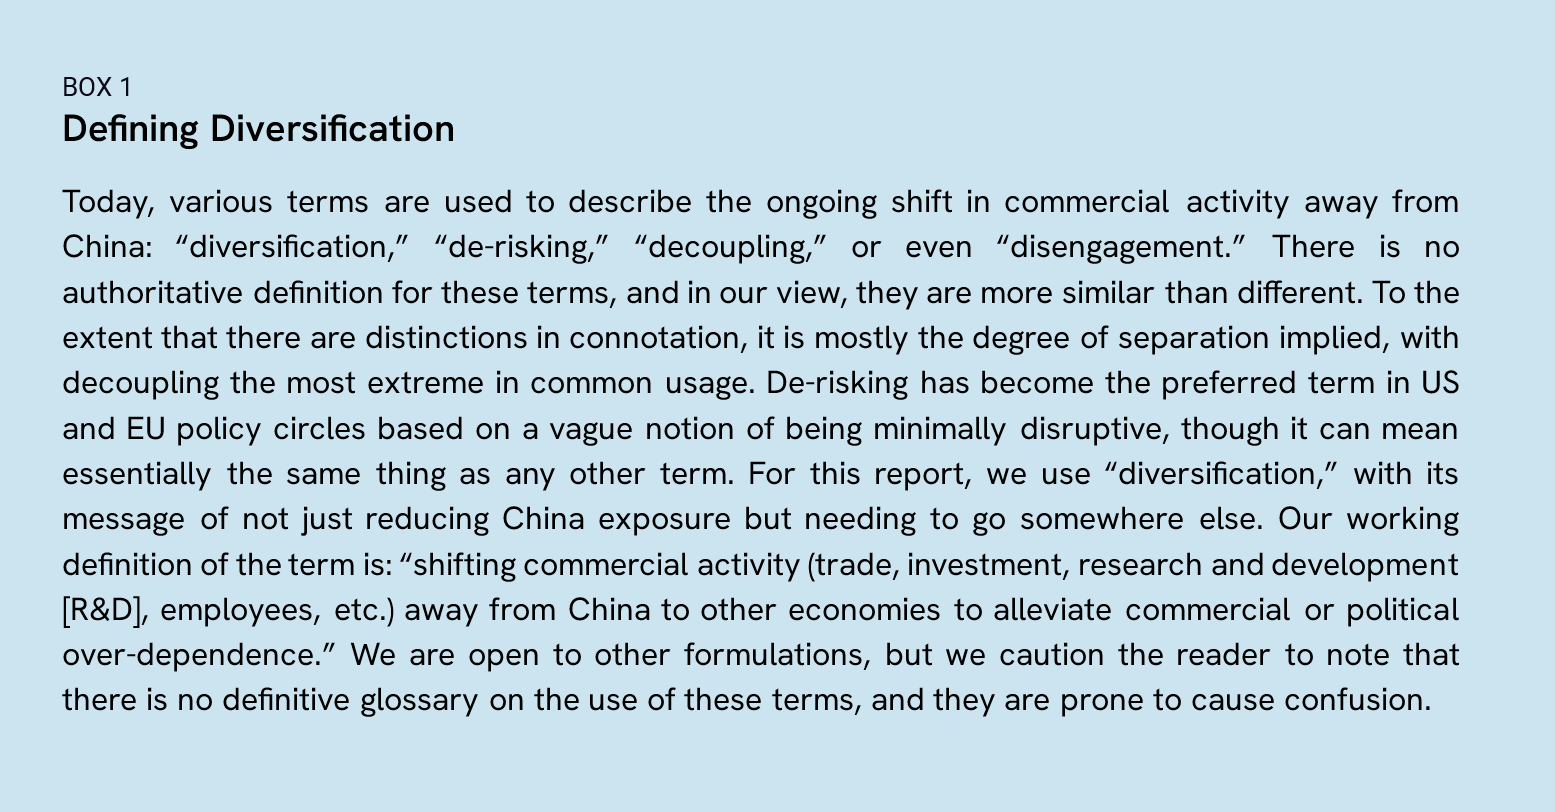
Western policymakers and business leaders are rethinking over-reliance on China as a global manufacturing and sourcing hub. The first question is whether diversification from China is even possible, given the economies of scale and scope China’s huge size has permitted. We find that, properly defined (Box 1), diversification is already taking place to a limited but important degree. Shocks from the US-China “trade war,” COVID, Russia’s war on Ukraine, and other events have made the risks of hyper-globalized value chains clear, altering the valuation of those risks in business and policy planning. And tensions with China continue to rise as a function of technological change, even as political authorities seek stabilization. Yet China’s market size, four-decade manufacturing investment boom, and geopolitical clout also present major hurdles to diversification. Even when other economies enjoy the same attributes that made China attractive and have better security alignment with the United States, diversification can be difficult.
In this report, we assess the potential for diversification of manufacturing and sourcing from China to other economies, whether that potential is being realized, and the reasons why or why not. We come to several working conclusions on these questions:
- In the aggregate, diversification from China is underway, as evidenced by China’s decreasing share of US imports and foreign direct investment (FDI) over the past seven years.
- Diversification has so far centered on just a few countries (Mexico and Vietnam in particular), presenting a risk of capacity constraints and rising costs, hence slowing diversification.
- Diversification is concentrated in a few sectors, too (textiles, electronics, and autos), and in the assembly segment rather than upstream supply chains. In short, firms on the move are still relying on their China-based manufacturing or sourcing for inputs, and broader migration will only happen in stages over a longer period.
- US trade diversification and investment diversification often don’t match: the change in the composition of US imports is often not driven by US FDI but by non-US firms, not least of which—ironically—are Chinese and Taiwanese.
- Beyond Mexico and Vietnam, like-minded nations can be diversification winners despite higher-cost structures: Canada, Taiwan, Germany, and South Korea are picking up trade and FDI shares. Yet many other security-aligned nations are not: Japan, Australia, and the Philippines are notably absent from the list of hotspots.
- The gap between diversification potential and outcomes has many causes, but two factors stand out: availability of workforces with basic-to-advanced skills and the role of high-quality, cross-border economic agreements. These assets are essential both to China’s success over the past two decades and to understanding where activity is shifting today. For instance, the US-Mexico-Canada Agreement (USMCA) is key to why Mexico is picking up so much diversification, while China’s agreements within members of the Association of Southeast Asian Nations (ASEAN) are central to the rise of its neighbors, particularly Vietnam, as US trading partners.
- In the potential/realized diversification gaps we identify, there are opportunities to drive diversification to core US partners, broaden the scope of supply chain movement (beyond assembly), and align trade and FDI patterns. These opportunities require active commercial diplomacy and engagement.
- Reducing over-reliance on China is not impossible, as it was considered until recently. However, the economic costs and risks are real and not all worth incurring. Analysis helps to clarify where it can be viable, even at this early stage, and where policy and government action can help to clear the path.
Introduction
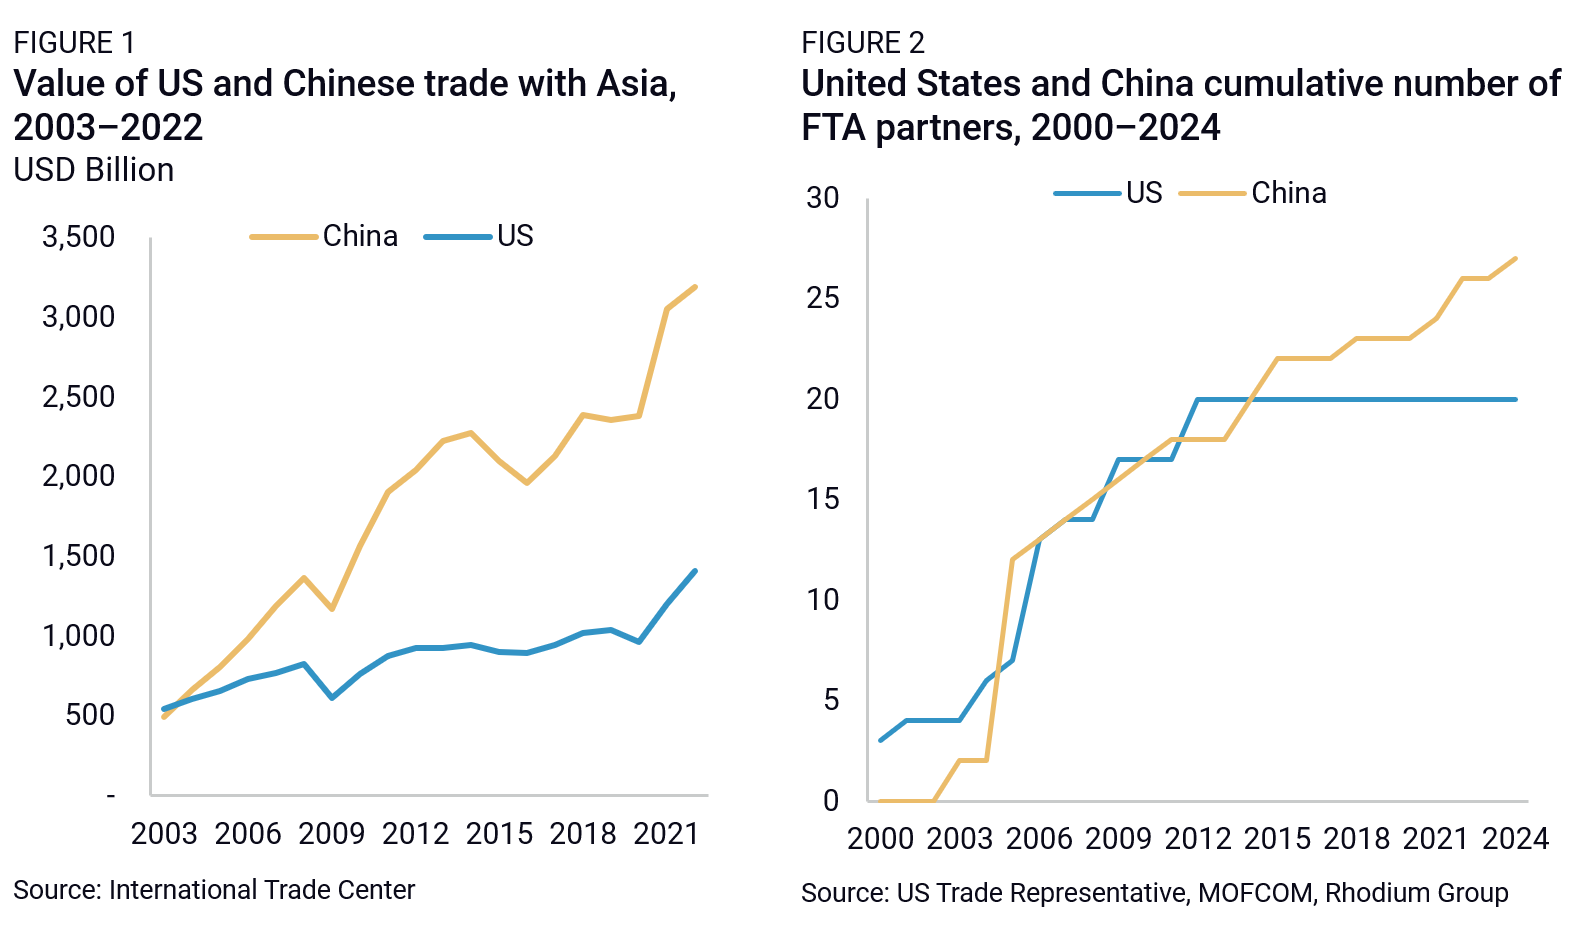
For two decades, China’s trade weight has grown at an incredibly fast pace (Figure 1), along with its willingness to integrate into the global trade architecture (Figure 2). Washington, for its part, has faced strong domestic resistance to engaging in new trade agreements out of concern about the employment and standards costs of excessively permissive trade relations. The United States has not inked an entirely new trade deal or added any new free trade agreement (FTA) partner since 2012. As a result, China’s trade agreements today reach out to about $14.4 trillion in global gross domestic product (GDP), compared to $9.6 trillion for the United States. For multiple reasons, however, the momentum is now shifting to diversification from a China-dominant model. This has the potential to unlock more US trade policy action, not simply to lower US trade barriers generally but also to facilitate diversification from China to a less concentrated—and more security-compatible—set of countries.
That is what this study is about. To understand how the United States can facilitate diversification while keeping costs in check, we ask what made China a dominant economic partner in the first place and what attractions have slipped recently (section 3). We look for countries that offer some of China’s conditions and examine whether they are in fact attracting diversification interest (section 4). We then conclude with a few lessons learned on how to close the gaps (section 5).
This report offers a high-level picture of the drivers and arrestors of diversification and adds concrete evidence to the China de-risking debate. It does not answer questions regarding where to focus diversification efforts—in single industries or geographies—or what exact policy tools to use. Like most economic studies, it provides an imperfect assessment of global commercial activities. Diversification is hard to track because it is happening in real time, driven by a range of motives, and involves complex sectoral dynamics. Our findings are therefore partial, though they rely on over a year of scrutinizing global trade and investment datasets, company statements, and business surveys for insights into the ongoing reshuffling of global value chains.
A short history of China’s economic attractiveness, then and now
Initial economic attractiveness, 1980–2000
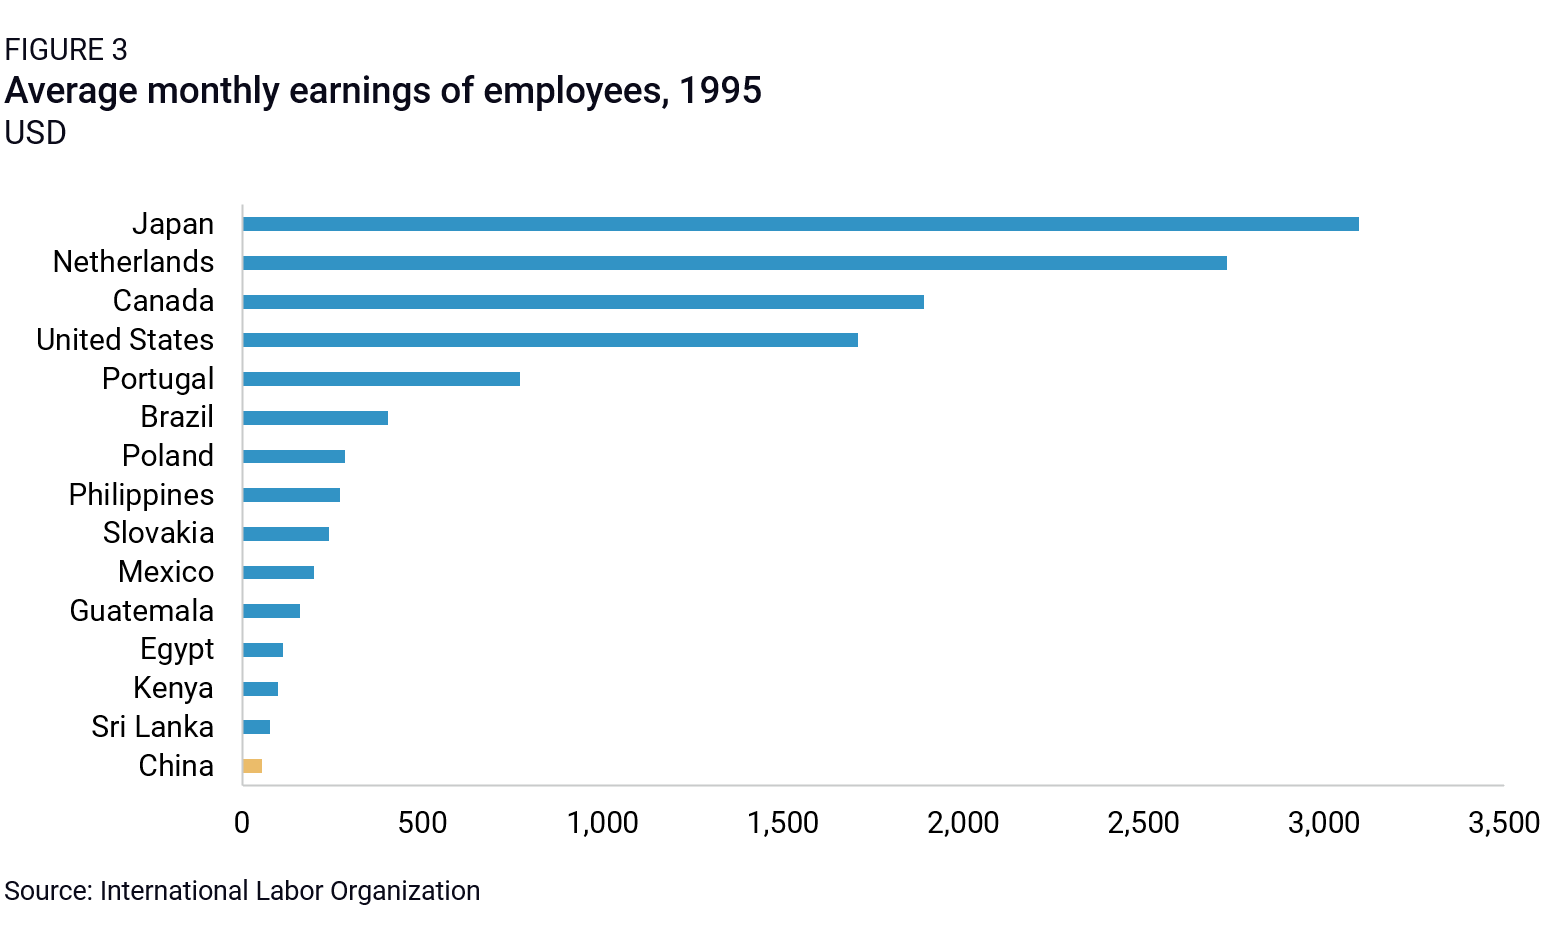
Starting in the 1980s, and even more so after 1992, China’s opening to the world unlocked new opportunities for global firms. By making its massive but underutilized labor force available to global firms at low cost in a stable and increasingly export- and investment-friendly environment, China prompted substantial manufacturing interest and started picking up market shares from other manufacturing economies. Much of China’s opening, however, came with substantial strings attached, but ones that multinational corporations (MNCs) thought they could eventually untangle.
Key attractiveness factors:
- Workforce size and low cost (Figure 3);
- Emergence of FDI- and trade-facilitating policies;
- Relatively stable and predictable business environment; and
- Accommodative external relations.
Scaled-up economic attractiveness, 2000–2015
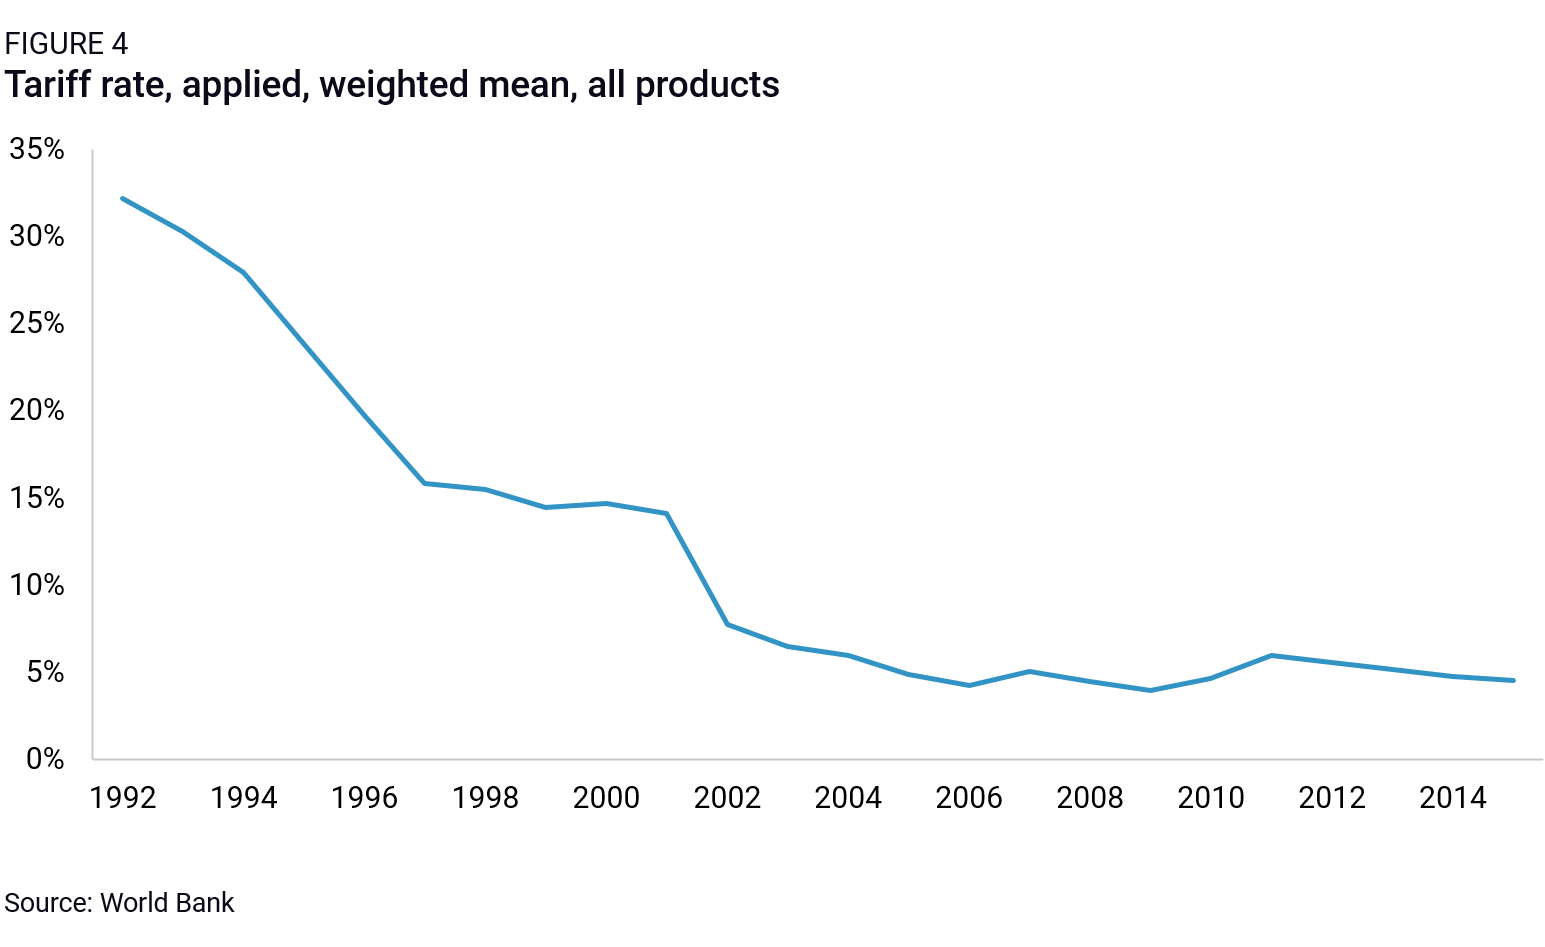
China’s 2001 World Trade Organization (WTO) accession boosted manufacturing investment (domestic and foreign) by reducing risk and uncertainty, and it led to rapid output growth and sourcing opportunities. This accelerated China’s rise as the leading trade nation. Better skills and greater technology adoption in manufacturing broadened China’s comparative advantage, while fast-growing domestic Chinese consumer demand (and the promise of more) gave MNCs another compelling reason to be present. Beijing’s commitment to implement defined WTO rules set a benchmark for long-term expectations and plans for scaling up over time. Concerns remained, especially on intellectual property (IP) theft and forced tech transfers, but the end point seemed right.
Key attractiveness factors:
- WTO accession, with transformational effect on domestic and trade/investment policies (Figure 4);
- Increasingly skilled and productive workforce;
- Fast-expanding infrastructure and logistics capacity; and
- Stable and substantial economic growth.
Post-engagement economic attractiveness, 2015–now
By the mid-2010s, labor was no longer a comparative cost advantage in China, growth was slowing, and its quality was slipping. In most promising industries, lax intellectual property rights (IPR) protection and preferential policies had nurtured robust Chinese competitors. Most important, by 2015, Beijing’s plan to “make the market decisive” was faltering, just two years after being announced. Combined with rising geostrategic rivalry, this marked an end point for “engagement” as a grand strategy, starting with new policy directions in the United States. And yet, while this affected foreign investor appetite, there remained old and new attractions that made diversification difficult.
Key attractiveness factors:
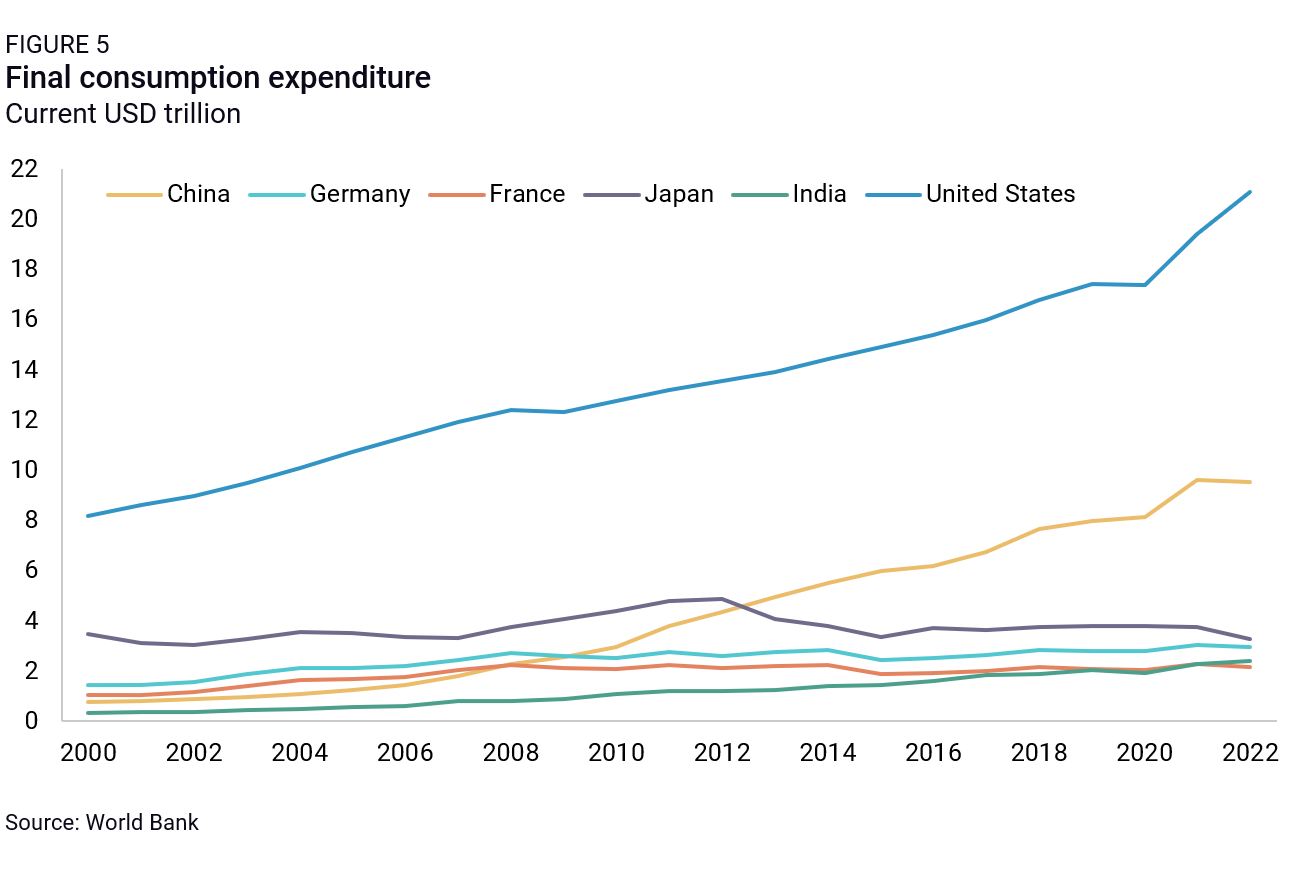
- Growing consumer market (Figure 5);
- Increasing high-tech partnership opportunities;
- Unmatched network benefits, and especially, dense industrial clusters with direct access to diverse suppliers and clients.
Looking ahead: The urge to diversify
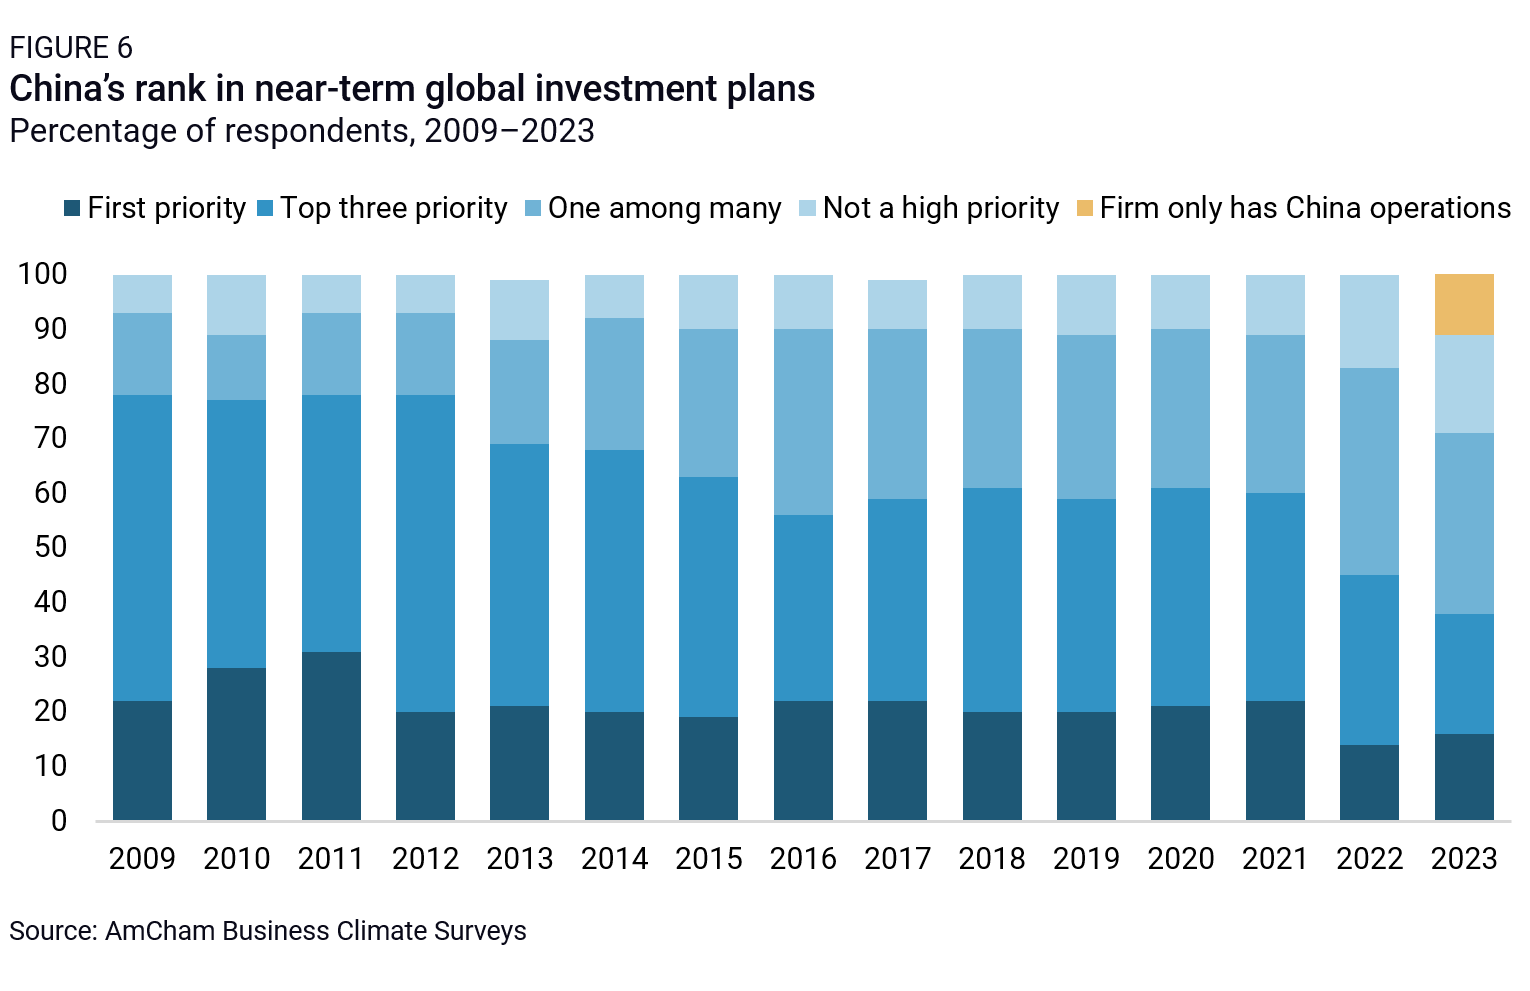
The past decade has prompted a broad reconsideration of China opportunities among foreign firms. For years, remaining market barriers and discriminatory policies were acceptable because China’s growth and policy direction pointed to sustained improvements for MNCs. But this calculus is changing quickly. Today, our research suggests about a quarter of US and European Union (EU) firms are considering or actively moving parts of their manufacturing and sourcing activities out of China, and a wide majority are deciding how to reduce supply risks from over-relying on China. Often, diversification happens in parallel with additional investment on the ground to protect China operations from rising macro, policy, and geopolitical risks or to serve the Chinese market from a local base. But behind this bidirectional picture, firms are actively hedging back in many important sectors.
Chinese policymaking over the past decade has also triggered reactions from governments around the world. Half a decade ago, the United States and other advanced economies started rolling out policies to protect their economies and industries from China’s disruptive practices, including but not limited to heavy-handed support to strategic manufacturing sectors. They also started drawing up “de-risking” policies meant to reduce their dependencies—and those of their domestic firms—on China for a range of critical inputs.
In this context, US firms have been scouting a range of diversification partners for new sourcing, manufacturing, or sales opportunities. We explore the range of these diversification partners in the rest of this report.
Diversification: Potential and actual
Scoring countries for diversification potential
China has been a leading investment, manufacturing, and sourcing player since the 1990s. China represented a considerable 18 percent of global GDP in 2022, but its weight in manufacturing value added was nearly double that at 32 percent. The factors discussed above—physical infrastructure, labor, and marketization—each played a role in this achievement and will weigh against hedging efforts despite Beijing’s discordant policy moves. Decades of paid-in capital and hard-won experience in China will make diversification even more difficult. To compete with China and attract FDI and sourcing operations, alternate economies must compare well on the list of characteristics that made China attractive in the first place. Based on this assessment, the most important factors will be the following:
A cross-border-friendly environment
Diversifying firms look for an enabling business environment that makes setting up and running manufacturing or sourcing activities straightforward and cost effective. This means low trade barriers and a high trade integration—factors that facilitate the import of intermediate inputs (likely from China for some time, at least) and exports of products to global consumers or downstream uses. This also means FDI openness with few restrictions on FDI across manufacturing sectors. An existing track record of hosting foreign investors will provide further reassurance.
Trade and investment openness means lower transaction costs and costs of doing business generally. Openness to trade and FDI also tends to drive productivity growth in the host economy. In more open economies, local manufacturers are incentivized to improve products and customer services, increase productivity, and specialize, leading to a growing pool of high-quality local partners. In a de-risking context, this can help MNCs diversify not just assembly locations but also their pool of alternate suppliers, so they do not simply end up relying on Chinese suppliers in new locations.
Trade and investment openness will matter even more for today’s diversification aspirants than was the case for China because most lack the massive market attraction that Beijing enjoyed. China’s potential market size and—until recently—its rapid pace of development instilled a tolerance for downsides that the typical alternative economy will not possess.
In the same vein, attractive alternate economies will require political and policy predictability. Relative to most emerging markets, China generally offered a stable political and regulatory environment from 1978 to 2015. This can be said of geopolitical conditions, tax policy, labor relations, and the many elements of the “obsolescing bargain” that was famous for frustrating multinational firms in other countries. Firms diversifying manufacturing or sourcing activities know the deal has shifted in China and that they need a long-term alternative rather than just a tactical plan B. They are therefore looking for similar levels of political, policy, regulatory, and economic stability in diversification partners as they previously enjoyed in China. They will also favor countries with relatively low levels of corruption—a major roadblock to more investment and trade activity across many emerging economies.
Finally, high-quality logistics and infrastructure will be crucial to ensure new production and sourcing activities can efficiently connect to global production chains and markets. The quality and quantity of China’s infrastructure was key to the ease of doing business in China. This includes reliable physical infrastructure, such as deep-water ports able to accommodate large tonnage ships, high-quality roads and railroads for in- and out-of-country transportation, and efficient customs clearance and other trade-facilitating services.
Diversification “multipliers”
Alternate economies with similar business environments can present different levels of attraction thanks to “diversification multipliers.” Locations offering not just manufacturing competitiveness, but also high local market potential will be preferred because serving both local and global customers means greater economies of scale. Market potential was often the decisive factor in China’s favor, even when investors knew that potential would not come to fruition for many years.
Another multiplier is cluster effects. While no country will be able to match China’s industrial networks, countries that can offer large and dense industrial clusters, direct access to diversified suppliers and clients, and extensive knowledge spillovers across firms and with local research institutions will be in high demand. High-quality infrastructure and proximity to large cities will also facilitate hiring, procurement, or logistics activities, making manufacturing or sourcing relocation even more attractive.
Sector-specific factors
Different industries look for different skills in a diversification partner. China’s ample low-cost workforce drew early investors from labor-intensive, lower-tech, export-oriented sectors (especially textiles, toys, furniture, and similar light manufacturing with fewer mission-critical quality controls). Firms from these industries look for similar conditions outside China today, though with heightened environmental, social, and governance (ESG) consciousness.
More capital-intensive and high-tech manufacturing firms in electronics, mobility, or chemicals need cost-competitive but higher-skilled workforces, which can be more difficult to locate at the scale available in China. In many cases, a pool of high-skilled employees presupposes that advanced technology has also been adopted into manufacturing, pushing up productivity, and this is also hard to find at China’s scale.
China’s exceptional labor endowment and copious investment in upskilling, combined with expectations of future market potential, allowed it to skimp on IPR protection to an extent not tolerated by leading firms in virtually any other economy. Patience with Beijing eventually gave way to the disruptive trade wars of recent years, in no small part over IPR issues. MNCs are more careful in China nowadays, so of course alternative investment destinations will have to provide better protection for foreign investor IPR in the many high-technology and dual-use industries that are the most important—and often most difficult—to diversify.
Alignment with US national security interests
In addition to the economic factors that made China appealing, diversifying firms will be looking for countries with profiles compatible with US national security interests—a reflection of the growing importance of such considerations in choosing manufacturing and sourcing locations. Factors that demonstrate alignment include military groupings (e.g., security alliances like the North Atlantic Treaty Organization [NATO], the Australia–United Kingdom–United States partnership [AUKUS], or the Quadrilateral Security Dialogue [“Quad”]); political and strategic groupings (including informal groupings such as the G7); economic undertakings with various degrees of formality (such as the Indo-Pacific Economic Framework [IPEF]; EU-US Trade and Technology Council [TTC], or USMCA); or values-defined clubs (such as the Organization for Economic Cooperation and Development [OECD], which is limited to market democracies).
Diversification attractiveness indicators
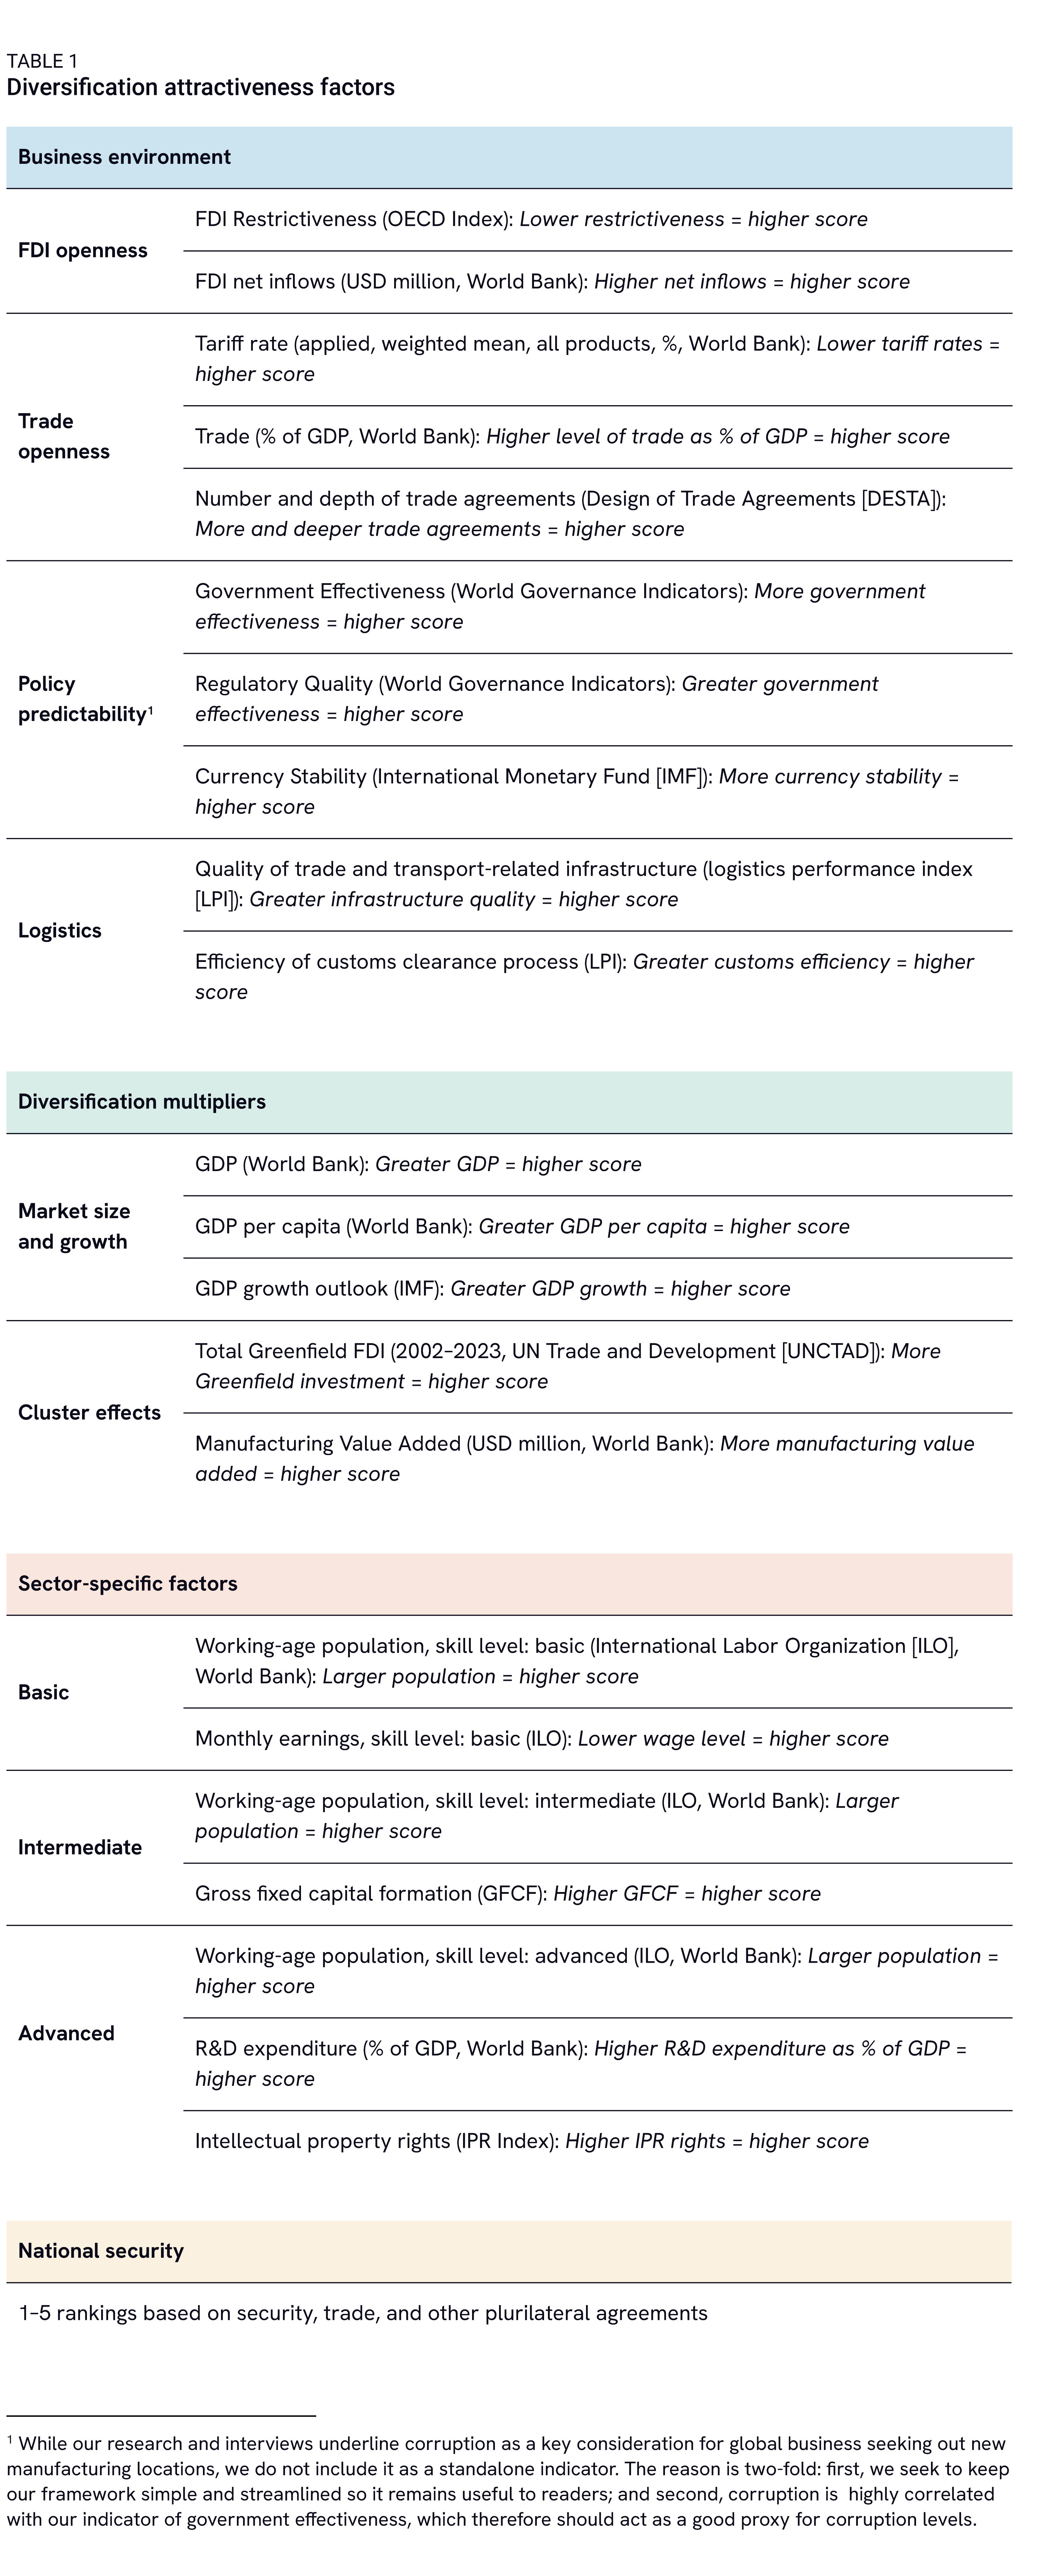
Based on the insights above, we develop the diversification attractiveness indicators in Table 1. Taken together, these offer a framework for assessing China diversification potential for a range of alternate countries. Like any model, this framework is a simplification. Indicators must be readily available and timely for all countries and must cover the many dimensions evidence suggests are important. Our framework is tested against real-world practical experience (including extensive interviews with over three dozen US and G7 firms in a range of industries, business associations in various global locations, and leading global trade and investment economists). This is not a formal, peer-reviewed econometric exercise. Each indicator comes with caveats, and the framework is not meant to predict industry or company-level diversification decisions. Yet it offers a useful perspective on the attractiveness profiles of over a hundred countries across relevant high-level dimensions, which we believe is a novel contribution to policy debate.
ASSESSING DIVERSIFICATION POTENTIAL
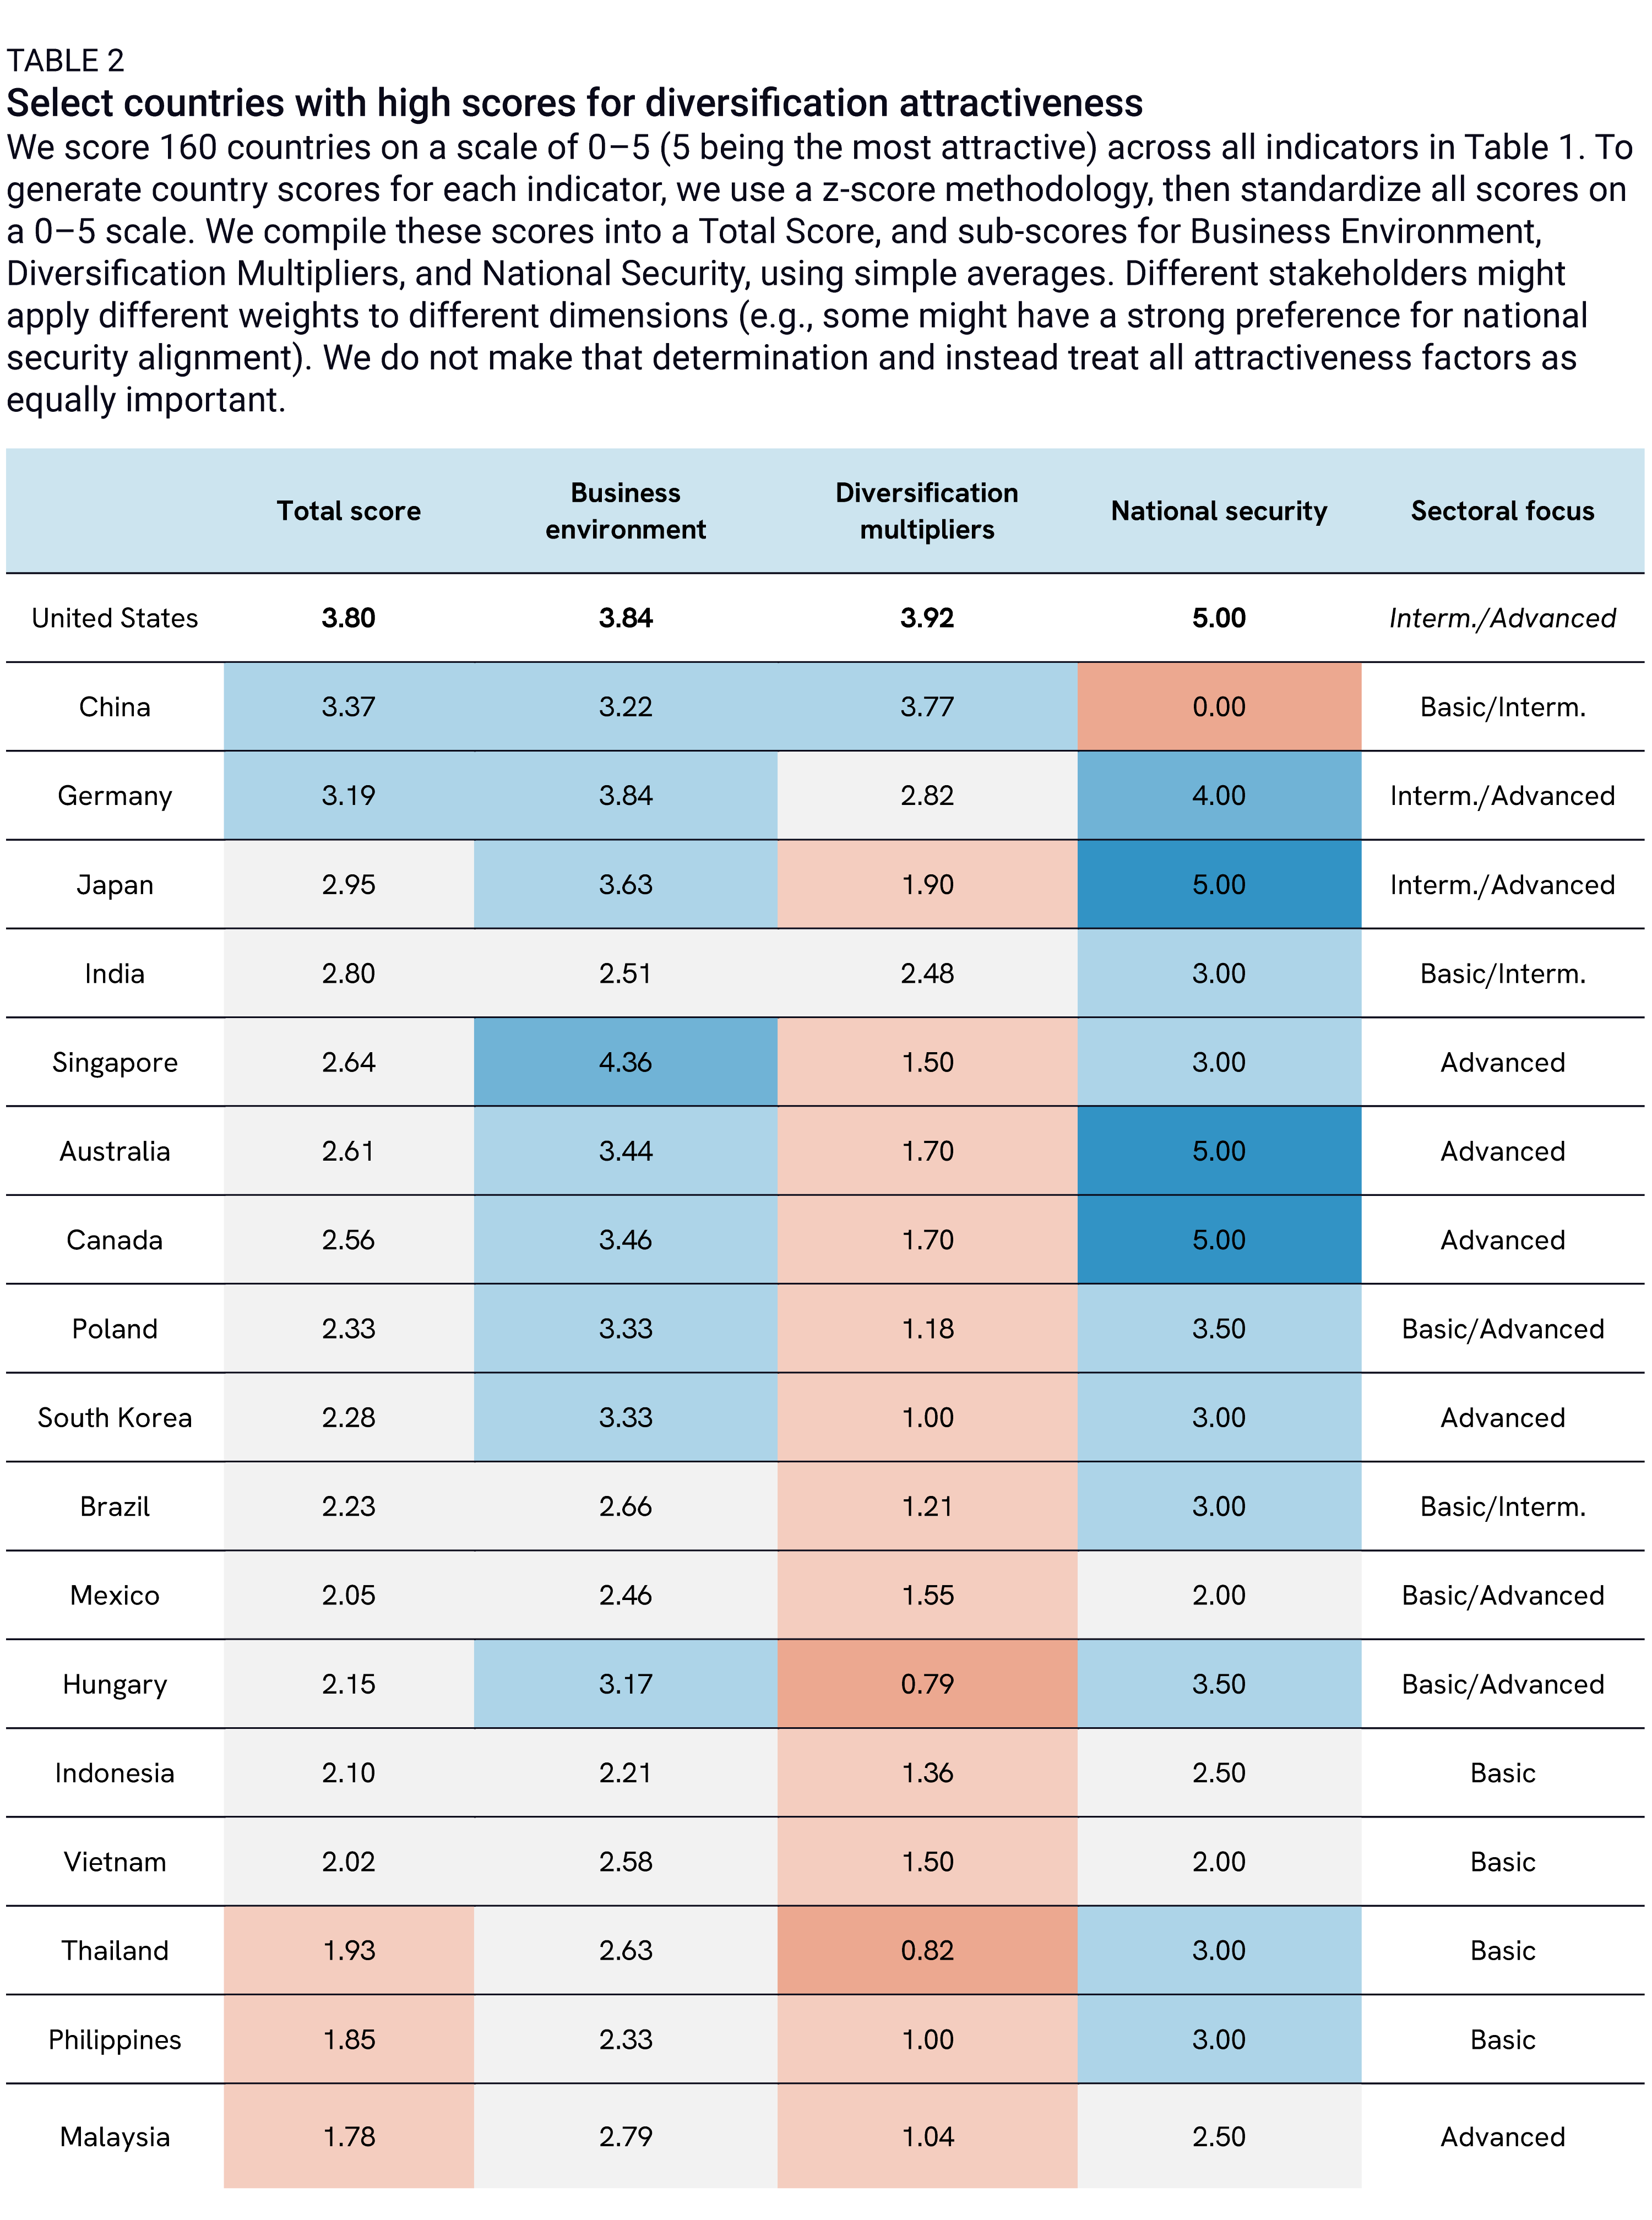
We score 160 economies based on the indicators in Table 1. The resulting picture (Table 2) is mixed: only the United States meets or surpasses China’s total attractiveness level, but several countries show high potential for investment or sourcing across a range of basic, intermediate, or advanced manufacturing sectors—and many surpass China in the business environment dimension before “multiplier” factors are weighed in. Our total score includes a standalone national security alignment score, on which all countries score “better” (more US-aligned) than China. This is an overriding factor for many producers with legacy operations in China in sectors that have been reclassified as a national security concern in recent years due to evolving technological change or other factors.
Cross-country takeaways
Based on the scoring framework, we draw five takeaways:
China is unique: Today, China remains ahead of all countries other than the United States due to its economic size, the scale of its workforce across all industry skillsets, and its relatively favorable business environment and infrastructure strength. This is despite the challenging business conditions seen in recent years and the zero score for national security compatibility we apply to China by design. Because our scoring is based on current indicators rather than guesstimates about the future, the framework may under-reflect negative effects of China’s current economic, political, regulatory, and strategic trajectory, which will naturally impact foreign investment and sourcing decisions.
Size matters: Because China’s demographic and economic size is an integral part of its appeal, other countries that can offer similar scale score high, too. India is the highest-ranking emerging country, despite a relatively low score on business environment factors like trade and FDI openness or policy predictability. This is because, much like China, the country could eventually offer both the dynamic domestic market and network and scale effects so appealing to manufacturers. Other countries, despite their attractiveness, could soon “fill up” and hence see costs rise fast due to input constraints. But size is not enough: Indonesia, the world’s fourth-most-populous country, falls behind much smaller Poland or Mexico due to market barriers and lagging infrastructure.
Skills are needed, but at the right cost and scale: Aside from India, some of the highest-scoring diversification partners are advanced economies (including Germany, Japan, and Singapore) because of a stable and pro-market business environment, openness to trade and investment, high-quality infrastructure, and large local markets. However, high operating costs mean advanced economy diversification attractiveness is more limited to high-skill manufacturing. In comparison, ASEAN nations stand out as potential destinations for basic and intermediate manufacturing. The region ranks second behind advanced economies due to stable political and policy environments, good infrastructure, and—crucially—abundant and cost-effective workforces that allow firms to produce at scale at competitive prices.
Economic dynamism and national security do not always align: The economic dynamism of the ASEAN region puts it slightly ahead of Central and Eastern Europe, which offers great business environments but smaller domestic markets. Security ties to the United States, however, lift scores for Poland and Hungary compared to Vietnam, for example.
Business predictability and government effectiveness are must-haves: A lack of political and policy stability, including high levels of corruption, explains the relative absence of Latin American economies, except for Mexico and Brazil, in our list of top diversification partners despite the region’s high openness to trade and investment.
Country-level takeaways
Germany and Japan
Germany and Japan rank right behind China in terms of attractiveness, thanks to their extremely favorable business environments and high US security alignment. The two countries offer excellent transport and trade-facilitating infrastructure (with scores of 4.5 and 4.4, respectively) as well as high policy predictability (both 4.6). The two countries also offer high trade and investment openness, though Germany ranks slightly higher than Japan, thanks to average tariff rates of 1.5 percent, over a hundred trade agreements, and a 4.8 score for FDI openness (compared to 2.2 percent average tariffs, 22 trade agreements, and a 4.6 score for FDI openness for Japan). Germany also outranks Japan because of the strength of its internal market—not just in terms of GDP size (Germany overtook Japan in 2023 to become the world’s third-largest economy) but also and more importantly in terms of its projected growth rate over the next four years (low in global comparison at 1.4 percent, but more than double that of Japan).
Germany also offers more “network benefits” (scoring at 3.4, compared to 1.9 for Japan) thanks to dense and specialized industrial clusters spread across the country. Both Germany and Japan offer relatively abundant workforces at the medium to high skill levels, though Japan’s endowment here tops Germany’s.
India
India has the highest score (2.86) of all emerging and developing countries in our 160-country sample, well ahead of Poland (2.34), Brazil (2.32), and Mexico (2.22)—the next three. This stems from India’s size and economic promise, granting it the fourth-highest “Diversification multiplier” score of all countries in our sample. India’s economy is now the fifth largest globally, ahead of the United Kingdom and France. And while its GDP per capita ($2,411 in 2022) is still far below that of China, of advanced economies, and of many emerging ones—including Indonesia, Mexico, or Vietnam—the country is projected to grow at an average rate of 6.3 percent over 2024–2028.
India has recently improved in terms of policy predictability and infrastructure, though it lags behind emerging market peers in trade and FDI openness (with scores of 1.7 and 1.9, respectively). These figures only reflect part of the operational difficulties firms report on the ground in India. Nonetheless, steady improvement in these areas over the past decade has encouraged more MNCs to make long-term bets on India.
Finally, India has a very large, low-cost workforce, including an abundance of higher-skilled professionals, which sets it apart from the other emerging economies in our sample (other than China).
Singapore
Singapore, while small, ranks high in Table 2 because it features an especially strong business environment that makes it highly suitable for advanced industries. Singapore comes out on top globally for its logistics (5.0)—with deep integration into global shipping networks—as well as for policy stability (5.0).
The country is also highest in Asia for trade and FDI openness, including through a high-standard FTA with the United States. With an urban, high-skilled labor force and strong IP protections, it has strong appeal for advanced industries.
However, despite high GDP per capita ($82,000), Singapore’s economy is small, limiting the potential for significant domestic growth. Small total labor force size and relatively high wages limit its potential for basic and intermediate sectors.
South Korea
South Korea scores high on logistics (4.5) and policy predictability (4.3) and has skills endowments most suited to advanced sectors.
The country, however, presents a more challenging business environment than Singapore, with lower trade and FDI openness and local protectionism in a range of sectors. Yet in terms of market size and cluster effects, South Korea is still ahead of most other Asian countries.
It also offers high trade, security, and ideological alignment with the United States, including through the US-South Korea FTA.
Poland
Poland ranks highest among central and eastern European economies for diversification attractiveness. It offers a welcoming environment for MNCs, with stable policies and logistics that are better than many of its neighbors.
While it maintains some FDI restrictions, Poland has low tariffs (1.5 percent on average), 78 trade agreements, and an economy highly geared toward trade (124 percent of GDP), contributing to its 3.1 score for trade openness. These attributes, plus its integration into the EU, make Poland a convenient springboard to the broader European market.
Poland also is closely aligned with the United States on national security matters as a member of NATO. But its attractiveness across sectors is weak because it has a smaller population (37.8 million) than countries like China and India or even Vietnam (97.5 million) and Thailand (71.6 million), and its skills are much more spread across different sectors, in contrast to Singapore or South Korea.
Mexico
Mexico, ranking among the top emerging markets in Table 2, presents deep integration with the United States and high skill availability for both lower- and higher-skills sectors at relatively cost-effective wage levels. The country also offers sector-specific skill pools (e.g., automobiles) that might prove highly attractive to firms in these sectors.
Although Mexico scores in the middle of the pack for openness to global trade and FDI, the USMCA means that US firms might encounter fewer barriers on both counts. Similarly, its proximity and logistical tight links to the United States might make up for a relatively low infrastructure score (1.87) overall. Yet to grow as an even larger diversification hub, the country will probably need to invest further in its trade-facilitating infrastructure. It will also need to address persistent corruption and security issues.
Mexico presents a unique quality among emerging markets in Table 2: high cluster effects (2.12, almost double Vietnam’s, triple Thailand’s, and four times Hungary’s). This likely stems from Mexico’s history of attracting US and other foreign firms and its status as a North American manufacturing hub.
Indonesia and the Philippines
Indonesia and the Philippines, despite their large geographies and populations and positive growth outlooks, see their scores hindered by significant restrictions on inbound FDI (scoring 0.63 and 1.01, respectively) and relatively high levels of corruption (including compared to regional peers like Vietnam or India), both of which limit MNC opportunities. Both countries are also relatively less opened to trade than their neighbors Vietnam and Thailand, and they offer poorer trade infrastructure. These factors have prevented them from developing the attractive cluster effects seen in Mexico.
Still, Indonesia’s and the Philippines’ large low-skilled workforces and low wages will attract investors in some basic sectors, where the Philippines scores sixth globally. A fast five-year growth outlook (5 percent for Indonesia and 6.2 percent for the Philippines) is a strong inducement, as are the Philippines’ tight US defense ties.
Vietnam
Vietnam benefits from strong trade integration, with 26 trade agreements overall (including a high-standard FTA with the EU and deepening integration with China through the Regional Comprehensive Economic Partnership [RCEP]) and a low average tariff rate of 1.3 percent. Its large low-skilled labor force makes it an attractive diversification locale for basic sectors. The country also presents a relatively stable business, policy, and economic environment, which boosts its policy predictability score to 3.6, just behind China.
Yet Vietnam stands behind many other diversification aspirants in a number of categories. Like Indonesia and the Philippines, Vietnam’s FDI restrictions are significant, and its logistics lag behind those of many other Asian countries. The economy is growing strongly, with GDP projected to expand 4.6 percent on average through 2028 from a modest base. But despite capturing significant supply chain diversification to date, cluster effects are still limited.
Finally, in terms of geopolitical alignment, Vietnam has a complicated history with both China and the United States and presents some unpredictability for industries sensitive to security considerations given swelling China-Vietnam commercial ties.
Estimating actual diversification
How does this picture compare with actual China diversification? We look at this question in terms of both trade and investment patterns since the start of the US-China “trade war” (2017–present). Trade and FDI data have drawbacks that cloud some diversification nuances but do provide a basic gauge of recent trends.
Our analysis suggests the following findings:
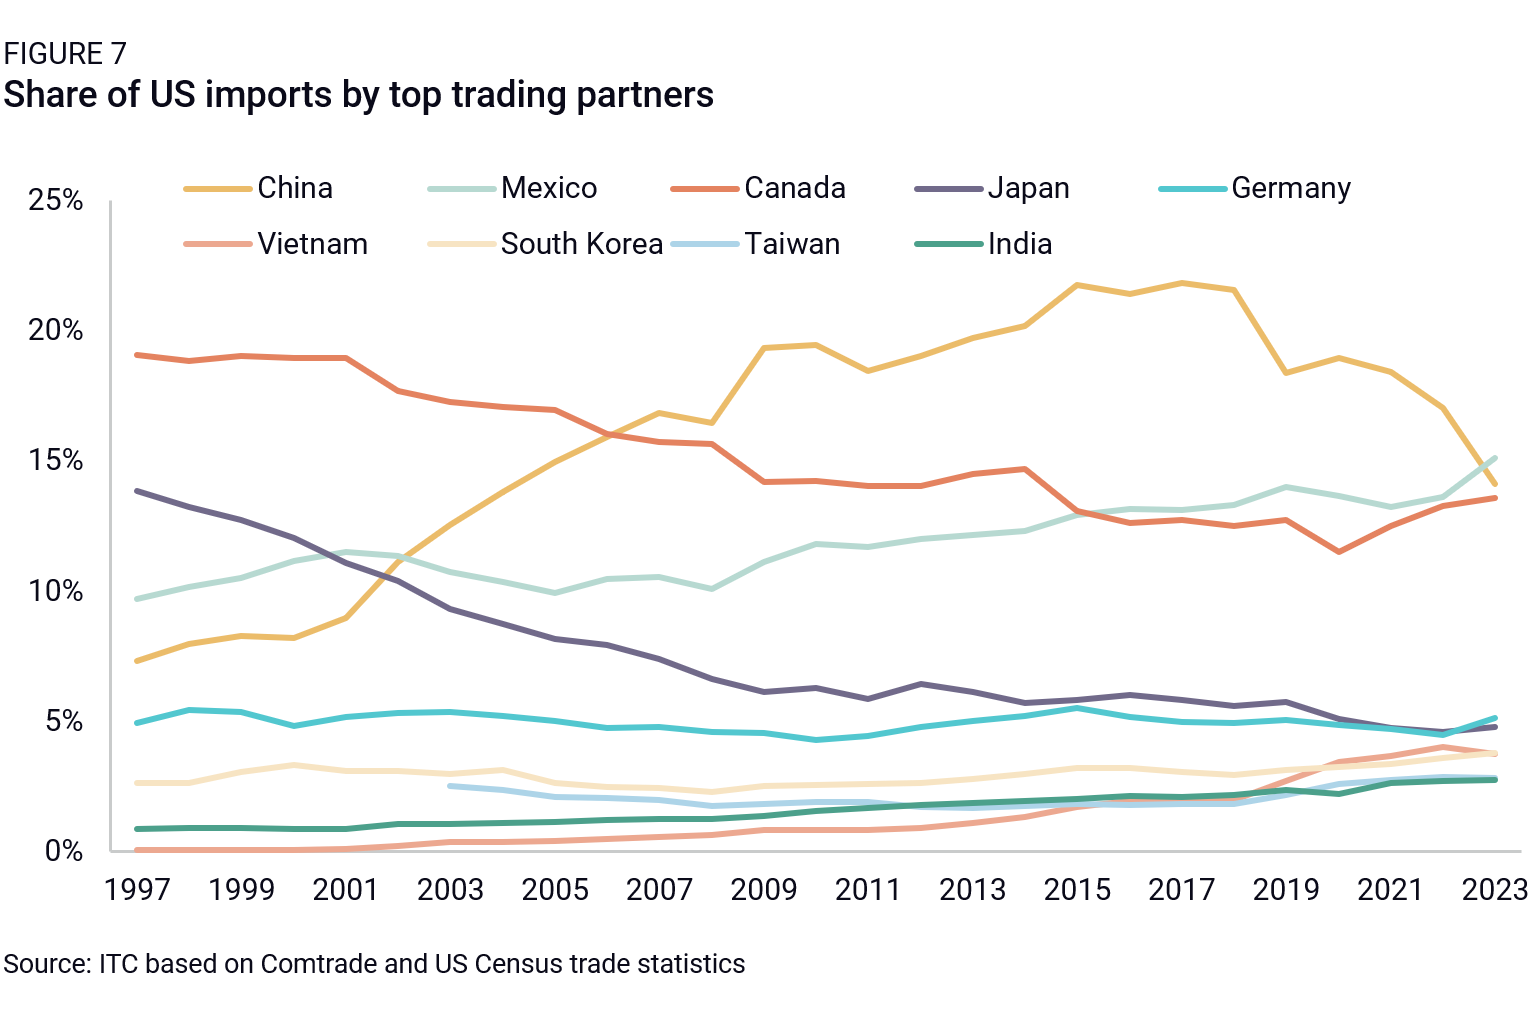
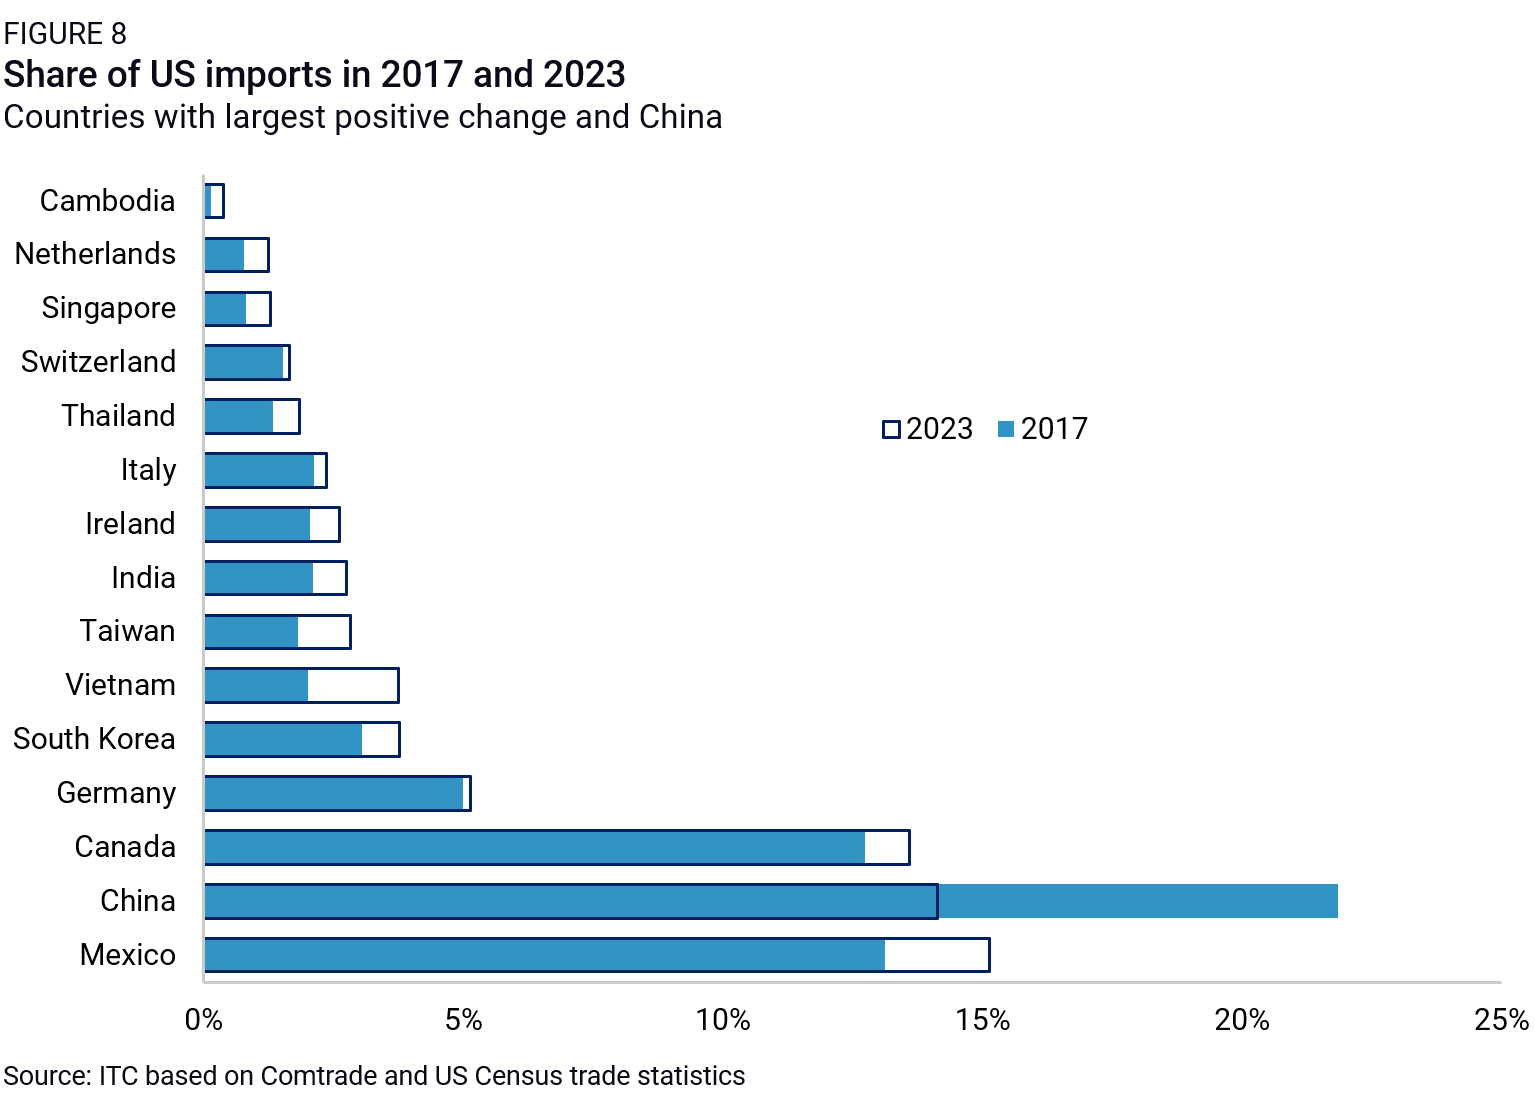
There has been substantial US trade diversification from China over the past five years: The US-China trade war starting in 2017 resulted in the relocation of sourcing and manufacturing activity (Figures 7 and 8), especially for tariffed goods. Some level of transshipment might explain part of the picture, and US trade data are distorted by de minimis shipments that are not taken into account in US statistics. Yet, the evidence that companies more permanently relocated final assembly to countries like Mexico or Vietnam is compelling, even if they still employ China-sourced inputs in those operations.
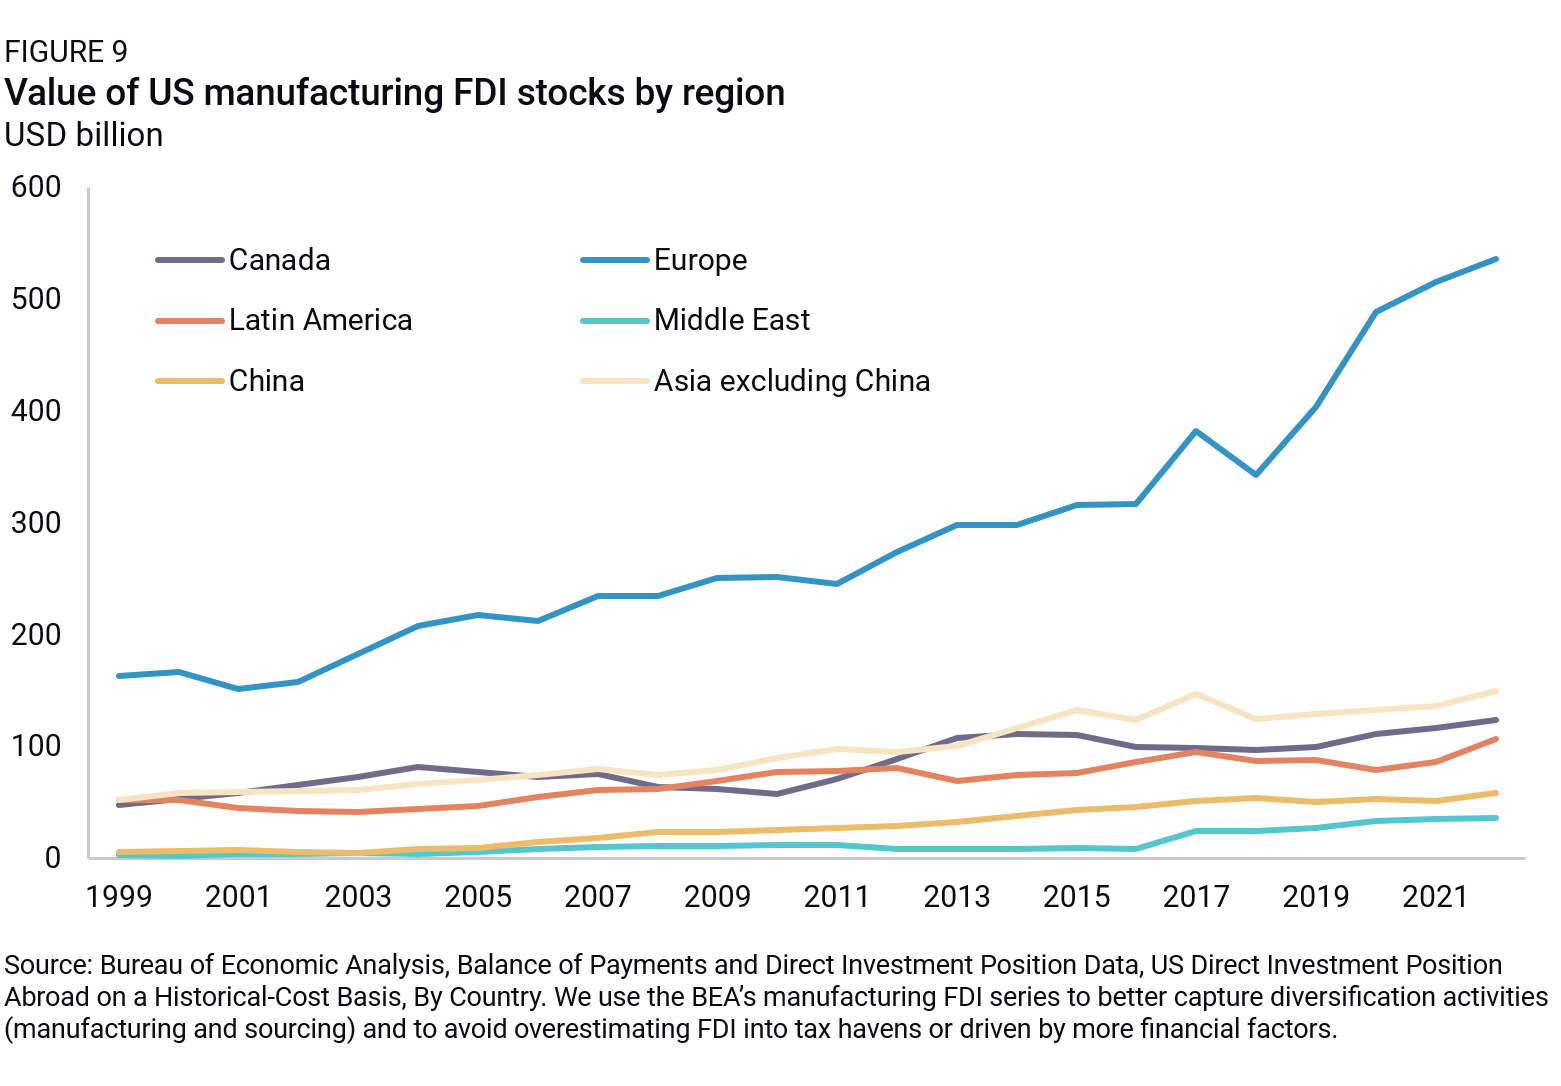
FDI disengagement by US firms has been less pronounced (Figures 9 and 10): China’s share of US manufacturing FDI stocks also declined over the past seven years, but just by 0.7 percentage points (pp), compared to 8pp for trade, likely for two reasons. First, US FDI in China plateaued earlier than 2017, about a decade ago, in the face of persistent operational challenges and rising local competition. Second, diversification patterns have been tempered in recent years by large “in China for China” investments—investment meant either to better serve the Chinese market through a local presence (sometimes imposed through regulatory pressure) or to build up resilience and one’s ability to continue operating inside China in the event of further market bifurcation. This has occurred even as the number of discrete US FDI transactions into China continued to decline, according to Rhodium data.
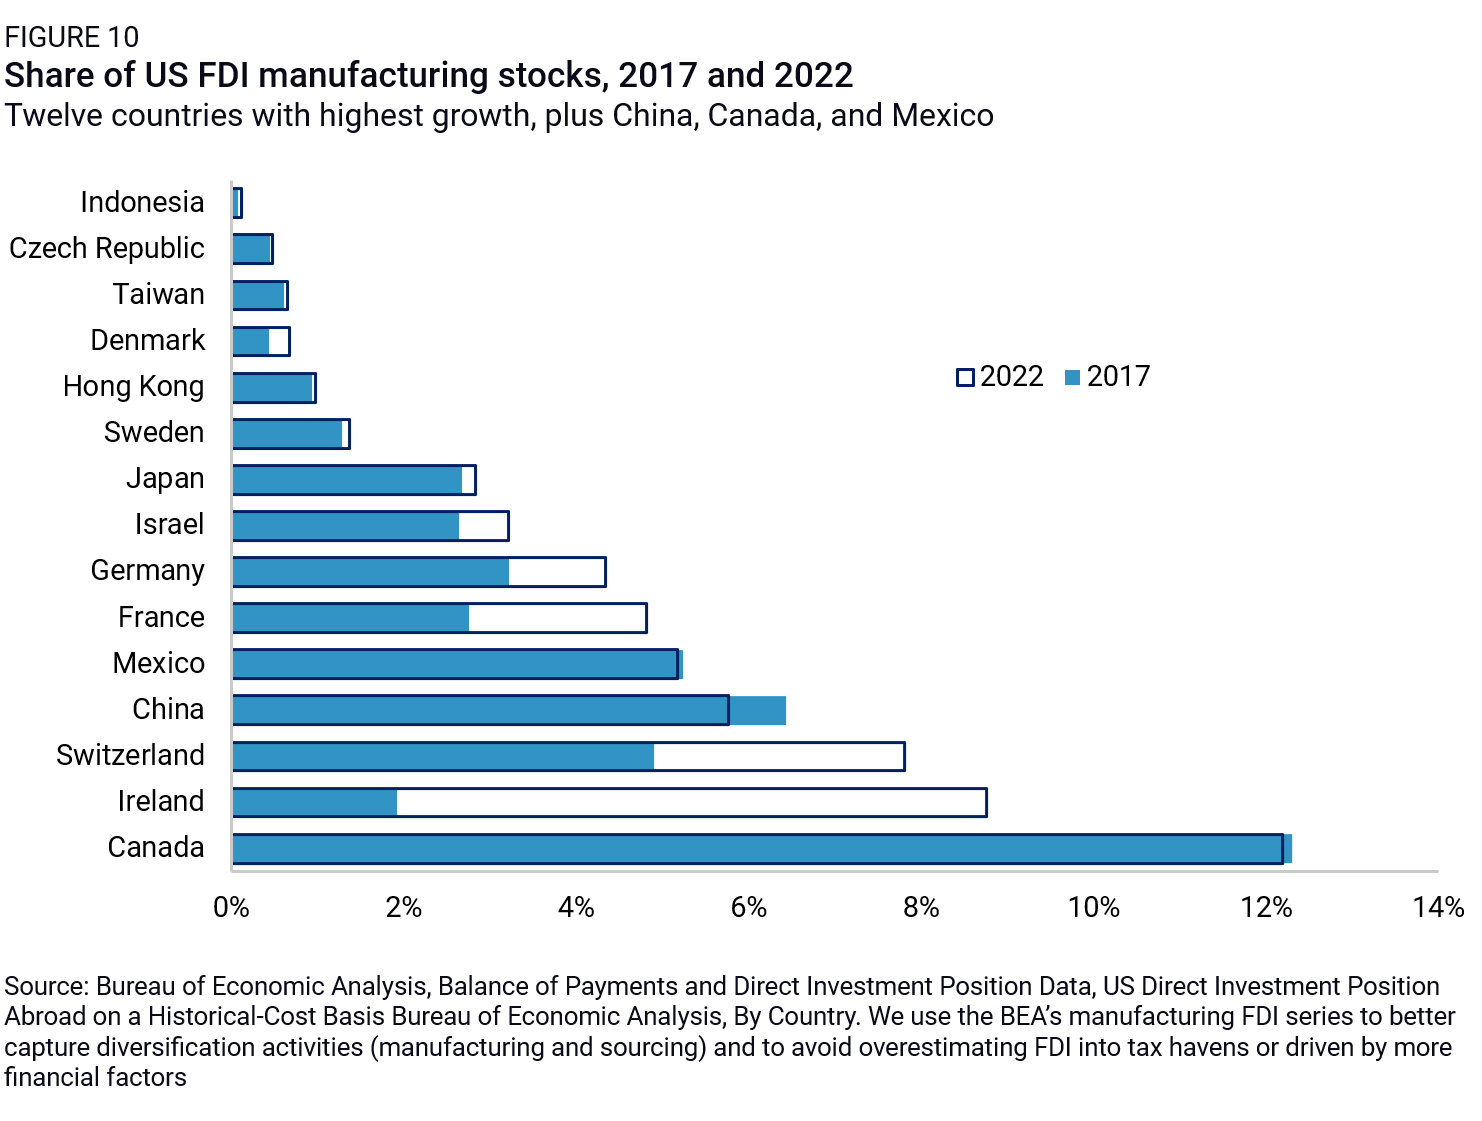
Mexico and Vietnam dominate the trend, Taiwan emerges as a major new partner (Figures 8 and 10): Mexico has quickly captured US market shares in trade (+2.0pp) while maintaining its high share of US manufacturing FDI. This aligns with its attractiveness profile (it features among top potential diversification partners in Table 2) and its trade integration with the United States through the USMCA. Vietnam’s share of US imports also jumped 1.7pp over the past five years. Taiwan, finally, was the only other partner to capture more than 1pp of US imports over the period, in addition to featuring among the top 10 destinations with the highest growth in US FDI.
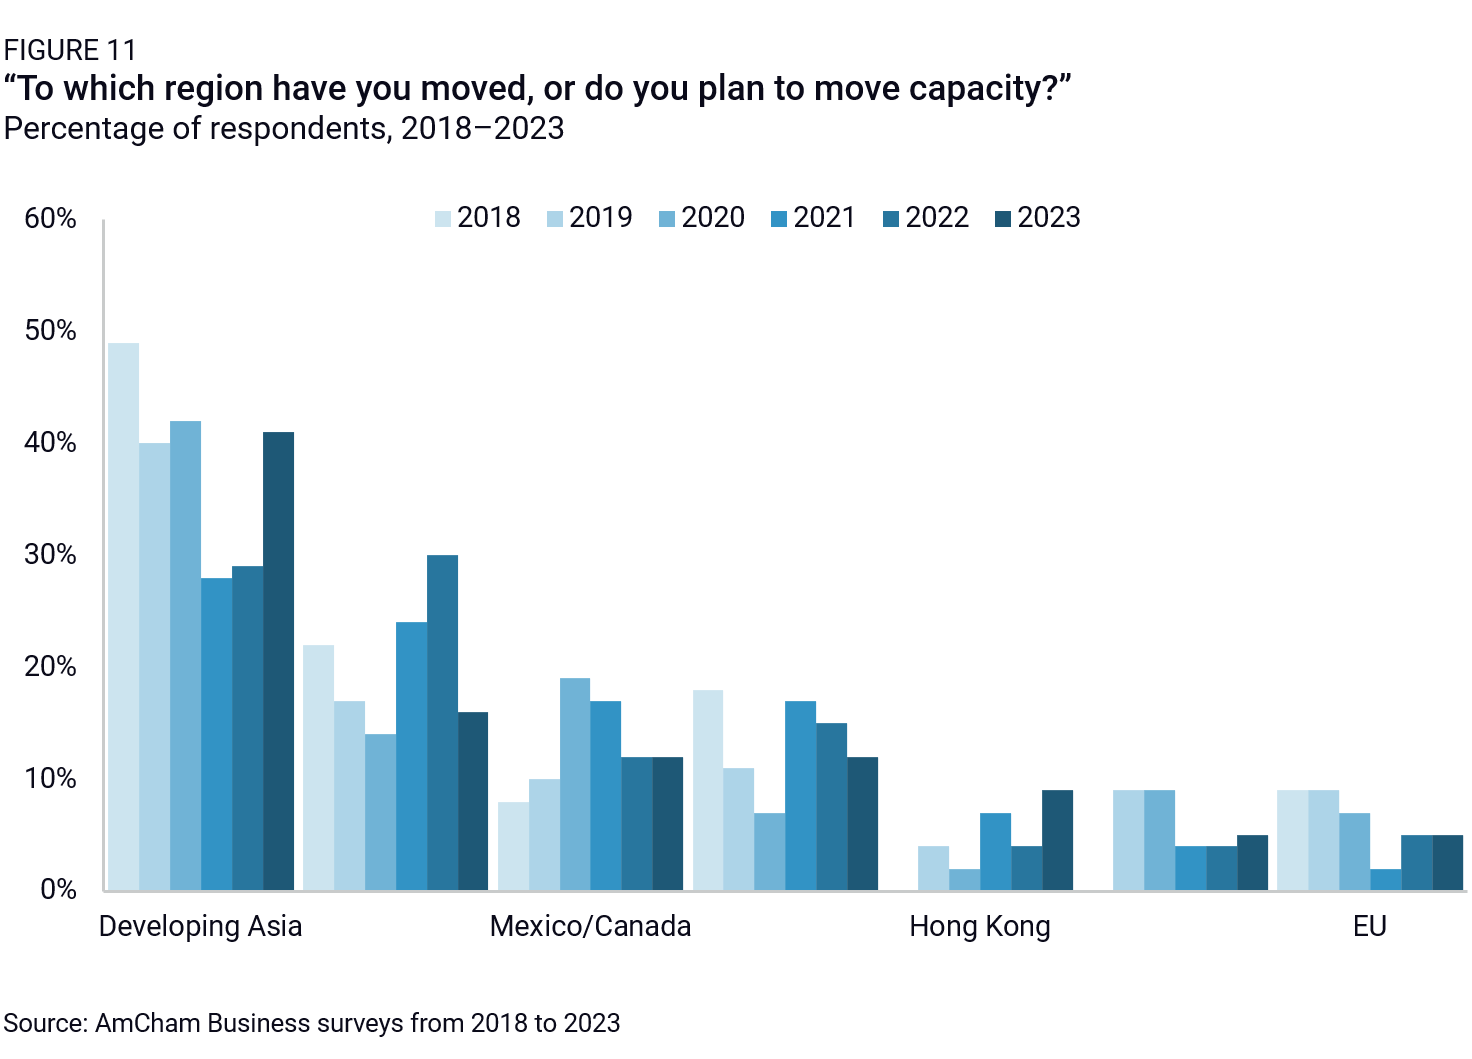
The rest of “developing Asia” punches below its weight (Figures 8 and 10): Even though US firms have in recent years flagged developing Asia as a priority destination for moving manufacturing capacity outside of China (Figure 11), no country in the grouping besides Vietnam has increased its share of US imports by more than 1pp (India, Thailand, and Cambodia respectively gained 0.65pp, 0.51pp, and 0.25pp between 2017 and 2023). Indonesia and the Philippines do not even make the list of top 15 US trade diversification partners, despite stronger security alignment with the United States than Vietnam.
Trade and FDI diversification often do not align (Figures 8 and 10): Aside from Germany and Taiwan, and to a lesser extent Mexico, new US trade diversification partners have not seen significant new US investment interest over the period. Instead, US FDI market share growth has concentrated in advanced economies (Figure 10). This could suggest two things: that US investors are reluctant to invest in unproven emerging markets with relatively more risky business environments; and/or that non-US firms—especially Chinese and Taiwanese ones—may be providing the FDI that is driving trade diversification, especially in Asia.
Diversification is not just an emerging economies story (Figures 8 and 10): Countries including Ireland, Switzerland, France, and Germany topped recent increases in US manufacturing FDI, likely due to large final markets, higher capital expenditure for more advanced manufacturing, and—possibly—tighter national security links now crucial to cooperation in sensitive fields. (In the case of Ireland, tax optimization may be a factor, too, even for manufacturing FDI.) Germany, South Korea, Taiwan, and Singapore also come up as quickly rising trade partners of the United States, especially for higher-value products like electronics, despite higher operational costs than other Asian destinations. Missing from this picture, however, is the United States’ close security partner Australia, which has not captured significant additional trade or investment market shares from the United States in recent years (this might be linked to the commodity-based nature of Australia’s economy, which sets it apart from other advanced markets).
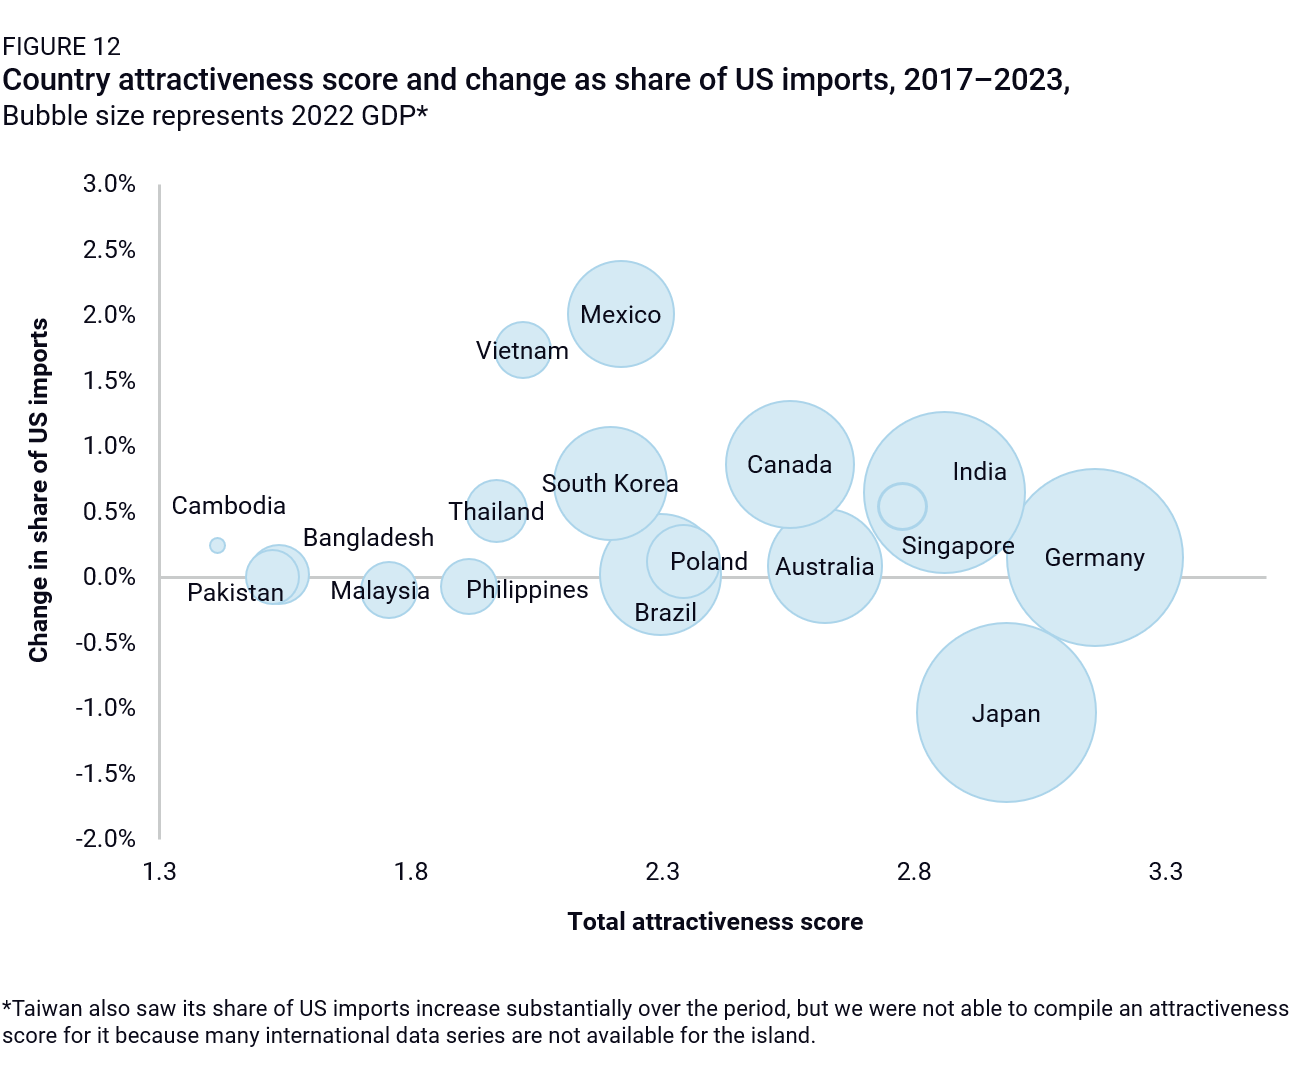
Despite a wide range of suitable partners, diversification is—ironically—highly concentrated in a few countries (Figure 12): In comparison, most countries that score high for attractiveness in Table 2 did not capture more than a few decimal points of US import share growth. This presents a clear risk of diversification hitting a limit (if Mexico and Vietnam “fill up” or are determined to be too China-friendly in the future), but conversely, it means there are opportunities to unlock more diversification activity through policy action.
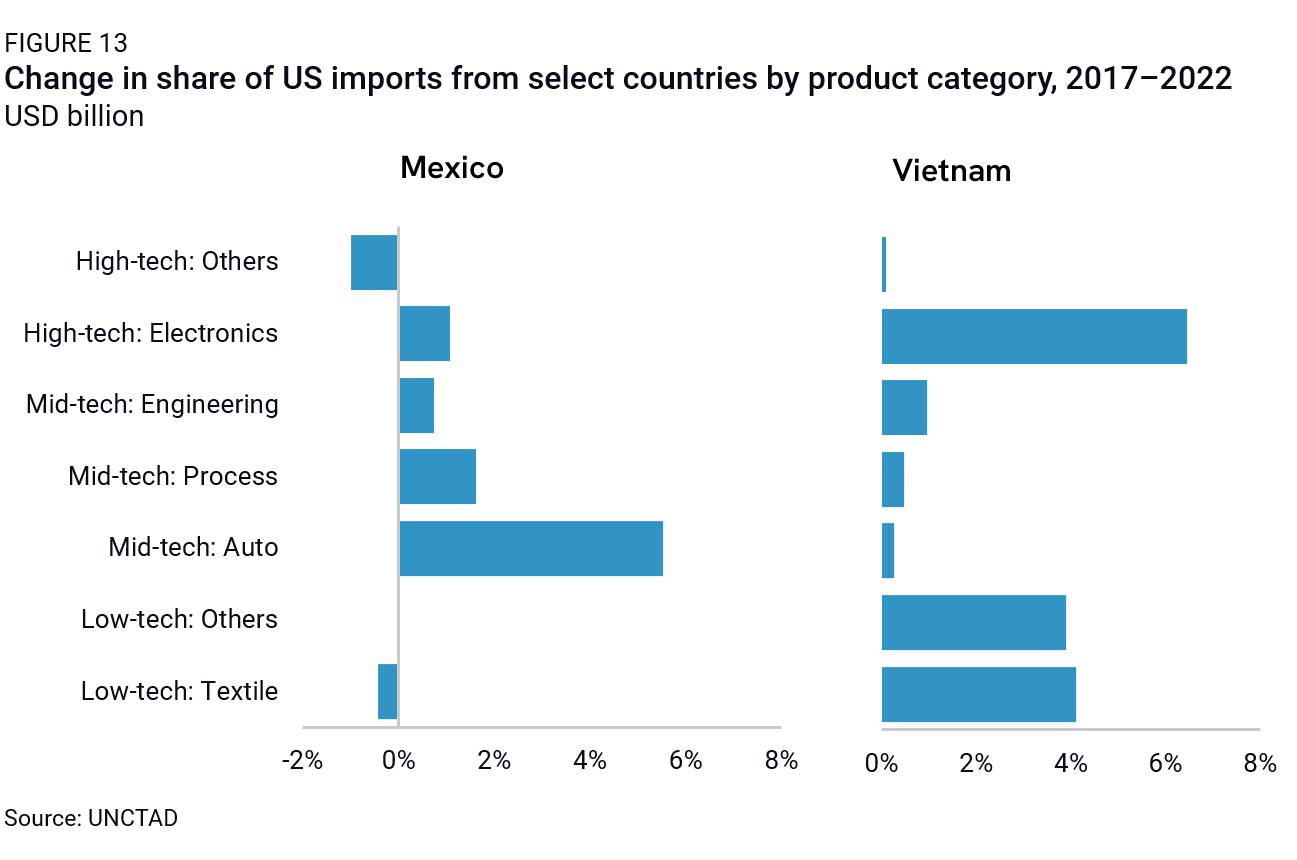
Diversification is concentrated in a few sectors, too (Figure 13): A major portion of Vietnam-US trade growth has come from electronics and low-value goods, including textiles and furniture (typically—but not only—tariffed productions that likely benefited from Vietnam’s proximity to China, openness to Chinese inputs, and low-skill workforce). Most of the recent Mexico-US trade and FDI surge has for its part come from automobiles (likely driven by a suitable skills base and additional regional content requirements for autos within the USMCA). So far, diversification has been uneven across industries and hindered in some sectors either by a lack of a skilled workforce or other positive business conditions in diversification partner countries (trade barriers and regulatory conditions, especially).
In many sectors, diversification remains shallow: Conversations with diversifying companies, a broad review of their public statements, and a look at China-Partner-US trade patterns suggest that much diversification activity to date has focused on final assembly, with relatively less movement in upstream supply chains and higher-value-added segments. This might be the result of tariff-hopping strategies that focused on relocating “just enough” activity to qualify for lower import tariffs to the United States. For a few years, firms might have also been waiting to see if geopolitical tensions and global trade and investment barriers were temporary or durable. As a result, diversified manufacturing activity today remains deeply reliant on suppliers and inputs from China.
This could change in the medium to long run. Amid slower Chinese GDP growth, deteriorating business conditions in China, more aggressive competition from Chinese firms, and greater geopolitical risks, firms might contemplate deeper adjustments to their production or sourcing footprints. The buildup of denser and more diverse industry clusters in partner countries could also facilitate and attract yet more diversification activity over time and create deeper supply chains on the ground.
National security alignment is not yet a major driver of diversification: A range of US security partners—including Australia, Japan, and the Philippines—are seeing only limited gains in their share of US imports or outbound FDI, and much trade diversification from China has centered on less-aligned partners, including Vietnam or even Cambodia. This suggests that, so far, security considerations remain underweight compared to operational issues like trade openness, skills availability, or legacy investment.
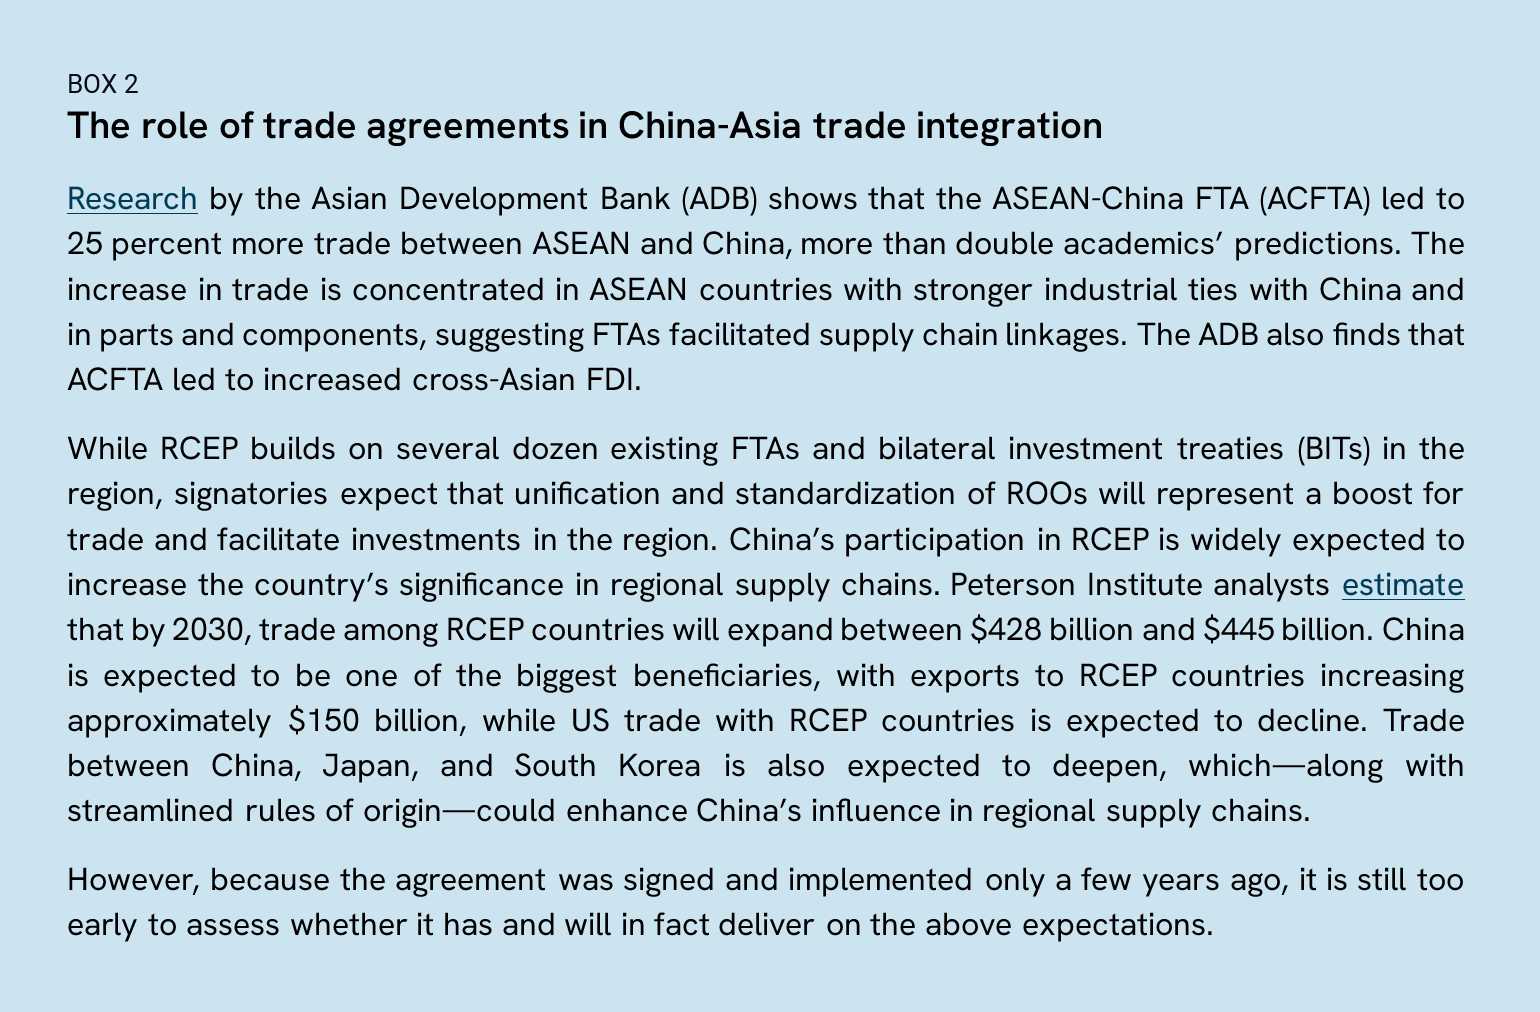
China’s trade preferences also drive diversification: A few Asian nations have emerged as diversification partners despite low attractiveness and national security ratings (e.g., Cambodia), likely thanks to heavy Chinese investment and provision of intermediate goods. More broadly, ASEAN’s trade integration with China through the China-ASEAN FTA means Chinese inputs can be sourced cheaply and face low tariff barriers, which might explain some of the trade diversification patterns observed in the region. This could increase further with RCEP implementation as the partnership further streamlines rules of origin (ROOs), reduces tariff and nontariff barriers, expands protections for IP, and facilitates e-commerce (see Box 2).
Takeaways on potential and observed diversification
As summarized at the start of this report, we come to several working takeaways. In the aggregate, China diversification is certainly happening, but it is concentrated in a few countries (Mexico and Vietnam stand out), creating capacity risks. The most active change is in a few sectors (textiles, electronics, and autos) and centered on assembly activities. Some of the shift in US imports is driven by non-US firms, especially Chinese and Taiwanese ones, and the countries to which China activity is moving are often not strong US allies like Japan, Australia, or the Philippines. Finally, advanced economies generally are an underappreciated part of the diversification story: beyond Mexico and Vietnam, countries picking up important trade and FDI market shares include Canada, Taiwan, Germany, and South Korea, among others.
Against that backdrop, two variables appear most significant in explaining the gap between the potential to absorb diversifying activity and the outcomes. The first is the role of trade agreements, which are prominent for the standout performers. The USMCA provides US trade market access for firms in Mexico and more predictable investment and regulatory environments, helping to offset challenges such as those around taxation and labor. The long-running process of North American market integration also increases the possibility of cluster effects in some sectors.
Vietnam, meanwhile, has formal trade ties with China through the ASEAN-China FTA (ACFTA, then RCEP), reducing imported Chinese input costs crucial to Vietnam’s role as an assembly hub. A 2019 FTA with the EU as well as Vietnam’s longstanding bilateral trade agreement (BTA) with the United States help to maintain access to the major final markets for Vietnamese exports. In general, deepening intra-Asian trade links, especially with the conclusion of RCEP and the Comprehensive and Progressive Agreement for Trans-Pacific Partnership (CPTPP), have driven regional trade and investment integration (Box 2) and help explain why countries from Vietnam to South Korea and Singapore get more traction than other geographies across a range of sectors. In comparison, a lack of trade integration—especially into preferential sectoral or regional trade agreements like the Information and Technology Agreement (ITA) 2, the Agreement on Government Procurement (GPA), or RCEP and the CPTPP—is cited by MNCs as the reason India punches way below its weight as a diversification partner.
The other variable conspicuously shaping the playing field is people. Diversifying companies are prioritizing large and/or qualified workforces. Basic skills availability is cited as the reason Vietnam has drawn textiles, furniture, and electronics assembly activity. A critical mass of higher-level auto manufacturing skills is drawing firms to Mexico, and increasingly skilled workers are the key factor in higher-wage Malaysia, South Korea, or Canada (for electronics manufacturing and other technology sectors).
Skills upgrading will likely be key to realizing China-diversification potential for many economies in the years ahead. Today’s leaders, such as Vietnam, are experiencing cost pressures due to that success, and expanding workforce capacity will determine whether their potential is maxing out.
The gap between potential and outcomes is not just about trade agreements and today’s workforce skills, however. And it is not surprising, either. Diversification is new and requires time. The need to depreciate sunk capital, move complex supply chains, secure new incentives, and wait while slow-moving governments upgrade domestic regulations and negotiate agreements across borders all prevent diversification from happening overnight. New manufacturing facilities take time to build, as do sourcing relationships. Trade tends to follow investment, which happens in cycles for a mix of reasons. Early diversification moves were motivated by US-China tariffs; the double threat of a slowing Chinese macroeconomy (aggravated by Taiwan Strait tensions) and expanding national security de-risking across the OECD is more recent.
As diversification expands beyond assembly work to more value added and upstream segments of the value chain, countries with higher skill profiles and regulatory environments and deeper trade integration will see more opportunities for friendshoring. “Just in case diversification” motivated by the COVID experience is likely to be followed by more complex motivations and deeper re-localization.
Many industries and products will only have the potential to diversify if hard-to-achieve preconditions are met. Some are so dominated by China (like many information and communications technology [ICT] components) and/or so heavily subsidized that competing elsewhere on marginal prices may not be feasible without steep and costly policy interventions. China’s present advantages in scale and scope are massive and anchor a hard-to-challenge position in many tradable sectors.
Just two years ago, numerous policymakers and executives viewed China diversification as an unlikely theory, not a phenomenon in progress. But today, reducing China reliance is seen not as impossible but as an imperative for many global firms. This is not solely contingent on carrots or stick policies from advanced economy governments. Diversification takes time—but it is happening and will deepen in the years ahead.