Clean Investment Monitor: The State of US Clean Energy Supply Chains in 2025
Since the US enacted the IRA, manufacturing has emerged as the fastest-growing segment of investment in clean energy technologies. We assess the state of key clean technology supply chains for solar, wind, batteries, and electric vehicles.
Summary
Since the US enacted the Inflation Reduction Act (IRA), manufacturing has emerged as the fastest-growing segment of investment in clean energy technologies. Quarterly investment in clean manufacturing more than tripled—from $2.5 billion in Q3 2022 to $14.0 billion in Q1 2025—primarily driven by the electric vehicle supply chain. Companies have announced 380 clean technology manufacturing facilities since the bill was signed into law on August 16, 2022, nearly half of which were operational as of March 31, 2025.
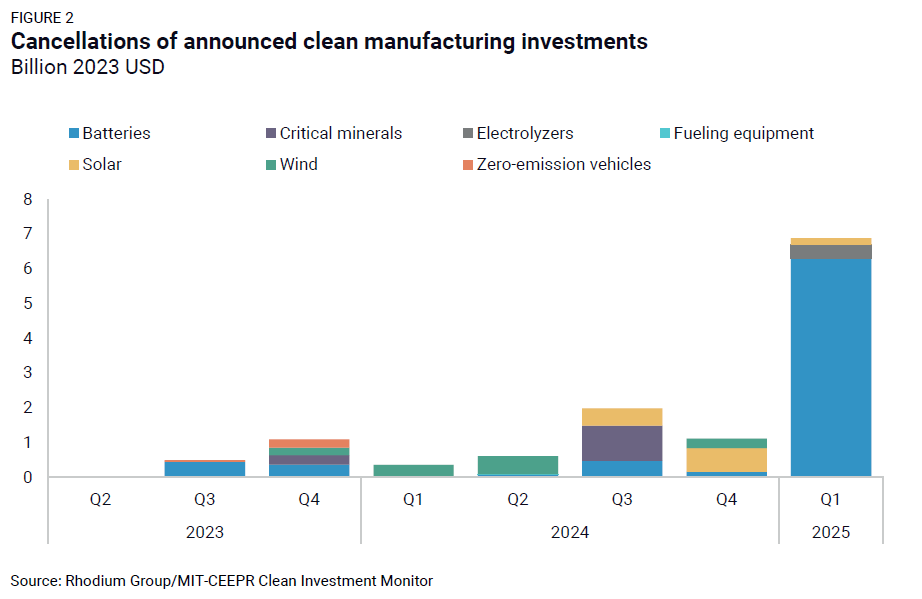
This rapid buildout reflects an intensifying global competition to onshore clean technology supply chains and boost domestic manufacturing. The Section 45X Advanced Manufacturing Production Tax Credit has played a central role, directly subsidizing US-based production of key components like battery cells, solar modules, and wind turbine components. At the same time, the sector faces rising headwinds from tariff escalations, an uncertain federal policy outlook, and broader macroeconomic pressures. In the first quarter of 2025, six announced projects—representing $6.9 billion of investment—were cancelled, the highest quarterly value on record. Still, companies announced $9.4 billion in new manufacturing projects, a 47% increase from Q4 2024, though 23% below the value announced in Q1 2024.
In this note, we assess the state of supply chains for solar, wind, batteries, and electric vehicles (ZEVs) as of Q1 2025 by comparing announced domestic manufacturing capacity from the Clean Investment Monitor database with annual deployment of those technologies in 2024, and the range of anticipated 2030-2035 demand projections from Rhodium Group’s 2024 Taking Stock report. These projections assume existing regulations and tax policies remain in place.
Since the IRA’s enactment, battery and solar manufacturing have seen the strongest growth in both investment and capacity. ZEV manufacturing capacity is also scaling steadily. In contrast, wind manufacturing has lagged, with declining investment, few new project announcements, and limited capacity expansion. Domestic battery manufacturing capacity for cells and modules now exceeds current deployment levels. Based on Rhodium Group projections for ZEV sales and grid-scale storage, it is on track to align with or surpass projected demand through 2035. Solar module production is on par with current deployment. It could be equivalent to roughly 55% of projected annual capacity additions by 2035 under a rapid decarbonization scenario, thanks partly to significant thin-film capacity. ZEV manufacturing capacity already exceeds 2024 sales, and if all announced and under-construction facilities come online, US production capacity could reach 6.84 million vehicles in 2035—equivalent to 60-67% of projected annual ZEV sales between 2030 and 2035.
This report summarizes key trends from our tracking of clean energy manufacturing investment, updated through Q1 2025. Our full Q1 2025 update to the Clean Investment Monitor database—including tracking the deployment of clean technologies—will be released in the coming weeks.
Tax credits fuel a domestic manufacturing boom
The IRA’s manufacturing incentives—particularly the Section 45X Advanced Manufacturing Production Tax Credits—have helped catalyze investment across nearly every stage of the clean technology supply chain. Companies have announced new projects that will increase domestic production of critical minerals, batteries, EVs and chargers, solar module components, wind turbine components, and electrolyzers needed for clean hydrogen.
From the law’s enactment in Q3 2022 through Q1 2025, actual investments in US-based manufacturing of these clean energy and transportation technologies totaled $115 billion, a dramatic increase from the $21 billion invested in the same time period preceding the law. There was a surge of project announcements in 2022 and 2023, which peaked in Q4 2022 at $30.9 billion in new commitments. Many of those announcements are now moving forward into construction and operations. While actual investment slowed slightly in Q1 2025—down 11% compared to Q4 2024—it remains 8% higher than Q1 2024 (Figure 1). Companies have announced 380 clean technology manufacturing facilities since the IRA was signed into law on August 16, 2022, and 161 of those are now operational.
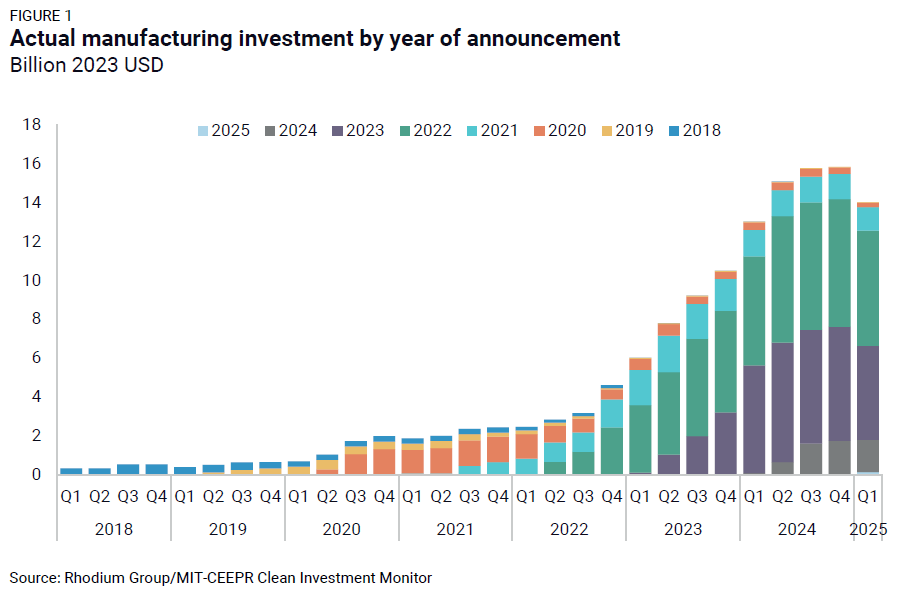
The US is engaged in an increasingly heated global competition to strengthen its domestic manufacturing industry and ensure stable and resilient energy supply chains—an effort significantly bolstered by the IRA’s tax credits. These incentives have helped attract historic levels of investment—including $9.4 billion worth of projects announced in Q1 2025, up 47% from the previous quarter, though 23% below Q1 2024 levels. At the same time, the sector faces growing headwinds from evolving tariff changes, federal policy uncertainty, and trade tensions. In the first quarter of this year, six manufacturing projects tied to $6.9 billion of investment were cancelled—the highest value of quarterly cancellations on record. If we factor in earlier-stage cancellations, including facilities halted before site selection and facilities retired in Q1, that total rises by $2.1 billion to $9.0 billion. The uptick in new announcements, coupled with significant cancellations, highlights both the progress achieved under the IRA and the risks posed by an unstable policy environment.
Domestic supply chain snapshot and look ahead
Investments in domestic clean energy and transportation manufacturing are central to ensuring a resilient US energy system, strengthening US industrial competitiveness, and supporting the transition to a cleaner economy. This report examines how effectively IRA-era investments translate into actual domestic supply chains for four key technologies: wind, solar, batteries, and EVs.
We evaluate current production from operating facilities and anticipated capacity tied to these operating facilities that have yet to come online. We separately identify capacity levels for under-construction facilities and those that are announced but have not yet broken ground. Where possible, we compare manufacturing capacity with actual 2024 levels of clean electricity deployment and EV sales, as well as the range of projected annual deployment of these technologies from 2030 to 2035, utilizing projections from Rhodium Group’s 2024 Taking Stock report. This comparison sheds light on where further investment would support US energy independence.
The deployment projections used in this analysis reflect three potential economic and technological scenarios: a low emissions case in which cheap clean energy technologies and relatively more expensive fossil fuels continue to drive a rush of investment into decarbonization technologies, which face little friction in deploying to their economic maximum in an economy growing slightly slower than Congressional Budget Office expectations; a high emissions case in which more expensive clean energy technologies and rock-bottom prices for fossil fuels combined with more headwinds like interconnection queue delays and supply chain constraints battering clean energy deployment, plus economic growth consistent with the latest Congressional Budget Office projections; and a mid emissions case which splits the difference between these two extremes.
Together, these scenarios offer a range of plausible outcomes under state and federal policies on the books as of June 2024. They do not account for recently proposed or enacted tariff changes, federal policy reversals, or other headwinds that may reduce deployment in the years ahead. As such, demand projections should be viewed as a benchmark under stable policy conditions, not a forecast under current political or economic pressures, that can help clarify where manufacturing capacity may align—or diverge—from the scale of clean energy deployment needed through the mid-2030s.
This analysis includes manufacturing sector activity through March 31, 2025, before the recently announced federal tariff changes. As such, it provides a timely snapshot for gauging the health and trajectory of US clean technology manufacturing and the potential effects of shifting trade policies on this growing sector.
Solar supply chain
Solar manufacturing investment has grown substantially since the IRA became law, increasing from $0.9 billion of annual investment in 2022 to nearly $6.0 billion in 2024. The US added 35.3 gigawatts (GW) of solar capacity to the grid last year, spanning commercial and industrial installations and utility-scale projects.
As of Q1 2025, the Clean Investment Monitor tracks 110 operational solar component manufacturing projects across the US with the capacity to produce 42 gigawatts (GW) of modules, 8 GW of cells, and 26 GW of polysilicon. As those existing facilities ramp up production, an additional 19 GW module and 6 GW cell capacity will come online (Figure 3).
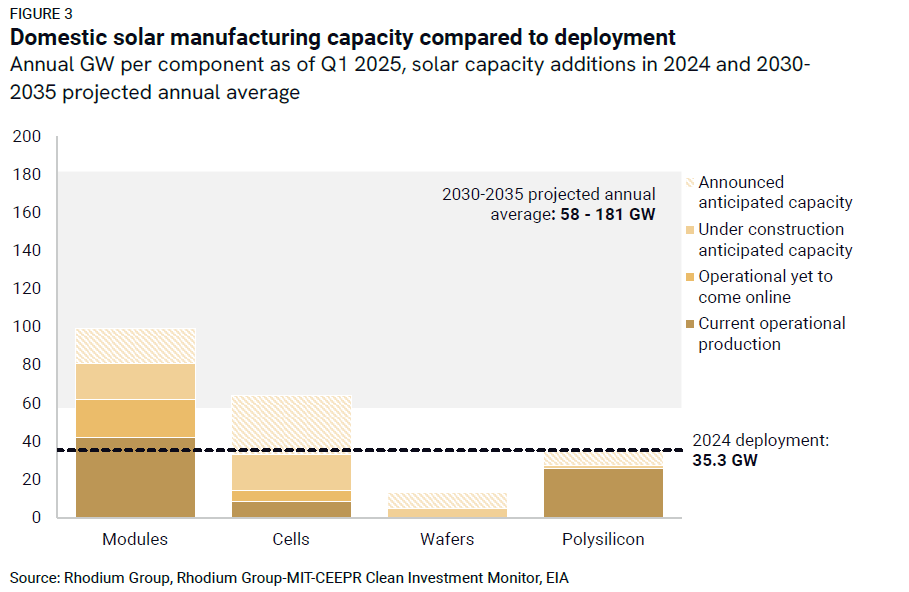
The solar PV manufacturing process begins with the production of polysilicon, where current domestic manufacturing capacity is 26% below the level consumed by 2024 solar deployment. Looking forward, we estimate that 9 GW of polysilicon production may come online by 2035. Of this outstanding capacity, 13% is currently under construction, and 87% is tied to announced facilities that have not yet broken ground, underscoring the importance of sustained policy certainty to move these projects forward.
The next stages—converting polysilicon into wafers, ingots, and ultimately PV cells—represent some of the most critical gaps in US manufacturing capacity. Current domestic cell manufacturing capacity equals only 24% of deployment levels. The pipeline includes 19 GW of solar cell production capacity currently under construction and roughly 31 GW in announced projects. In the wafer stage, the US is starting from a low base, but if all planned projects proceed, 14 GW of wafer production capacity could come online; 34% of that capacity is under construction, while 66% is tied to announced facilities that have not yet broken ground. These figures reflect a nascent but rapidly expanding upstream industry.
Module assembly, the final stage in the solar PV manufacturing supply chain, is further along. The US produces more modules than the 2024 deployment level. Another 19 GW is under construction, with 18 GW announced. These figures include traditional silicon and thin-film modules, such as those produced by First Solar. While thin-film modules follow a different production pathway than silicon-based panels, they play an essential role in expanding US module capacity and domestic content.
Stacking these manufacturing projections up against projected demand, we find that if current investment plans stay on track, significant upstream gaps remain. Assuming regulations and tax policies remain, Rhodium Group projects that the US will add 58-181 GW of solar capacity annually from 2030 through 2035. By 2035, these domestic manufacturing facilities could produce only 19-61% of the polysilicon and just 7-23% of the wafers projected to be consumed by annual solar deployment, based on Rhodium Group’s projected range of future installations. For downstream components, the picture is more mixed. In a scenario with limited clean energy deployment (i.e., Rhodium’s high emissions scenario), cell and module production would closely track or exceed annual deployment levels. However, in a rapid decarbonization case (i.e., Rhodium’s low emissions scenario), domestic cell production would equal only 35% of cell deployment levels and 55% for modules by 2035. These projections underscore the challenge of keeping pace with the scale of deployment needed to reach long-term decarbonization targets.
Wind supply chain
Unlike other clean technologies incentivized by the IRA’s advanced manufacturing tax credits, investment in wind manufacturing has been on the decline. From a peak of $157 million in Q3 2023, quarterly investment has steadily dropped, hitting a new post-IRA low of $5 million in Q1 2025.
In 2024, the US added 4.8 GW of utility-scale wind capacity. Annual domestic production capacity for towers and nacelles matches this deployment level, but the blade manufacturing capacity is 11% less than what was deployed in 2024.
As of Q1 2025, the Clean Investment Monitor tracks 30 operational wind component manufacturing projects across the US, with the annual capacity to produce 4 GW of blades, 10 GW of towers, and 17 GW of nacelles. Nacelles, a section of a wind turbine that converts the turning blades into electricity, represent the strongest link in the domestic supply chain in terms of domestic capacity. In the near term, we anticipate an additional 0.58 GW of blade, 0.15 GW of tower, and 3 GW of nacelle production capacity to come online as these facilities ramp up (Figure 4).
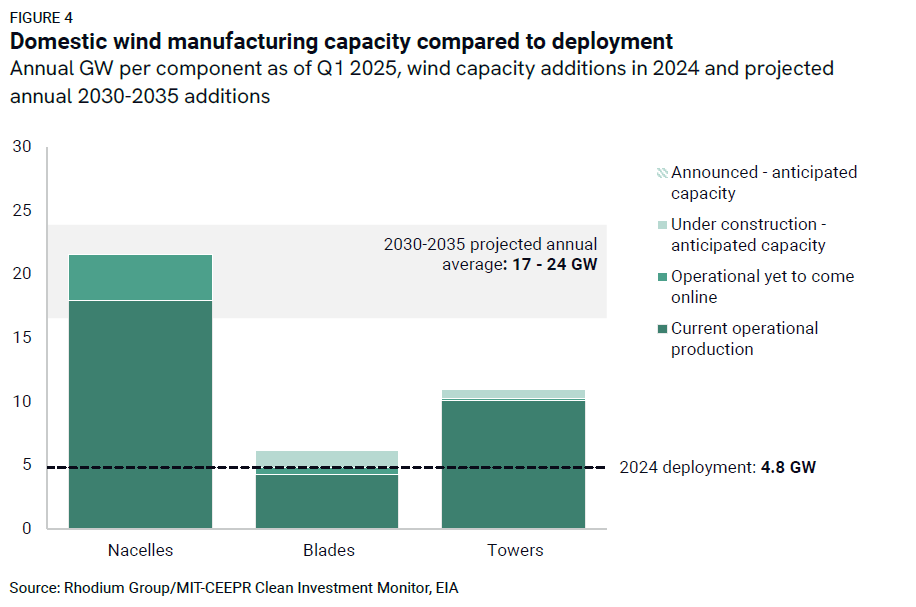
The outlook for growth in US-based wind manufacturing is limited. Only a handful of new projects are in the pipeline, all under construction. One new blade manufacturing facility will add 1 GW of annual production capacity, which would close the gap compared to 2024 levels of wind additions. Two new tower manufacturing facilities are under construction, adding 0.75 GW of annual capacity. No new nacelle manufacturing projects are underway or announced.
We find uneven alignment across components when comparing total domestic wind manufacturing capacity—including operating, under construction, and announced facilities—to projected deployment levels out to 2035. Assuming regulations and tax policies remain, Rhodium Group projects average annual wind additions of 17 GW in a high emissions scenario and 24 GW in a low emissions scenario. For nacelles, we estimate 22 GW of annual production capacity, representing 27% above projected deployment in a high emissions scenario but 10% below levels in a low emissions scenario. Blade manufacturing capacity in 2035 would amount to 26-36% of projected deployment levels, while tower manufacturing capacity tracks with 46-65%. These gaps, especially in blade manufacturing, underscore the limits of the current pipeline and the lack of long-term investment momentum.
The stagnation in wind manufacturing may reflect broader structural challenges in the industry. These include barriers to project permitting, extended project development timelines, and ongoing financial constraints across both onshore and offshore wind markets. Manufacturers may be reluctant to invest in new domestic production without further project visibility or policy certainty.
Battery supply chain
Batteries have emerged as the dominant driver of post-IRA manufacturing activity, accounting for 69% of all clean technology manufacturing investment since the law’s enactment. Battery manufacturing now stands out as the most advanced segment of the clean tech supply chain in terms of current operational capacity and forward momentum.
As of Q1 2025, the Clean Investment Monitor tracked 123 operating battery manufacturing projects in the US with the capacity to manufacture about 202 gigawatt hours (GWh) of cells and 208 GWh of modules annually. With existing plants ramping up, we expect an additional 202 GWh of cells and 114 GWh of modules to come online soon. Together, this capacity already exceeds domestic demand for EV batteries—the dominant consumer of this technology—and stationary storage, which totaled 158 GWh in 2024 (Figure 5).
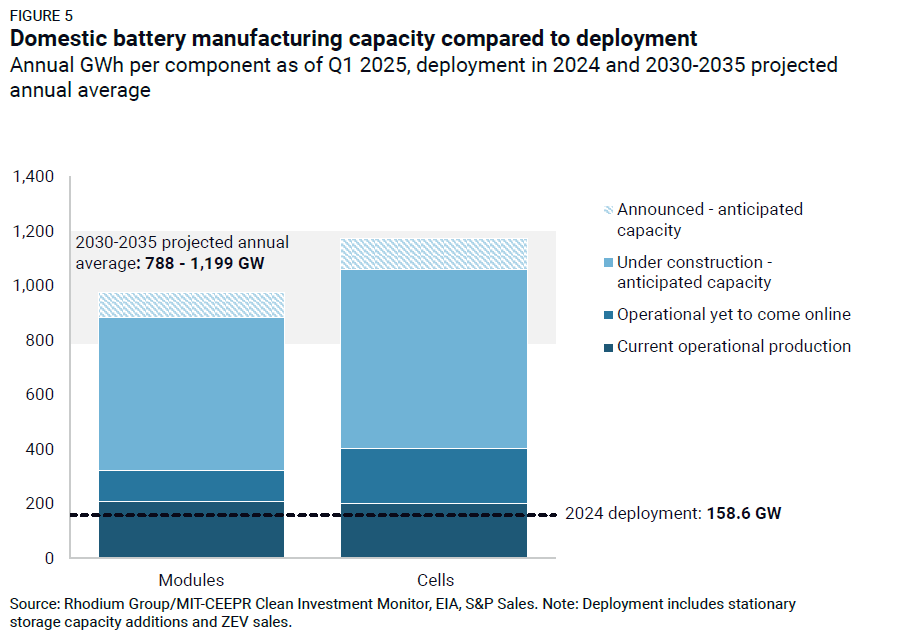
The pipeline continues to expand, with 65 facilities currently under construction, which is expected to add 656 GWh of cell and 560 GWh of module capacity by 2035. An additional 44 announced projects, not yet under construction, could bring online an additional 112 GWh of cells and 93 GWh of modules by 2035 if built as planned.
When stacking this up against long-term demand projections, battery manufacturing appears well-positioned. Assuming regulations and tax policies remain, Rhodium Group projects annual demand for batteries in 2030-2035 will range from 788 GWh in a high emissions scenario to 1,199 GWh in a low emissions scenario, with electric vehicles accounting for more than 80% of that demand. Even if only operational and under-construction facilities move forward, domestic production capacity by 2035 will align closely with the high emissions scenario, which reflects less stationary storage on the grid and fewer ZEV sales relative to the low emissions scenario. If announced projects also materialize, annual production capacity in 2035 would reach 1,172 GWh for cells and 976 GWh for modules—exceeding domestic demand in a high emissions scenario and equal to 81% of module deployment and 98% of cell deployment in a low emissions scenario.
These figures suggest that the advanced stages of the battery supply chain are far ahead of wind and solar. Upstream, the picture is less complete. The battery manufacturing pipeline also includes electrode active materials (EAM), critical upstream components of cell manufacturing, such as cathode and anode materials. While these projects are not yet a focal point of US industrial policy, they will be increasingly important for securing a domestic supply chain. As demand for battery cells grows, so will the strategic and economic importance of EAM production.
Momentum is not guaranteed. In Q1, Freyr Battery called off plans to build a $2.6 billion battery cell manufacturing plant in Georgia, while Kore Power scrapped its Arizona gigafactory. These cancellations highlight how sensitive the manufacturing pipeline is to demand forecasts and policy signals. At the same time, Tesla, LG, and Honda announced new or expanded battery manufacturing investments, signaling ongoing confidence among larger players.
EV manufacturing
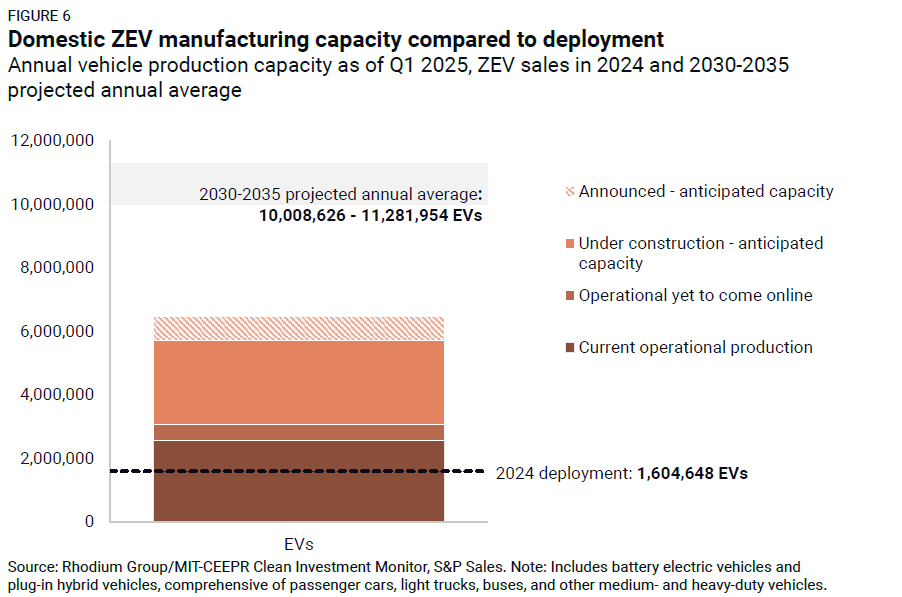
The Clean Investment Monitor tracks 79 operational EV manufacturing projects as of Q1 2025, with a combined annual production capacity of 2.58 million EVs, including battery electric vehicles (BEVs) and plug-in hybrid electric vehicles (PHEVs). That capacity exceeds 2024 sales of BEVs and PHEVs, which total around 1.6 million units across all classes, including passenger cars, light trucks, buses, and other medium- and heavy-duty vehicles. Those already operating facilities are expected to ramp up, adding capacity for another 480,000 EVs soon (Figure 6).
Notably, company-reported capacity often exceeds the amount of EVs rolling off assembly lines. Facilities frequently operate well below stated volumes due to fluctuating consumer demand, labor availability, or supply chain constraints. For instance, Hyundai recently expanded its new Georgia metaplant’s reported capacity from 300,000 to 500,000 EVs, but actual production volumes will depend on downstream market conditions.
Beyond currently operating facilities, the Clean Investment Monitor tracks 43 EV manufacturing facilities under construction or announced with specific locations and construction timelines. We expect the 27 under-construction facilities to add an annual capacity of 2.66 million EVs, while the 16 announced facilities that have not yet broken ground would add another 760,000 EVs if realized.
Stacked against current demand projections, planned manufacturing capacity shows room for this industry to grow. Assuming regulations and tax policies remain, Rhodium Group projects average annual ZEV sales of 10 million units in a high emissions scenario and 11.28 million units in a low emissions scenario between 2030 and 2035, including both BEVs and PHEVs. Total tracked domestic production capacity—including under-construction and announced facilities—reaches just 6.84 million vehicles annually. That represents 65% of demand in the high emissions scenario and 57% in the low emissions scenario, underscoring additional investment opportunities.
We will watch closely to see if plans proceed, with several fledgling EV start-ups struggling to make their concepts work. In Q1 2025, EV start-ups Nikola and Canoo cancelled facilities and filed for bankruptcy. Their collapse signals the ongoing risks in an industry still searching for stable demand and predictable policy. For facilities to come online as expected, continued government support, strong consumer incentives, and clarity on future trade policy will be essential.
Looking ahead
As of Q1 2025, the US clean technology manufacturing landscape is expanding rapidly but faces growing uncertainty. The IRA has helped catalyze unprecedented investment in domestic supply chains, particularly in batteries and solar. Yet much of the capacity needed to meet future demand is still in development, and the sector now faces a shifting policy environment that could shape what comes next. Several dynamics will be especially important to watch, including tariff policy, tax credit certainty, and EV demand.
Recent and proposed trade measures targeting clean technology imports, especially from China, could reshape the economics of domestic manufacturing. If designed effectively, these policies could encourage new US manufacturing investment. But if they are poorly targeted or paired with policy uncertainty or retaliatory actions, they risk driving up costs and slowing deployment. The future of IRA tax credits—including those most relevant to manufacturing and deployment, such as the Section 45X production credit, clean electricity tax credits, and the 30D consumer EV credit—remains uncertain. These incentives have been essential to spurring the current wave of investment. If Congress maintains them, we expect continued momentum. If they are weakened or reversed, delays or cancellations could accelerate. A key related question is how tariffs and global price pressures will impact overall US demand for EVs.
Finally, we will watch the execution risk facing announced projects that have not yet broken ground. Turning these announcements into operational facilities will require a stable investment climate and efficient permitting and interconnection processes. Manufacturers may slow construction timelines or scale back production ramp-ups if demand softens or policy signals become more ambiguous. The coming months will be critical for determining whether the US clean technology manufacturing boom picks up pace or stalls.
