Climate Convexity: The Inequality of a Warming World
If carbon emissions and associated damages are left unaddressed, the climate crisis will not only become more costly to global health and the global economy, but also will exacerbate inequality within the US and around the world.
In the past two centuries, global fossil fuel combustion has increased carbon dioxide concentration to unprecedented levels, which has increased Earth’s temperatures and the frequency of extreme climate events. If left unaddressed, the climate crisis will not only become more costly to global health and to the global economy, but also will exacerbate inequality within the U.S. and around the world. In a chapter for Securing Our Economic Future: Policies to Strengthen the Middle Class and Address Climate Change, a policy volume from the Aspen Institute’s Economic Strategy Group, Rhodium partner Trevor Houser describes recent changes in the climate and how scientists predict those changes will evolve in the years ahead. The chapter then describes recent advances in econometric research that, when paired with high-resolution climate models, help us understand the impact of those changes in the climate on society. Finally, the chapter concludes with recommendations for how U.S. policymakers can use this research to address the unequal threat of climate change, both domestically and internationally, and build a more just and sustainable future.
Recent research advances at the intersection of climate science and economics make it clear that the cost of inaction on climate change in the United States is not only greater than the cost of action, but that inaction exacerbates income inequality within the United States and around the world. From more frequent heatwaves and wildfires to more destructive hurricanes, an increasingly unstable global climate is already taking a toll on human health and prosperity, and disproportionately impacting the poor. How exposed humans are to future changes will be determined by the actions policymakers take today. Using new research and data, policymakers can counteract the inequality of a warming world.
How did we get here? For the past 12,000 years, a period referred to by geologists as the Holocene, our climate has been the most stable and suitable for human development at any point in Earth’s four billion year history. While the first Homo sapiens appeared more than 300,000 years ago in Africa, our early ancestors struggled to thrive through three glacial periods, where ice covered much of North America and Northern Europe. It wasn’t until Earth emerged from this last glacial cycle into relatively prolonged stability that humans could move from hunting and gathering to farming. In turn, agricultural production gave rise to early human civilizations in the Fertile Crescent, Ancient India, Ancient China, and Mesoamerica. Continued climate stability has enabled human civilization to undergo dramatic expansion in size, geographic breadth, technological sophistication, and cultural richness, giving us the world we know today.
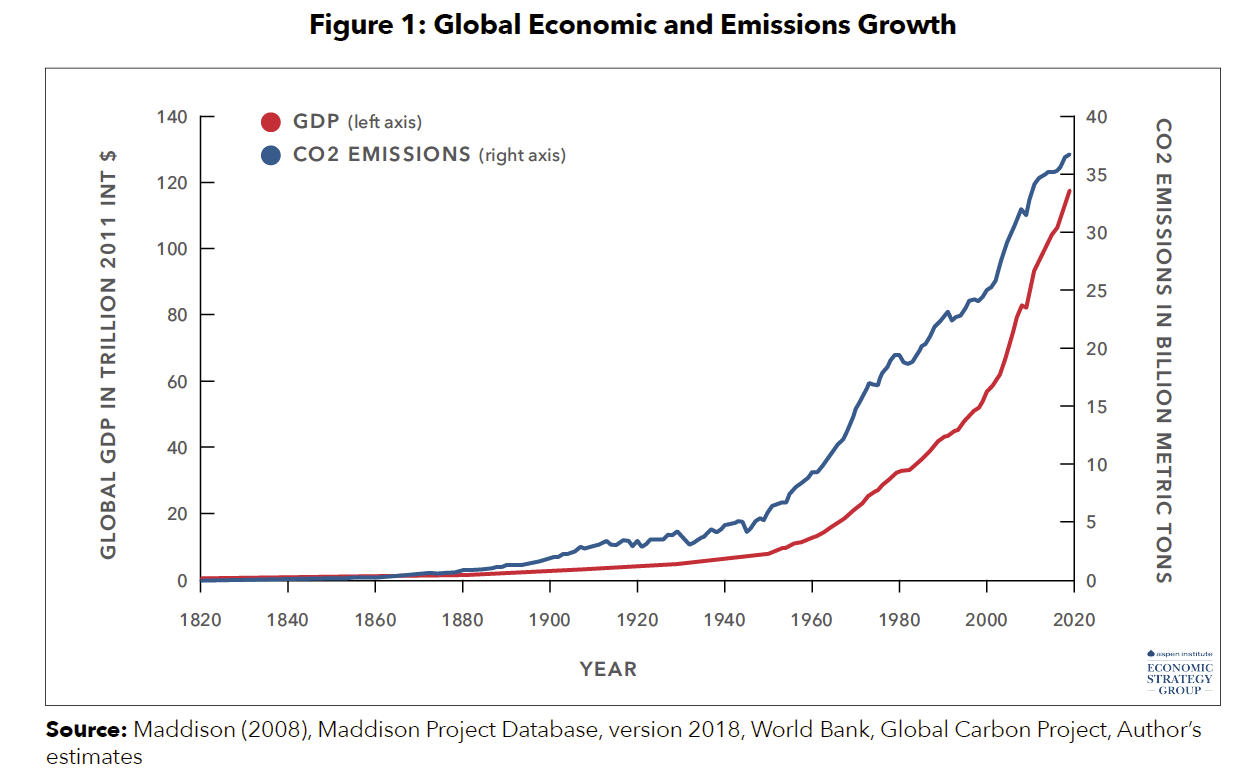
Measured in economic terms, most human development experienced over the past 12,000 years has occurred in just the last two centuries. Between 0 and 1000 AD, the global economy expanded by only 0.1 percent per decade on average, and per capita GDP declined. Between 1000 and 1820, GDP growth accelerated to 1.8 percent per decade. Over the past 200 years, however, the global economy has grown by almost 30 percent per decade on average. Fossil fuels powered that growth, from coal-fired steel mills and power plants to oil-fueled trains, planes, and automobiles. Carbon dioxide (CO2) emissions from fossil fuel combustion have grown even faster than economic output overall—39 percent per decade, on average, over the past 200 years (Figure 1). This emissions growth is now threatening the very stability in the Earth’s climate that made the past 200 years of economic development possible.

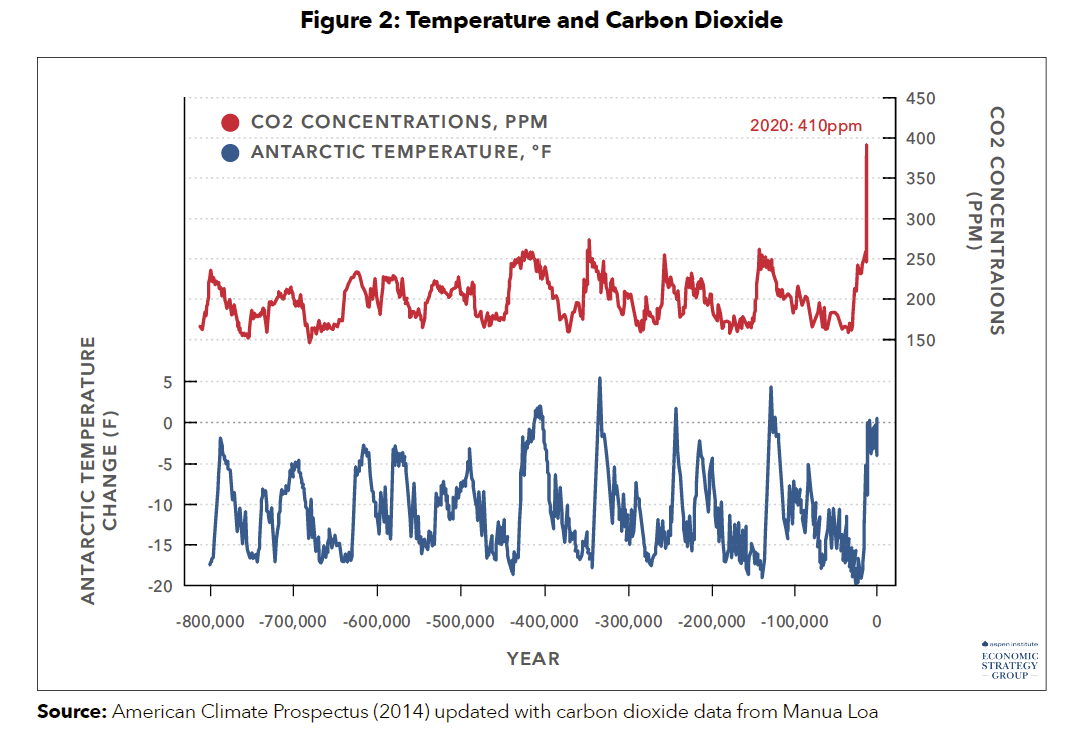
For the past million years, atmospheric concentrations of carbon dioxide have ranged from 170 to 300 parts per million (ppm), following the Earth’s orbit-forced transitions through 100,000 year glacial cycles (Figure 2). For most of the past 12,000 years, atmospheric carbon dioxide concentrations have remained in a tight, comfortable range of 260 to 285 ppm. But fossil fuel combustion over the past two centuries has pushed concentrations above 410 ppm. The last time they were at this level was likely more than three million years ago (Seki et al. 2010).
This rapid growth in carbon dioxide concentrations has already significantly impacted the Earth’s climate, both its average temperatures and the frequency and severity of extreme events. The scientific community has studied the relationship between fossil fuel combustion and global climate change for 125 years, and developed increasingly sophisticated climate models to forecast how these changes will unfold in the future under different emissions scenarios. But our understanding of the impact of these changes on society has lagged considerably. Economists only started studying climate change in earnest in the early 1990s. Until recently only a few models existed, each with little empirical basis or geographic detail. A recent explosion of econometric research, mapping climate’s relationship to society, is changing that. When paired with high-resolution climate models, this research provides, for the first time, evidence-based estimates of the impact of climate change at a hyper-local level.

While this econometric research is still in its early stages, one core insight is abundantly clear: Climate change’s impact, whether on economic output or human health, will be extremely varied from place to place. The poor, both within countries and across countries, suffer more than the rich. This insight comes as policymakers grapple with inequality in economic and health outcomes from a pandemic-driven global recession. Recent findings from climate econometrics suggest that if humanity does not address climate change in the next few decades, it will likely drive more devastation and deeper inequality than the current global crisis.
And unlike the current crisis, the inequality of climate change extends to the cause as well as the effect. The carbon dioxide emissions heating the Earth today were emitted over the past two centuries, tied to economic activity that was not evenly distributed around the world. More than half of all global economic output over the past 170 years, and two thirds of all carbon dioxide emissions, have come from countries currently in the top 20 percent of the global income distribution on a per capita GDP basis. These countries are far less vulnerable to the impacts of climate change than the other 80 percent. This is due in large part to their current climate and the convex relationship between temperature and most economic and social outcomes. The climate in rich countries is, on average, colder than in poor countries, and a growing body of climate econometric research shows that a given increase in temperature is much worse for places that are already hot. Compounding this effect is the protective nature of past income growth in richer countries to climate change, made possible by fossil fuel combustion. This inequality exists within national borders as well. Wealthier citizens emit more carbon dioxide and are more protected from the changes in the climate those emissions create, due both to geography and being affluent enough to adapt.
This chapter starts with a description of recent changes in the climate and how scientists predict those changes will evolve in the years ahead. It then describes recent advances in econometric research that, when paired with high-resolution climate models, help us understand the impact of those changes in the climate on society. The chapter concludes with recommendations for how U.S. policymakers can use this research to address the unequal threat of climate change, both domestically and internationally, and build a more just and sustainable future.
Related Work: Calculating the Climate Reciprocity Ratio for the US