Preliminary China Emissions Estimates for 2019
Based on preliminary energy and economic data for 2019, we estimate that China’s greenhouse gas emissions increased by 2.6% last year.
Based on preliminary energy and economic data for 2019, we estimate that China’s greenhouse gas (GHG) emissions increased by 2.6% last year, in line with the average annual growth of 3.0% over the past decade. This was due to increased consumption of fossil fuels across all fuel types, with oil and gas growth outpacing coal, along with growth in non-CO2 gases. Despite this increase, our preliminary data suggests China is within striking distance of meeting its Copenhagen Accord pledge in 2020 for carbon-intensity and non-fossil energy, though the net impact of economic changes driven by the COVID-19 pandemic remains unclear.
China’s GHG emissions grew 2.6% in 2019
Although China long ago eclipsed the US as the world’s largest GHG emitter, there is relatively little recent information on China’s annual emissions for all sources, sectors, and gases. The last year for which the Chinese government has published estimates across sectors and gases is 2014. To fill this information gap, Rhodium Group has developed a more up-to-date dataset of historical emissions in China, covering all sources, sectors, and gases, including new preliminary estimates for 2019 by gas. As part of our Climate Service, we also provide a similar comprehensive dataset of historical annual emissions for all 193 UN member states for the period 1990-2017.
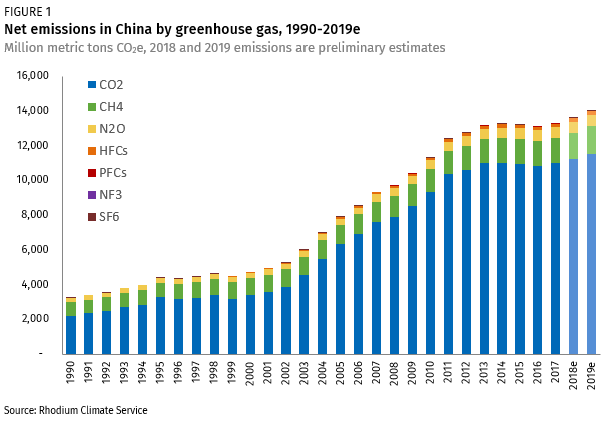
Based on preliminary economic and energy data, we estimate that total GHG emissions in China reached 13,920 million metric tons (MMt) of CO2e in 2019 (Figure 1). That’s a 2.6% increase from 2018, slightly lower than the 2010-2019 average of 3.0% annual emissions growth, but a dramatic difference from the 9.2% year-on-year average observed for 2000-2009.
Moderate increase in coal use as its share of total demand decreases
During the 2000s, China’s rapid economic expansion was fueled primarily with coal, with demand growing 10% per year on average. Over the past decade, coal demand growth has cooled dramatically, not exceeding 2% in any individual year since 2012. From 2014 to 2016, coal demand declined in absolute terms. Since then, growth has resumed but at a relatively sluggish rate of 1% per year, including in 2019.[1]
For the power sector in particular, growth in coal use slowed significantly over the past decade due to a shift toward non-fossil sources.[2] Between 2010 and 2019, wind, solar, and nuclear each experienced average year-on-year growth of over 15%, bumping up the total non-fossil share of generation from 20% in 2010 to 28% by 2019. Coal shares have declined since its peak in 2007 from 81% to 69% a decade later.
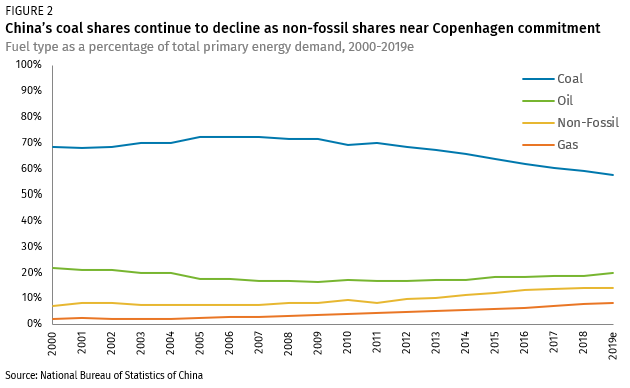
Economy-wide, from 2010 to 2019, coal’s growth was outpaced by oil, gas, and non-fossil sources. As a result, its share of total primary energy demand declined from 70% in 2010 to 58% in 2019 (Figure 2). Over that same period, based on preliminary data, we estimate that non-fossil energy sources increased from around 9% to 14.9%, approaching China’s pledged goal of 15% by 2020. The rest of the decline in coal’s market share was mostly filled with natural gas, which rose from 4% of total primary energy demand in 2010 to just over 8% in 2019.
Oil and gas account for majority of increase in energy emissions
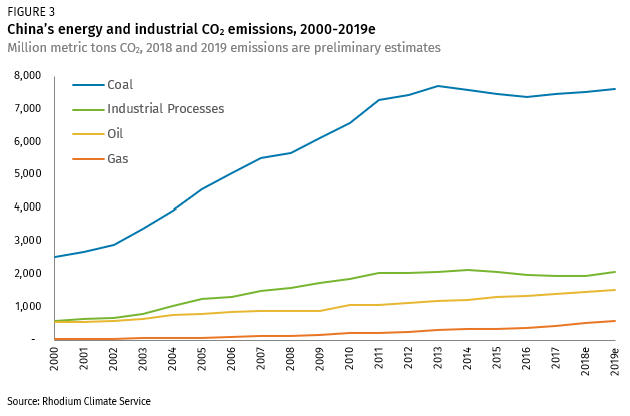
Based on preliminary data, we see a significant increase in oil and gas consumption, accounting for about 60% of the increase in energy CO2 emissions observed over 2019. Overall, energy demand increased 3.3% from 2018 levels, on par with the year-on-year average of 3.6% over the past decade. Natural gas led with 8.4% year-on-year demand growth, slightly below the 2010-2019 average of 13%. Oil demand rose by 4.9% year-on-year, again falling slightly below average rates over the past decade (5.8%).[3] This brings China’s oil and gas emissions to over 2 gigatons (2,000 MMt CO2), or the equivalent of total GHG emissions from Japan and Germany combined. Growth in oil and gas demand also drove up oil and gas production, resulting in a 1.9% increase in fugitive methane emissions.[4]
Steel and cement production drive up process CO2 emissions
In 2019, industrial and construction sector output (measured on a value-added basis) grew by about 5.7%. Within industry, output of non-metallic mineral product manufacturing (mostly cement) grew by 8.9%, while iron and steel output grew by 9.9%.[5] By mass, cement production increased by 6.8% year-on-year, returning to 2017 levels after an 8.4% drop in 2018. Similarly, steel production increased 7.3% year-on-year. As a result of this increased industrial activity, non-combustion process-related CO2 emissions increased by 5.6%.[6] Overall, while energy CO2 emissions increased 2.1% in 2019, total CO2 emissions (energy and process) increased 2.7%.
Looking ahead to 2020
Tracking China’s GHG emissions and fuel shares becomes more important this year as 2020 is the first year that China will need to demonstrate fulfillment of its first-ever international climate commitment. In 2009, China pledged under the Copenhagen Accord to achieve 15% of all primary energy demand from non-fossil sources and to reduce the carbon intensity of its economy 40-45% below 2005 levels by 2020. In 2019, our preliminary estimates indicate that China achieved a 45.1% drop in carbon intensity from 2005 levels and reached non-fossil shares of 14.9%. But is China on track to deliver on its pledges this year? And how might the outbreak of the COVID-19 virus and the resulting economic interruption impact China’s ability to deliver?
Since the outbreak was first reported in December 2019, Chinese economic activity decreased significantly, impacting global supply chains and major stock markets. In China, there has been a major contraction in demand for steel and commodities as well as a systemic shutdown of factories and transportation networks. Coal consumption by the six largest power plants in China has fallen over 40% since the last quarter of 2019. According to a recent estimate in CarbonBrief, in the four weeks following Chinese New Year, the economic slowdown likely cut China’s CO2 emissions by a quarter.[7] As we note in Gigatons at Stake, overall macroeconomic conditions are the single most important factor in shaping both past and future Chinese GHG emissions.
China’s Copenhagen pledge, however, is not measured in absolute terms, but on the carbon intensity of its economy and the non-fossil share of its energy mix. If economic output falls faster than emissions in 2020, carbon intensity will grow. Based on very early data, it looks like the most emission-intensive parts of the economy are the hardest hit so far. If this trend holds, the carbon intensity of the economy will continue falling in 2020. If, however, Beijing responds with a large property and construction-heavy stimulus package, the resulting increase in cement and steel production could increase carbon intensity. How the carbon-light service sector fares will also be an important factor. The impact on non-fossil energy will also depend on the shape and contours of any potential stimulus package. If it is focused on property and construction activity and the industrial production that feeds it, coal’s market share could temporarily increase. If stimulus resources are directed towards non-fossil sources of energy production, the opposite could occur. What does this all mean? Essentially, it’s just too soon to tell.
—
[1] Our preliminary estimates for coal emissions are calculated using coal consumption data from the National Bureau of Statistics (NBS). According to NBS data, in 2019, the thermal content of coal (kJ/kg) decreased 4.2%. This reported reduction in the energy density of Chinese coal consumption has a significant impact on our estimate of coal-related emissions. If Chinese coal thermal content had remained constant from 2018, coal emissions would have increased by an additional 330 million metric tons CO2 in 2019. We plan to explore the robustness of NBS coal consumption data in a future note.
[2] Fuel sources considered “non-fossil” for China include renewables (solar, wind, hydro, geothermal) and nuclear energy.
[3] To estimate oil-related emissions growth in China, we use IEA Monthly Oil Market Report (January 2020). To estimate natural gas emissions growth, we use monthly natural gas consumption data from the National Bureau of Statistics of China.
[4] To estimate fugitive emissions, we increase historical fugitive emissions by the rate of change in fossil fuel production.
[5] Statistical Communiqué of the People’s Republic of China on the 2019 National Economic and Social Development. National Bureau of Statistics of China. February 28, 2020.
[6] Process CO2 is released not from fossil fuel combustion but other industrial processes. For instance, the chemical process to make cement produces CO2 when limestone is heated in a kiln to produce lime – an ingredient used in most cement types. This is separate from the CO2 produced from fossil fuel combustion where energy is required to heat the kiln. Steel production also emits process CO2, at an intensity of about 1.1 tons CO2 per ton of steel.
[7] A quarter of China’s CO2 emissions is around 200 MMt CO2, the equivalent of total annual GHG emissions from Bangladesh.