Taking Stock 2014: Is the US on Track? EPA’s Clean Power Plan and the US 2020 Climate Goal
This report assesses the impact of the Clean Power Plan on US greenhouse gas emissions and whether, when combined with other enacted or planned emission reduction actions, the US is on track to meet its Copenhagen pledge.
At the 2009 UN Climate Change Conference in Copenhagen, the United States committed to reduce its greenhouse gas (GHG) emissions in the range of 17% below 2005 levels by 2020. Halfway to that 2020 deadline, the Obama Administration has adopted or announced a number of policies aimed at reducing US emissions, the most significant of which was the EPA’s Clean Power Plan (CPP) proposed this June. This report assesses the impact of the CPP on US GHG emissions and whether, when combined with other enacted or planned emission reduction actions, the US is on track to meet its Copenhagen pledge. We find that:
The Clean Power Plan (CPP) can achieve substantial reductions in emissions: The CPP as proposed has the potential to put the largest emitting sector in the US on a lower emissions pathway. A lot could change between the proposal and the final rule next summer, but our current assessment is that the CPP could achieve as much as 463 million metric tons of CO2 abatement from across the economy in 2020. This level of abatement is not guaranteed. Depending on implementation choices made by states, the CPP may reduce economy-wide emissions by just 310 million metric tons.
The CPP is the most important policy for meeting the 2020 target: We estimate that the CPP alone, as currently proposed, closes nearly 60% of the economy-wide gap between the US target and a scenario without policy action. Without the CPP, the US has almost no chance of meeting its 2020 goal. The ultimate impact of the CPP will be determined by the content of the final EPA guidelines, as well as how they are implemented by states.
While ambitious design and robust implementation of the CPP is necessary, it’s not sufficient: The current gap between the target and a scenario without additional policy action is too wide to be closed by the CPP alone. Additional steps to reduce emissions from energy use, methane, and HFCs will be required. Progress to date in these other areas is slow and the clock is ticking. A final wildcard is whether US forests and other lands maintain their ability to sequester carbon at historic rates, something that is largely out of federal policymakers’ hands.
BACKGROUND
In 2009 at the UN Climate Conference in Copenhagen, President Obama announced a commitment to reduce US GHG emissions in the range of 17% below 2005 levels by 2020, in the context of a global deal where all major economies made similar pledges. At the time the American target was contingent on “anticipated energy and climate legislation,” which died soon after in the Senate. The President has since reaffirmed the 2020 goal, most notably in the June 2013 announcement of his Climate Action Plan, the United States’ first comprehensive national strategy to address GHG emissions. The Plan made clear the administration’s intention of meeting the 2020 emission reduction target through executive authority alone, rather than relying on congressional action.
In late 2013, the Obama Administration released the first official assessment of current and potential progress towards achieving the US 2020 goal. In its Biennial Report to the UN, the administration stipulated that with full implementation of the President’s Plan the US would come within the range of 17% by 2020. The report, released only two months after the Plan, did not attempt to model emission reductions from specific policy proposals, but instead reductions “that could be achievable through a range of additional actions, consistent with implementation of the Climate Action Plan.” Now, nearly a year later, we are able to conduct a more direct assessment of potential emission reductions associated with the President’s Plan, combining updated GHG emissions data with several new regulatory proposals.
A key component of the Plan is the President’s directive to EPA to use the Clean Air Act (CAA) to regulate CO2 emissions from existing power plants. In meeting that directive EPA proposed its draft Clean Power Plan (CPP) on June 2, 2014 and is currently taking public comment on the proposal. The CPP proposal contains binding performance goals that require states to reduce the emissions intensity of their existing fossil fuel-fired power plant fleets. States must have EPA-approved, enforceable standards in place to meet the performance goals beginning in 2020 and for each year thereafter. EPA is providing states with considerable flexibility in the form these standards could take, so long as states can clearly demonstrate that the emissions performance goals will be met.
The CPP will play a central role in determining whether the US meets its 2020 target. The electric power sector is the largest single contributor to US GHG emissions, representing 32% in 2012. Once final, the CPP will place the first mandatory limits on greenhouse gases from existing power plants. While the sector has experienced a notable decline in emissions since 2005, further decline is not expected without additional policy action. Indeed, analyses by Resources for the Future, the World Resources Institute, and others have previously concluded that without robust regulation of existing power plants, the US 2020 target is unattainable.
The CPP will also shape post-2020 US climate commitments, currently being considered by the administration ahead of the 2015 UN climate change conference in Paris. Emission goals under the CPP start in 2020 and extend through 2030 and beyond. Given the years of regulatory procedures and state implementation required to get it up and running, it is unlikely to be revised before the mid-2020s. Absent action by Congress, the current CPP rulemaking represents the only opportunity for federal regulatory action on GHG emissions from power generation in the short and medium-term.
In this report we examine the current US emissions path under current policies. Next, we compare estimated abatement from recently announced policies with the range of potential abatement included in the 2013 Biennial Report and consider abatement from additional actions the US could potentially pursue. We then combine our results to get a comprehensive assessment of the role of the CPP and other major policies in achieving the 2020 target. Finally, we present our conclusions.
CURRENT POLICY ONLY GETS US SO FAR TOWARD THE 2020 TARGET
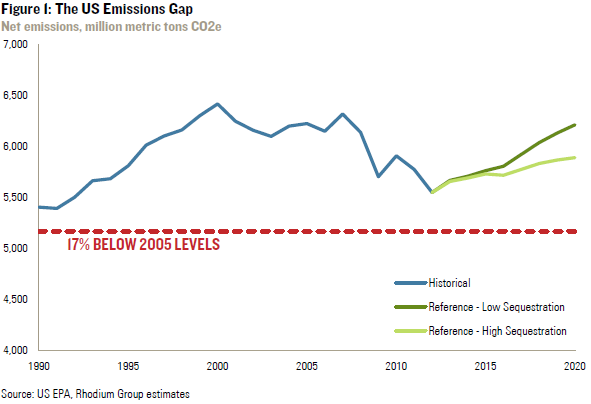
New emissions and projections data published after the release of the US Biennial Report allow us to put together a more up-to-date reference case forecast of GHG emissions out to 2020. This reference case includes all current policies, but excludes any preliminary, proposed, or potential additional policy actions after September 30, 2013, including the CPP.¹ Using this updated forecast we estimate that under current policy, total net US GHG emissions are projected to be between 5,888 and 6,210 million tons in 2020, with the difference representing forest sequestration uncertainty (see more on this below). Even in the low end of the reference case range, US emissions are projected to rise from current levels out to 2020. In order to reach the 2020 target, emission reductions will need to be in the range of 723 to 1,045 million metric tons of CO2 equivalent (CO2e) from projected levels in 2020 (see Figure 1).
Forests and Land Use
A major wild card in assessing the potential for the US to meet its 2020 target is whether American forests are able to maintain their historically high rate of carbon sequestration. In 2012, over 15% of total US GHG emissions were offset as forests and other lands absorbed carbon from the atmosphere. Recent studies, including some by the US Forest Service, suggest that as a result of changing land use patterns and the damaging effects of climate change itself, over the long-term US forests will absorb carbon at a slower rate. There is significant uncertainty, however, about whether and when such slowing may occur.
The President’s Plan encourages conservation and sustainable management of US forests and lands, but does not call for specific policies or actions to shore up the sector’s ability to offset carbon emissions by 2020. In its Biennial Report, the administration presented a high sequestration scenario (extrapolating past trends) and a low sequestration scenario (reflecting a gradual decline in absorption rate), neither of which reflects attempts to quantify impacts of policy. Based on the administration’s own bounding of the likely forest and land use outcomes for 2020, the low sequestration scenario delivers as much as 323 million metric tons less abatement than would be achieved if past trends continue through the end of this decade.
ASSESSING THE POTENTIAL OF THE CPP
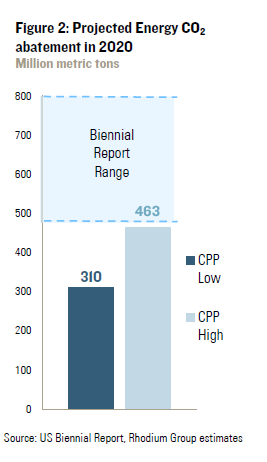
In its Biennial Report the administration projected a “range of potential reductions that can be achieved” in the energy CO2 sector, estimating 485-800 million tons of abatement in 2020. While the Biennial Report range does not explicitly include the CPP, it does include the impact of “increasing levels of clean generation” as well as new policies in end-use sectors such as transportation and residential, commercial, and industrial energy use. We assess the contribution of the CPP using the methods from our forthcoming
Remaking American Power analysis, set for release in November 2014 in partnership with the Center for Strategic and International Studies. Preliminary findings from that analysis can be found here.
In our “low abatement CPP” scenario, all states work together to implement a single national standard on existing power plants and credit the full amount of energy efficiency (EE) contemplated by EPA in its proposal. We also assume all EE from new federal policies gets credit under the CPP. In our “high abatement CPP” scenario, we assume the same nationwide cooperative implementation, but only allow generation options to contribute to compliance. All EE from federal policies are complementary to the CPP (they do not get credit) and in turn yield additional reductions. Based on our high and low scenarios, we estimate that EPA’s current proposal could achieve 310-463 million tons of emission reductions in 2020. This range includes not just emission reductions from power plants, but all emission reductions that could occur across the economy from the CPP, including the net impact of changes in upstream methane and CO2 emissions from higher natural gas demand and lower coal demand.
It is important to note that ultimate GHG abatement achieved by the CPP will depend on how states design and implement their performance standards in line with EPA’s guidelines. Decisions around multi-state cooperation, whether and to what degree existing EE and renewable energy programs are included, whether emission rate or mass based standards are employed, and the timing of emission reductions will impact the actual abatement level in 2020 and subsequent years.
This last point on timing of reductions under the CPP is particularly important in the context of the 2020 target. The CPP requires states to meet or exceed interim emission rate goals on average between 2020 and 2029. In their implementation plans, states could opt to set fairly modest targets for 2020 and then ramp down those targets through 2029. They could also do the opposite, or simply set the target at the interim goal for the entire decade. The sum of each state’s implementation decisions will directly impact total emission reductions from the CPP in 2020. For both CPP scenarios we assume that state implementation results in targets that generally follow the annual targets calculated by EPA that make up the average interim goals. This means that the 2020 targets are slightly higher than the interim goal and the 2029 target is slightly lower. Without speculating as to what course each state may take, we believe this is a reasonable characterization of what could happen under the CPP.
When we compare our abatement estimates for EPA’s current CPP proposal against the administration’s 2013 forecast of potential energy CO2 abatement from the President’s Climate Action Plan, the CPP gets close to the low end of the Biennial Report range (see Figure 2).
There are a range of emission reductions achievable through other policies in the energy sector that have not yet been proposed by the administration, but which could be feasibly implemented before 2020. All potential actions could be pursued under current and additional use of existing executive authorities targeting existing and new sources of emissions such as building weatherization and retrofit programs, increased performance and deployment of renewable energy technologies, increased participation in telecommuting, carpooling and transit use as well as appliance standards, building codes, and heavy duty vehicle efficiency regulations. We estimate that these additional actions could achieve as much as 105 million metric tons of abatement in 2020.
When we combine the projected reductions from the CPP and other policy actions in the energy sector, potential abatement from energy CO2 in 2020 ranges from 310-568 million tons. We rely on this range when assessing the total economy-wide emission reductions that could be achieved to meet the 2020 target.
NON-CO2 ABATEMENT POTENTIAL AND PROGRESS
While the CPP is the centerpiece of the administration’s efforts to meet its 2020 target, getting within the range of 17% will depend on a host of other factors. We explore one of most significant determinants below: the timing and effectiveness of proposed administrative action on other sectors and gases.
The President’s Plan calls for emissions reductions from a wide swath of economic sectors and gases, setting the stage for regulation of some of the most potent GHGs: methane (primarily from natural gas systems, livestock, and landfills) and hydrofluorocarbons or HFCs (used in air conditioning and refrigeration). Although together they contributed only 11% of total US GHG emissions in 2012, they are expected to increase significantly by 2020 absent action to curb their growth. The administration estimates that more than 20% of expected abatement in 2020 will come from these non-carbon sources.² Below, we assess progress since the June 2013 announcement, reflected by recent emissions trends and developments in implementation of the administration’s proposals.
Methane
After CO2, methane (CH4) is the second largest contributor to US emissions, at around nine percent of total GHGs in 2012. Resulting primarily from leaks in natural gas systems, livestock production, and decomposition of wastes in landfills, methane is an extremely potent GHG, roughly 25 times as climate-forcing as CO2. Though methane emissions have decreased by about one percent since 2005, primarily as a result of decreased emissions from field production of natural gas, projections show that absent further efforts methane emissions will grow an additional five percent by 2020.
To manage this expected growth in emissions, the Plan tasks US agencies with development of a comprehensive methane strategy to assess emissions data, address data gaps, identify technologies and best practices for reducing emissions, and identify existing authorities and incentive-based opportunities to reduce emissions. The methane strategy, released in March 2014, targets a number of key sources – landfills, coal mines, agriculture, and oil and gas – and lays out a variety of possible tools, ranging from enhanced voluntary efforts to regulation.
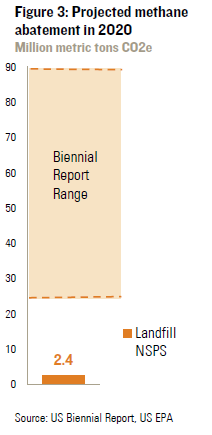
In its 2013 Biennial Report, released before completion of the methane strategy, the administration estimated that methane abatement could contribute 25-90 million tons of CO2e in 2020 (see Figure 3). At this point it is difficult to assess whether the strategy can deliver those tons in time. There are several sources of uncertainty. The first is whether the administration decides to pursue regulatory action or instead rely on voluntary programs. This will matter most in the case of methane emissions from the oil and gas sector. By the fall of 2014, EPA must determine whether to pursue further regulation of methane from this sector, with finalization of any regulations by the end of 2016.
The second uncertainty is the timing. Given the extended time frames of the administration’s regulatory process, in order to deliver the necessary tons by 2020 (less than six years from now), new or updated regulations will need to be finalized in the next year or two. Of the five possible new regulations proposed in the strategy, only one (updated new source performance standards for landfills) has been officially proposed. The other potential methane regulations (i.e., for coal mines on public lands, oil and gas, and venting and flaring from oil and gas production on public lands) are still in the input-gathering phase as of September 2014.
Finally, determining the potential for methane abatement in 2020 under the administration’s strategy is complicated further by the inherent difficulty in assessing the effectiveness of expanding ongoing voluntary efforts – including public-private partnerships with the dairy industry, coal producers, landfill operators, and EPA’s Natural Gas STAR program. The administration has not tried to quantify the potential reductions from these programs.
HFCs
Another key aim of the President’s Climate Action Plan is cutting emissions of one of the most potent greenhouse gases: hydrofluorocarbons (HFCs). Phased in over the past decade as a substitute for ozone-depleting substances used in air conditioning and refrigeration, US emissions of HFCs have grown substantially. Emissions are expected to increase more than 30% from today’s levels by 2020 and 50% by 2030, absent abatement efforts.
To stem the growth of HFCs, the administration plans to use its existing authority to limit the use of the most harmful HFCs in certain applications and expand the list of available alternatives through EPA’s Significant New Alternatives Policy Program (SNAP). To expand the list of available alternatives and bring down costs of compliance for industry, the administration is also focused on encouraging private sector investment in alternative technologies, including through government procurement of low-GHG alternatives. By far the most effective approach for expanding alternative technologies and driving down costs would be for a global phasedown of HFC production and consumption, as the US has proposed under the Montreal Protocol.
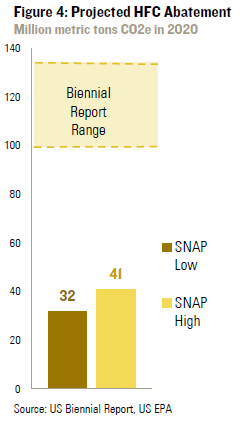
In its Biennial Report the administration estimated that a combination of domestic and international progress on HFC abatement could deliver 100-135 million tons of CO2e in 2020 (see Figure 4). The high end of that range was based on analysis conducted by EPA of a 2012 US proposal for a global phasedown commitment under the Montreal Protocol. After failure of the international community to agree in 2013, the US submitted a revised 2014 proposal, setting back the phasedown timeline several years and reducing the required abatement from the US in the 2020 time frame to around 90 million tons of CO2e.³ Despite its more lenient requirements, significant opposition remains among a handful of countries, most notably India, making the prospects for adoption of an amendment this year slim.
Without the additional authority an international treaty would provide, EPA may still use its existing authority under SNAP to reduce HFCs, though reductions will likely be more modest. In July 2014 EPA released a notice of proposed rulemaking that would restrict the use of certain HFCs in various end-uses in the aerosols, refrigeration, air conditioning, and foam blowing sectors where lower-GHG substitutes are available. EPA estimates that, as proposed, the rule could reduce HFC emissions by 32-41 million tons of CO2e in 2020. On September 16, 2014 the administration joined with 22 industry groups and companies to announce a set of private sector commitments to reduce the production and use of HFCs, and accelerate the development of alternatives. The administration also announced that it was directing federal agencies to purchase alternatives to HFCs whenever possible for use in federal facilities, to work with industry to improve practices that reduce HFC emissions, and to fund Energy Department research into HFC alternative technologies. The administration estimates that these new commitments would reduce cumulative global consumption of these greenhouse gases by the equivalent of 700 MT of CO2e through 2025. The total abatement potential in the US in 2020 are difficult to assess, however.
PUTTING IT ALL TOGETHER
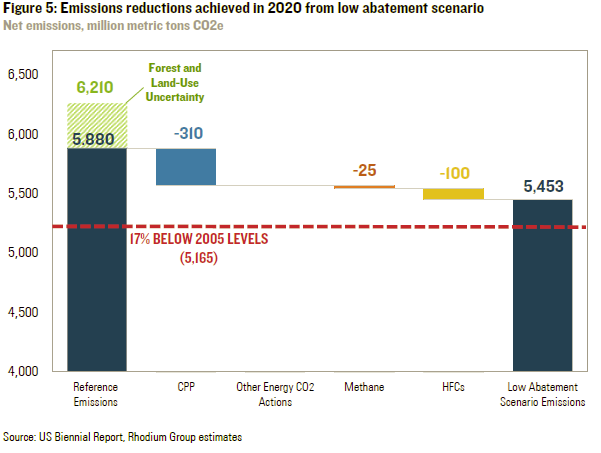
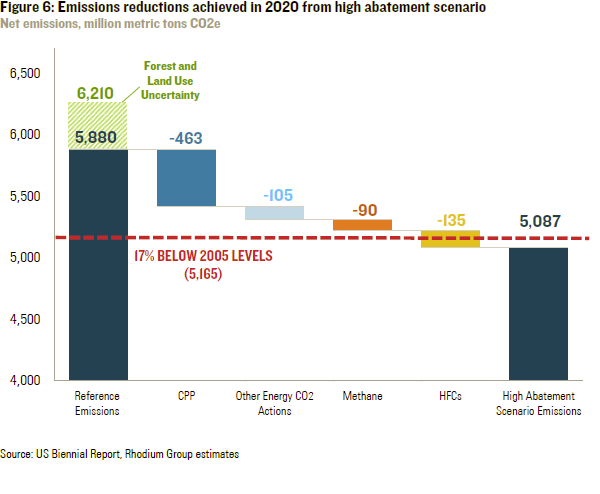
In assessing the economy-wide impacts, there could be an infinite combination of high and low abatement outcomes from each of the gases and sectors discussed above. Here we consider two economy-wide abatement scenarios that bound the range of potential outcomes. The “low abatement scenario” combines our low-end assessment of abatement achievable from the CPP and the low-end of the administration’s projections for methane, and HFCs. In the “high abatement scenario,” we combine high CPP and energy sector CO2 abatement with the high-end of the administration’s projections for methane and HFCs. For both high and low scenarios, we assume the administration’s high sequestration scenario for forests and land. Taken together, the low abatement scenario delivers abatement of 435 million tons of CO2e in 2020, or 12.4% below 2005 levels (Figure 5). The high abatement scenario delivers 793 million tons of CO2e, or about 18.1% below 2005 levels (Figure 6).
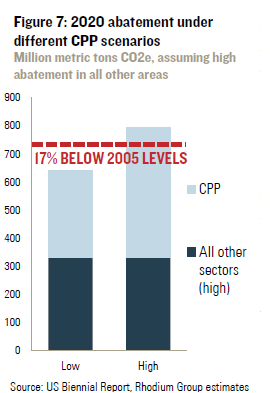
How much of a difference does the design and implementation of the CPP make in terms of reaching the US target in 2020? Even if the administration meets its most ambitious projections for abatement from methane and HFCs, and with optimistic land use and forest outcomes in 2020, achievement of the low-end of projected CPP abatement – whether due to its original design or ultimate implementation – means the US will not meet its target (see Figure 7). Based on our analysis, without ambitious implementation of the CPP, the US will fall just over 80 MMTCO2e short of the 2020 target. Given that we assume high abatement action in all other areas, it’s hard to envision a pathway to make up this shortfall through even greater action outside the power sector.
⋅
CONCLUSIONS
One year after the President’s announcement of the Climate Action Plan, and with six years to go until the final reckoning in 2020, we have sufficient information to make a reasonable assessment of prospects for meeting the US 2020 goal. Despite uncertainty surrounding the timing and nature of implementation of the proposed standards and policies announced to date, those policies make up a significant portion of the Plan’s proposed abatement activities. We expect more announcements from the administration in the coming months and years, but seeing meaningful abatement in the 2020 time frame will require decisions in the next year or two.
The 2020 target is unreachable without CPP. Emission reductions from the CPP represent nearly 60% of the total emission reductions in both our low and high reduction estimates. There is no conceivable combination of currently proposed or planned policy actions that meets the target and does not include significant reductions from the CPP in 2020.
CPP design and implementation decisions matter. If for any reason expected emission reductions from the CPP decline, even if by a little, it will be difficult to see a pathway toward meeting the US 2020 goal. Implementation decisions by states will also play a major role. Whether states decide to credit EE savings that come from federal actions (such as appliance standards) in their state plan, as well as other EE related decisions will matter. The timing of implementation and the initial targets states set in their plans will also influence the amount of emissions reductions that may be achieved in 2020 under the CPP.
CO2 reductions are only two-thirds of the story. While not as significant on a policy-by-policy basis as the CPP, full implementation of the package of regulatory and voluntary actions included in the President’s Plan to control methane and HFCs will be critical to achieving the 2020 target. Announcements by the administration in the coming months will provide more insight on whether the proposed steps will be sufficient to achieve the projected abatement. Little time remains, however, for additional regulatory action to deliver any results in the 2020 time frame.
Sequestration from forests and land use is the wild card. Unlike other sectors of the economy that contribute to US GHG emission totals, the scope and diversity of drivers affecting forests and land use make it considerably more difficult to predict and control outcomes in this sector through federal policy. If 2020 turns out to be a bad year for US forests – whether due to wildfires, conversion to agriculture or urban landscapes – it could potentially negate reductions achieved from implementation of the CPP and other major administration policies. We may not know either way until the EPA inventory of 2020 emissions is complete.
⋅
Notes
¹ The reference case combines an energy CO2 emissions forecast using the RHG-NEMS model, keyed to the Energy Information Administration (EIA)’s Annual Energy Outlook (AEO) 2014, adjusted to match EPA’s inventory accounting and an updated version of the US Biennial Report forecast for all other GHG emissions, reflecting changes in historical trends from the 2014 EPA inventory.
² To compare CO2 and non-CO2 gases in its GHG Inventory, EPA uses Global Warming Potential (GWP) values from the IPCC 2nd Assessment Report (SAR). Starting in 2015, EPA will use GWP values from the 4th Assessment (AR4) in both in the GHG Inventory and in accounting for progress toward the 2020 target.
³ This HFC emissions value is approximated by the authors from the 2014 US Montreal Protocol Amendment proposal, which would require the US to reduce annual production and consumption of HFCs by 10% from 2008-2010 average levels, starting in 2018.