What will EPA’s Carbon Proposal Cost?
Now that the Clean Power Plan proposal is out, what do we know about its potential economic costs?
Well before the EPA’s released its proposed Clean Power Plan (CPP), environmental groups and industry associations began haggling over what it would mean for electricity consumers and US economic growth. Now that the proposal is out, what do we know about its potential economic costs? The EPA has laid out its view in the Regulatory Impact Assessment (RIA) released alongside the proposal. In this note we look at how the EPA estimates stack up against those from industry and environmental groups and compare the CPP to the last major policy push to reduce GHG emission from the electric power sector – the Waxman-Markey cap-and-trade legislation that died in the US Senate in 2010.
Apples and Oranges assessments of 111(d)
Every major environmental legislative or regulatory proposal in the US prompts a robust debate on potential economic costs and benefits, and EPA’s draft guidelines for state regulation of GHG emissions from existing power plants under Section 111(d) of the Clean Air Act (CAA) released on June 2 are certainly no different. Having seen this movie before, industry and environmental groups published studies ahead of the release EPA’s proposal in the hopes of shaping the debate, analyzing the economic impact of hypothetical 111(d) regulations. In March, the Natural Resources Defense Council (NRDC) released a study that put the cost of regulating GHG emissions from existing power plants at $8.5 billion in 2020, and the benefits of such a regulation at $37 to $62 billion. Late last month the US Chamber of Commerce countered with a study which put the costs at $28.1 billion a year, on average between 2014 and 2030, and without an estimate of the resulting benefits.
EPA released an RIA on June 2 that contains the first estimate of the costs and benefits of the actual proposal. How does it stack up against the NRDC and Chamber analyses?
Table 1 compares projected compliance costs and climate and environmental benefits from the EPA RIA with the NRDC and Chamber reports, as well as a February assessment from the Clean Air Task Force (CATF). EPA’s cost estimates for 2020, at $7.6 billion, are roughly in line with the NRDC and CATF estimates, though for considerably less emissions abatement than in the NRDC analysis (27% below 2005 levels as opposed to the NRDC estimate of 41%). Compared to the Chamber’s estimates, EPA’s projected costs through 2030 are considerably lower. As with the NDRC analysis, however, the Chamber modeled abatement levels very different than the actual EPA proposal. EPA estimates the draft guidelines will result in a 29% reduction in power plant emissions by 2025 and 30% by 2030. The Chamber, on the other hand, models a policy package that delivers a 38% reduction by 2025 and 41% reduction by 2030. The CATF study is closest to the EPA’s proposed level of abatement (28% in 2020 vs. the EPA’s 27%) and found similar compliance costs.

Another factor explaining the cost differences is that each report models a different policy or bundle of policies. For the purposes of this note, we only examine the “core” policy cases considered in each study even if a particular analysis considered multiple scenarios. Policy instruments vary in flexibility and in turn vary in cost. For example, CATF, EPA and NRDC all considered policies that allow flexible compliance (such as credit trading) between regulated sources, though to different degrees. EPA and NRDC considered state and regional performance standards while CATF considered a national cap and trade program on coal emissions. The policies in all three of these studies are relatively flexible compared to those in the Chamber analysis, which apparently combines a carbon price and command-and-control requirement that all new natural gas combined cycle (NGCC) plants be equipped with carbon capture and storage (CCS) technology beginning in 2022. Different model assumptions regarding the price of natural gas, the price and performance of new generation technologies and future electricity demand growth also contribute to different estimates of cost.
Let’s turn to the benefits side of the ledger. Estimates of the benefits of 111(d) regulations will vary depending on modeled level of abatement (the more abatement the higher the benefits), the choice of which benefits to count (e.g. avoided climate impacts, public health benefits from SO2 and NOx reductions) and what value to place on each ton of pollution avoided (including what discount rates are applied). Indeed, looking across the 4 studies, total 2020 benefits are as low as $34 billion for EPA and CATF to as high as $62 billion for NRDC. The Chamber study did not include a quantification of benefits in its analysis. Using the Chamber’s projected GHG emission reductions; we calculate a rough average benefit of avoided climate costs between 2014 and 2030 of $21 billion a year, using the Office of Management and Budget’s central value for the social cost of carbon.
As the Chamber study does not report reductions in conventional pollutants, we are not able to quantify the resulting public health benefits from their reported results. The ratio of public health benefits to climate benefits varies greatly across the 3 other studies. EPA calculates that in 2020 every dollar in climate benefits would be matched by $0.94-$2.18 in public health benefits. NRDC calculated a range between $0.33-$0.48 dollars for every dollar in climate benefits in 2020 and CATF’s calculation was in the middle of the pack at $1.27 in public health benefits for every dollar in climate benefits. Assuming the Chamber analysis generated the lowest ratio of public health benefits from the three other studies (NRDC) then the public health benefits on average could be somewhere near $6.9 billion. Add this value to our estimate of climate benefits from the Chamber’s analysis and total benefits would be $27.9 billion, roughly equal the Chamber’s reported cost of $28 billion.
EPA’s Clean Power Plan vs. Cap-And-Trade
While some have likened EPA’s CPP Proposal to cap-and-trade, the proposed rule doesn’t set a cap on emissions nor does it require states to implement cap-and trade programs. Still it’s useful to compare the EPA’s proposal to the last major climate policy proposal, which actually would have established a cap-and-trade program, the Waxman-Markey bill that passed the House of Representatives in 2009 and subsequently died in the Senate the following year.
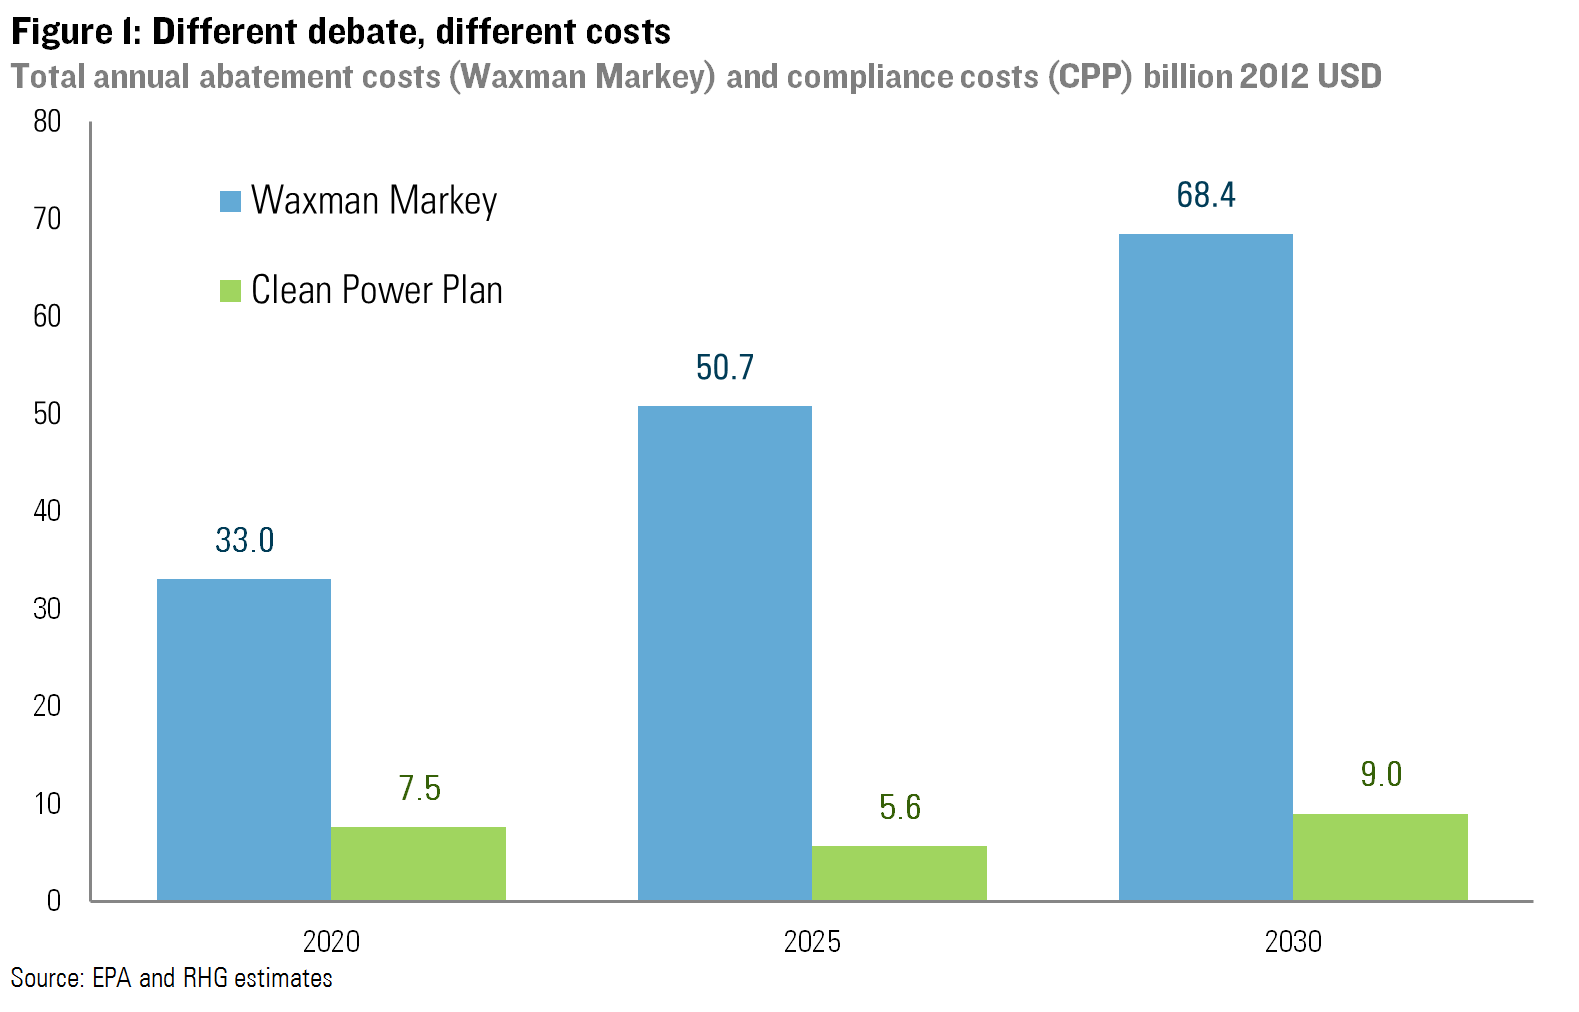
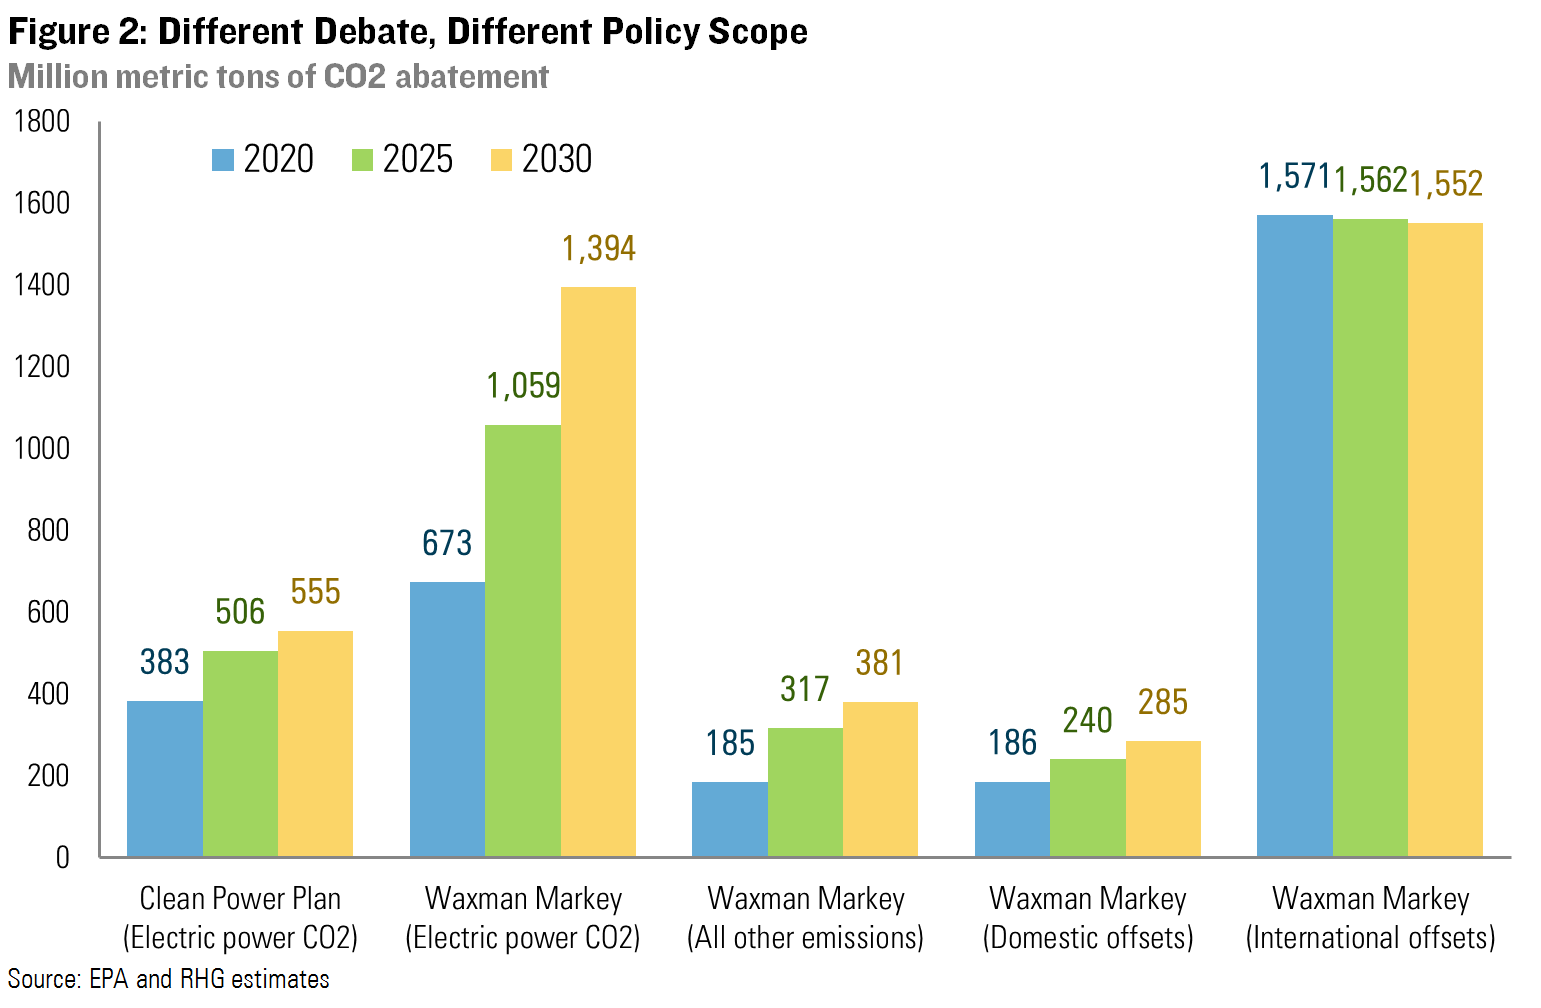
Figure 1 compares projected CPP compliance costs from EPA’s June 2 RIA with EPA’s 2009 estimate of compliance costs under Waxman-Markey. The latter’s costs were projected to be more than four times higher than EPA’s current proposal in 2020, at $33 billion compared to $7.6 billion for the CPP. In 2030, Waxman –Markey’s costs were projected to be 7 times higher than the CPP. In terms of potential economic impact, the CPP and Waxman-Markey are in two different leagues. That applies to the benefits side of the ledger as well. Waxman-Markey would have established a broad cap-and-trade program covering about 85% of total US emissions, nearly every sector of the economy. The CPP targets just the electric power sector. Waxman-Markey also required deep economy-wide GHG emission reductions of 42% below 2005 levels by 2030. Much of the projected abatement under Waxman-Markey was projected to occur through the use of domestic and international offsets (Figure 2), but estimated domestic abatement was still more than twice as high as what EPA projects under the CPP.
Beyond differences in policy scope and design, there are a number of structural factors that explain why the CPP is projected to be cheaper now than cap-and-trade was in 2009. A lot has changed over the past five years. New features of the US energy landscape, including cheap natural gas due to the shale boom, historically low electric demand growth, and cheaper renewables, alllower the costs of climate action in the electric power sector.
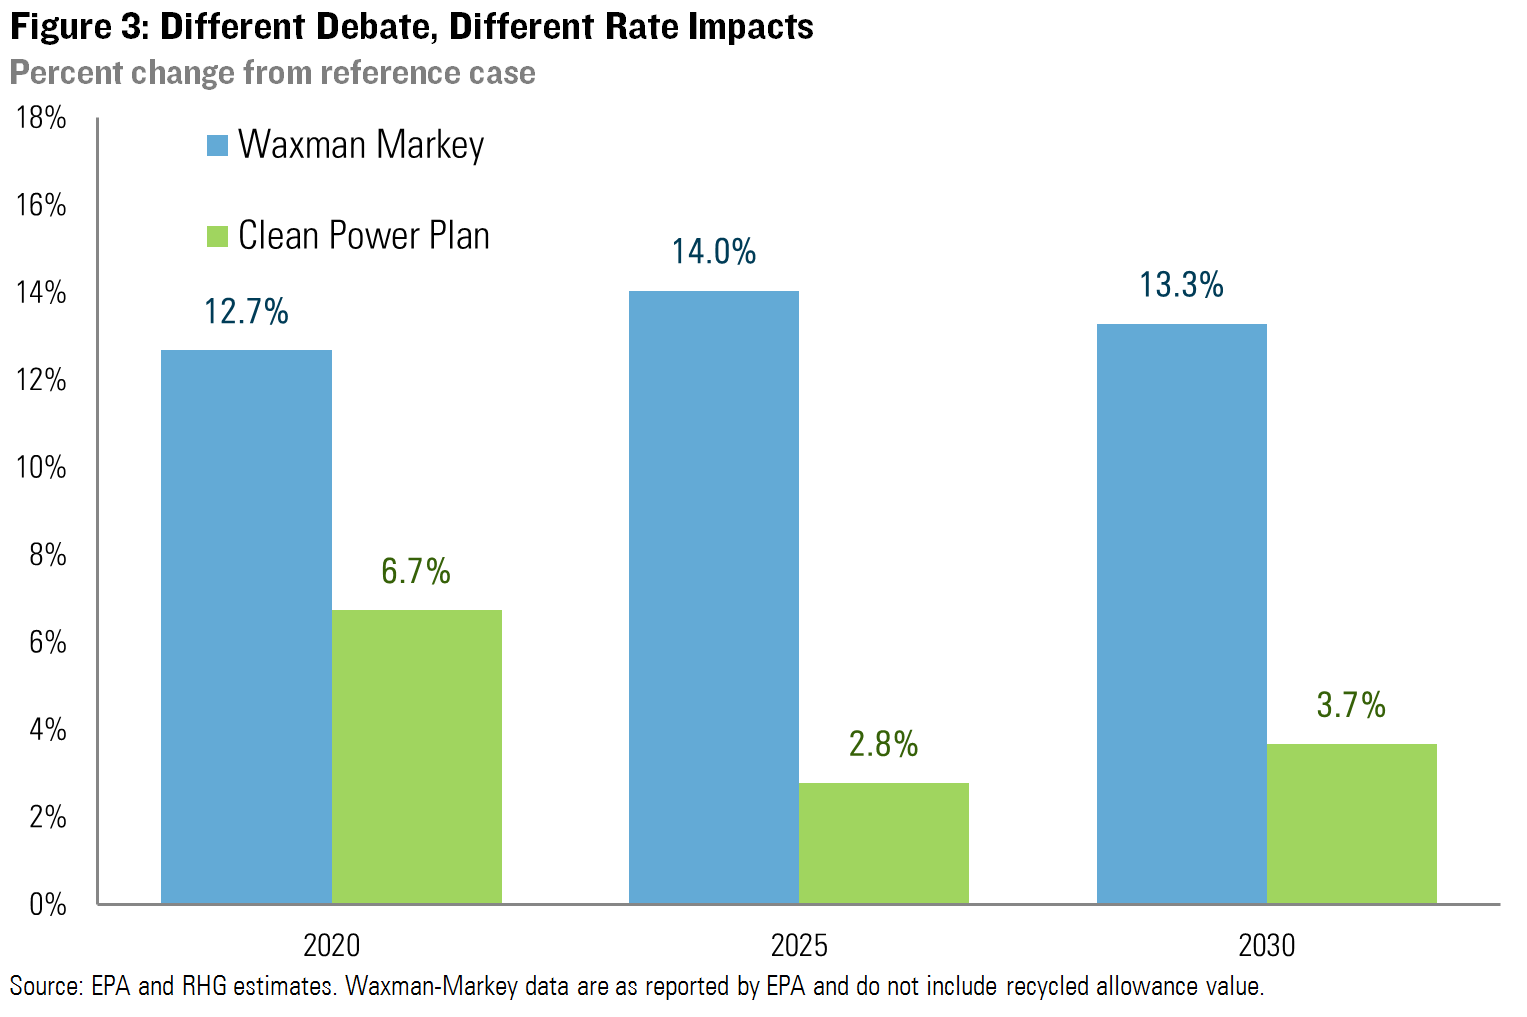
Often more important politically than the potential compliance costs of a climate policy proposal is what it means for household and business electricity rates. As with compliance costs, the EPA is projecting considerably smaller rate increases under the CPP than they projected to occur under Waxman-Markey (Figure 3). Much of this is explained by the difference in abatement – Waxman-Markey was projected to deliver 76% more emission reductions in the power sector in 2020, and 109% more in 2030. The recent economic and energy market developments discussed above also play a major role. A final factor is the nature of the policy instrument contained in each proposal. Cap-and-trade programs impose a cost on CO2 that is ultimately passed through to electricity customers in the form of higher rates (though that impact was intended to be partially offset under Waxman-Markey through allowance allocation). Under the intensity standard approach used by EPA in the CPP, the payments made by sources that have higher emission rates than the performance level go to sources that beat the performance level and amount to a transfer of value that stays within the electric generating sector. This minimizes increases in wholesale prices and, in turn, retail electric rates. Even the Chamber report projects electricity price increase of less than 5% on average between 2014 and 2025.[1]
The Rest of the Picture
EPA’s RIA provides us with a first glimpse of the potential electricity sector impacts of the actual draft guidelines, as opposed to hypothetical 111(d) regulations. Yet while the electricity sector is the target of the Clean Power Plan, it has significant implications for energy markets more broadly, from coal and natural gas production and pricing to renewable energy and energy efficiency investments. Indeed, given the relatively modest electricity price impacts projected by EPA, these energy market effects may well be the most significant economic consequence of the CPP. We have partnered with the Center for Strategic and International Studies (CSIS) to analyze the energy market consequences of the CPP and what it means for state and regional economies, and are scheduled to release our initial findings next month.
[1] The Chamber does not report change in electricity prices directly but rather the cumulative change in electricity costs between 2014 and 2025. We applied this change to the Chamber’s projected increase in electricity prices in the base case, and electricity sales in the policy scenario.