Unlocking Electro-industrial Growth to Meet Surging Electricity Demand in the Southeast
By enacting policies that support the manufacturing and deployment of clean energy, Southeastern states can crowd in private investment and see meaningful economic benefits while building a more robust grid.
Economic growth and meeting surging electricity demand are increasingly linked trends as the US stands at the precipice of an “electro-industrial” era. The engines of investment—data centers, new domestic manufacturing—are reliant on reliable, low-cost electricity to power their growth. As federal policy supporting this growth becomes less predictable, states are well-positioned to capture leadership and attract private investment and jobs while building a more robust grid and holding down electricity prices for consumers. Thanks to a combination of rapid load growth, demonstrated success in clean energy investment, and a favorable policy environment, the seven states in the Southeast we focus on in this analysis—Alabama, Georgia, Kentucky, North Carolina, South Carolina, Tennessee, and Virginia—are well-positioned to meet the moment.
By enacting policies that support the manufacturing and deployment of clean energy, these Southeastern states can crowd in private investment and see meaningful economic benefits. We estimate the impacts of two sets of electro-industrial policies and find that Southeastern states can drive 89-128 GW of new capacity on the grid (52-75%) and a 46-76% increase in new capacity in key manufacturing sectors. This translates to a $46-82 billion increase in private sector capital investment in the power sector, clean manufacturing, and associated industries and a 164,000-425,000 increase in regional job-years. These policies have a price tag to state governments of 0.3-1.9% of total annual state budgets on average, yielding $2.48-8.16 of private investment for every public dollar spent. States in this region can use these findings as a playbook to win the race to the top for attracting investment from their neighbors spurred by burgeoning electro-industrial growth.
The case for electro-industrial growth
The United States is at a critical juncture in its economic growth and energy system evolution. Electricity demand is surging for the first time in a generation: we estimate a 2.4% increase in grid electricity demand in 2025 compared to 2024, more than four times the average pace of annual growth over the last decade. Far from a one-off, we expect elevated load growth to persist, averaging 1.4-1.9% annual total growth over the next 15 years (Figure 1), with even faster peak demand growth in some regions.
Much of this growth is driven by new large loads, especially AI data centers but also growth in new types of manufacturing—sectors that have been growth engines for the US economy over the last few years and that are reliant on low-cost, reliable power. For instance, in our modeling, data centers account for 47-65% of electricity demand growth in 2030 and 44-59% in 2040. In these scenarios, data centers make up 14% of total US electricity demand in 2040. This intersection of load growth and economic growth is a manifestation of what our partners at the New Energy Industrial Strategy (NEIS) Center term the “electro-industrial era.”
The grid is struggling to keep up with this generationally high growth coming after two decades of effectively flat demand. Though the queue of generators waiting to interconnect to the grid shrank slightly in 2024 (the last year of available data), the time from making an interconnection request to actually coming online has trended persistently upward over the past two decades. The median project now takes longer than four and a half years to begin commercial operation, owing to long interconnection queues, a lack of good overall transmission planning, and increasing permitting hurdles at the local and state levels. When surging demand meets constrained electricity supply, the result is higher prices. In the PJM Interconnection, a portion of the grid stretching from the mid-Atlantic to northern Illinois, the latest auction to bring new capacity onto the grid settled at its policy-mandated price cap for the second year in a row, up by more than ten times from auction results just four years earlier. These increased costs translate directly into higher electricity rates for consumers and businesses.
Pushing back retirement dates for existing fossil assets on the grid could help fill the gap between anticipated demand and limited supply in the near term, but this approach doesn’t reflect a strategy for meeting what we project to be sustained rapid growth of demand. There is also a shortage of new gas turbines available to construct new gas generation facilities, and the prices of gas turbines have doubled in recent years. In the case of both existing and new fossil assets, the investment in the purchase of fuel generally accrues to entities outside of the Southeast region, directly transferring private capital to other states.
By contrast, clean technologies are often the cheapest source of new electricity in many parts of the country, and since they comprise a large share of the installation pipeline, they are also among the fastest ways to meet new load. Clean electricity technologies like solar, wind, and batteries have consistently made up more than 75% of new capacity on the grid since 2020.
The new policy environment
Recent policy changes at the federal level inject further uncertainty into the viability of the electro-industrial era. The Fiscal Year 2025 budget reconciliation bill passed by Congress and signed by the President, often called the “One Big Beautiful Bill Act,” cuts clean electricity tax credits off early for wind and solar and adds increasingly stringent foreign sourcing limits for any clean technologies that want to claim the credit in the future. When paired with tariffs specifically targeting clean technologies like solar cells and increased scrutiny for federal permits and actions for wind and solar, the federal policy environment is less favorable for clean technologies than it was a year ago.
This shift in federal policy presents an opportunity for states to capture the lead in meeting load growth, but to do so in a way that greatly benefits their local economy. By supporting the full stack of electro-industrial technologies—from manufacturing the key components of new generating technologies to building utility-scale facilities to operating them into the future—states can build robust, resilient economies that meet the current moment of load growth.
We’ve seen what solid industrial policy can accomplish by looking at the impacts of three landmark federal bills: the Infrastructure Investment and Jobs Act (IIJA), the CHIPS and Science Act, and the Inflation Reduction Act. In the third quarter of 2021, just before the passage of IIJA (the first of these three bills), clean investment represented 2.6% of total US private investment, or roughly $36 billion. The combination of supply-side support for new manufacturing of clean technologies paired with meaningful demand pull from clean energy tax credits yielded a measurable result: in the third quarter of 2025, clean investment had more than doubled to $75 billion and made up 5.3% of total private investment.
States can learn from past federal experience and compete in this new policy landscape. The US still needs to substantially expand the grid to meet the electro-industrial moment. Now the race is on for states to capture their slice of the pie—and potentially more. In this note, we first discuss why our initial regional analysis is focused on the Southeast and what policies we model in that region. Then we unpack energy system and economic impact results from these models. We provide additional detail on how we conduct this modeling. Finally, we close with next steps for states that want to take advantage of this opportunity.
Why the Southeast?
Against this macroeconomic and policy backdrop, Rhodium Group and the NEIS Center are partnering to analyze how subnational industrial policy can enable states to seize the moment. This is the first in a series of notes unpacking specific regional electro-industrial clusters that seeks to answer key questions about policy impacts: how much can states drive electro-industrial investment, how does this crowd in private investment, and what are the economic benefits of these investments?
Our first electro-industrial cluster analysis is focused on meeting increasing electricity demand in seven states in the Southeast: Alabama, Georgia, Kentucky, North Carolina, South Carolina, Tennessee, and Virginia (Figure 2). There are a few reasons we start in this part of the country. First, there is meaningful load growth occurring in this region—around 30% of expected new electricity demand between 2025 and 2035 is concentrated in these seven states. This is driven by broader population trends resulting in more new housing starts in this region, but also by a concentration of major large load sources. Virginia in particular is the largest hub for data center activity in the country, and though this sector is trending more geographically diverse, Virginia is likely to remain a major hub.
Second, these states have a track record of building clean economies, with major investments in new solar, storage, and other clean energy installations as well as in clean manufacturing capacity (Figure 2). According to the Clean Investment Monitor, 44% of total national clean manufacturing investment from 2022 through the third quarter of 2025 occurred in these seven states. The leading technologies for this manufacturing investment over this window were batteries (69%), solar (14%), and zero-emission vehicles (11%). Related to the load growth point above, some of these manufacturing facilities also represent major new sources of large load demand.
Beyond clean technologies, the Southeast is also a powerhouse for industry more broadly. The region hosts factories producing aerospace and defense products and is also home to an automotive sector that has been expanding over time. This matters for two important reasons. First, this means the region has a large labor pool available for new manufacturers who want to locate there, providing another pull for private investment. Second, as large consumers of electricity themselves, these incumbent industries also form part of the electro-industrial stack and are reliant on the availability of reliable, low-cost power to sustain and expand.
Finally, this cluster of states ranks highly on NEIS’s electro-industrial readiness index, which is a measure of how ready states are to capture electro-industrial momentum based on six characteristics: policy reliability, regulatory ease, economic capacity, physical infrastructure, deployment, and cluster formation. Virginia, South Carolina, and Georgia each have “high” readiness, while North Carolina, Kentucky, and Tennessee have “average” readiness.
Policies to drive electro-industrial cluster growth
In December 2025, NEIS published GREASE Lightning: A playbook for investment-led, state-driven electro-industrial economies. This policy framework identifies the ways that states can take an investment-led approach to leveraging electro-industrial momentum and growing their economies. The GREASE approach highlights key characteristics of successful electro-industrial investment policies: governance, regional training, expansive ambition, accountability, sectoral strategies, and environmental co-benefits. In developing GREASE, NEIS reviewed a wide range of energy and economic development policies enacted or under consideration at the state level. Rhodium Group has also produced considerable work analyzing the impacts of federal-level energy policy.
Together, we created a list of potential policies and constructed two policy groupings to represent the potential impacts of government-led efforts to further drive the Southeast electro-industrial cluster. Our State Action policies represent a starting point for state governments that are interested in laying the groundwork for electro-industrial expansion, while Enhanced State Action policies represent a further investment to secure leadership (Table 1).
Key to driving deployment of new clean electricity supply on the grid is a clean electricity tax credit, which offers an investment tax credit (ITC) based on a percentage of the capital expenditures of the construction costs of a new clean generating facility or a production tax credit (PTC) providing a per-megawatt hour (MWh) credit for electricity generated at qualifying new clean facilities for ten years. This clean electricity credit phases out once a specific type of generator (e.g., solar, small modular nuclear reactor, wind, etc.) reaches 20% market penetration. We pair this demand-side driver for new clean technologies with a supply incentive in the form of a manufacturing production tax credit, which provides per-component credits at levels equivalent to current federal support to manufacturers of key clean energy technologies for facilities that commence construction or expand output in 2026 or beyond.
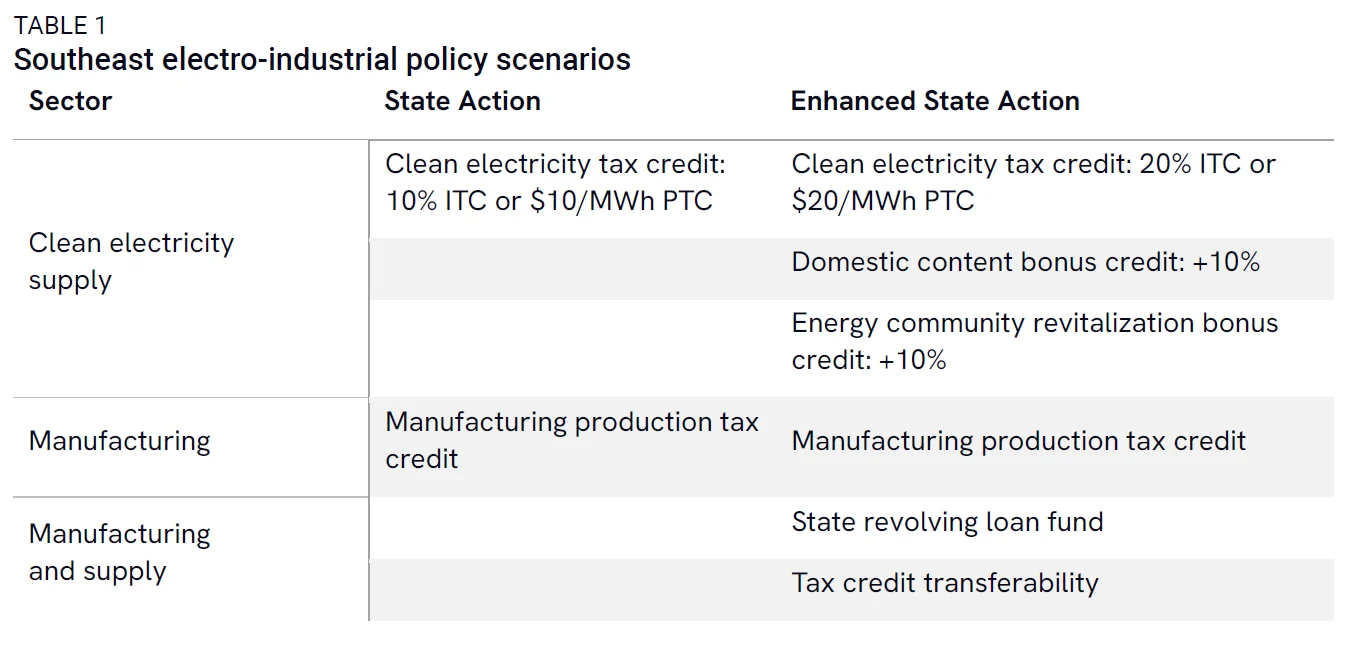
Additional bonuses are available in Enhanced State Action for new clean generators built using domestic content or in specified areas home to former energy infrastructure targeted for revitalization. We also model inclusion of a state revolving loan fund and transferability of tax credits to improve access to and lower the cost of capital for clean electricity supply and manufacturing projects.
State policies can spur meaningful new grid capacity additions to the grid, new manufacturing
Policies supporting state-level electro-industrial growth can enhance the Southeast electric grids by increasing new capacity, transforming the generation mix, and reducing reliance on imported electricity. In this section, we’ll analyze the impacts of state policies on these critical electricity metrics. To focus on the achievable, medium-term impacts of these policies, we focus our analysis on the years 2026 through 2035. We analyze the impacts of these policies on the region as a whole rather than for individual states. We provide further details on our modeling approach later in this note.
Capacity and generation
State-level clean investment policies spur a substantial expansion of the grid compared to today’s levels, increasing installed capacity by 89-128 GW in 2035 relative to 2024 (a 52-75% increase). This bigger grid is able to produce more electrons and does so in a cleaner fashion.
In 2035, State Action and Enhanced State Action policies drive new clean investment across the Southeast, with solar emerging as the biggest winner (Figure 3). State Action sees nearly 60 GW of solar capacity deployed above our current policy baseline through 2035, increasing total solar capacity by 150% compared to baseline. More substantial tax credits and the additional policies available under Enhanced State Action drive about 90 GW of solar capacity additions above baseline through 2035, increasing total solar capacity by 225% from baseline.
Other clean technologies see smaller gains. Wind capacity grows by 7 GW relative to baseline in Enhanced State Action, exhausting most of the high-quality wind resources available to the Southeast. Storage capacity also grows by 7 GW above baseline in Enhanced State Action, responding to tax credits and cheaper cost of capital, as well as the need to balance growing variable renewable generation. Neither policy scenario spurs new nuclear capacity additions, as both advanced nuclear reactors and small modular reactors remain too expensive to compete with cheap solar. Altogether, clean investment policies drive 59-102 GW of additional clean capacity deployment over baseline—a 234-405% increase.
These new resources have important impacts on the grid. First, new clean resources displace existing fossil capacity and prevent some new-build fossil capacity. Southeast coal retirements increase by 3 GW and 7 GW relative to baseline in State Action and Enhanced State Action, respectively. These policies also reduce the Southeast’s dependence on new natural gas combined cycle capacity, decreasing additions by 6-7 GW through 2035. However, growing variable renewable penetration drives 4-5 GW of additional combustion turbine capacity, which deploys to increase grid reliability while reflecting availability constraints on new gas turbines.
More critically, new grid resources help meet growing electricity demand in the region, which increases by 17% in 2035 relative to today. As a result of this clean capacity growth, zero-emitting resources account for 58-67% of total generation in the Southeast in 2035, up from 45% in our baseline and 42% today (Figure 4). In our current policy baseline, solar generation shares reach double today’s levels by 2035. With state clean investment policies in place, solar generation shares increase to 5-6 times today’s levels by 2035. While 2035 gas generation shares increase relative to today in our baseline, they shrink by 8-14 percentage points with state policies in place. Increased wind generation and declines in coal generation contribute more modest impacts to zero-emitting generation shares. Although nuclear generation shares decline slightly, nuclear generation itself remains flat. State policy action drives higher levels of total generation in the Southeast as developers take advantage of state clean investment incentives and choose to build in the Southeast instead of other regions.
Electricity trade, prices, and emissions
A few interesting outcomes emerge from these shifting power sector dynamics. First, the growth in new capacity not only helps the region meet increasing load growth but also reduces reliance on imported electricity from other regions. In our current policy baseline, the Southeast imports 42-53 billion kilowatt-hours from neighboring regions, amounting to around 5% of total in-region demand (Figure 5). By virtue of economics and constrained transmission capacity, the region also exports electricity to neighboring regions; when accounting for exports, net imports amount to 2% of in-region load in 2030 and 4% in 2040. The capacity added due to the state policies we modeled meaningfully reduces the levels of gross and net imports, and in the Enhanced State Action scenario the region actually becomes a net exporter of electricity to other regions. Put another way, this means that there could be spare in-region capacity available to serve new sources of electricity demand that our modeling does not currently anticipate.
Second, the region is able to achieve these outcomes while reducing electricity prices. Electricity rates for residential customers decline by 1-2% compared to baseline. While not a massive change, it’s enough to reduce household electricity bills by more than $1 billion through 2035 and more than $600 million per year on average through the rest of the 2030s. Rates for major industrial users of electricity also decline by 1-2% compared to baseline. Critically, these declines happen against a national backdrop of continued price hikes, and these policies help mitigate some of those increases in the Southeast. Nationally, industrial electricity prices increase by 9-11% over 2025 levels in 2035, while in the Southeast these policies help hold increases to only 8% over 2025 levels. Alongside the spare capacity discussed above, these relatively lower rates could create a favorable environment for attracting new investment in electricity-intensive industries that rely on low-cost, reliable power.
State-level clean investment policies benefit the climate as well as the energy system. Power sector emissions decline by 57-81 million metric tons of CO2 in 2035 in State Action and Enhanced State Action scenarios compared to baseline, a 21-36% reduction. Because the clean generation in the Southeast displaces some generation from neighboring regions, total emissions impacts from these policies across the entire nationwide grid are even greater.
New manufacturing capacity
As is evident in Figure 2, the Southeast is already a hotbed for clean manufacturing with major concentrations of solar, battery, and zero-emitting vehicle factories in the region. We find that the combination of supply-push policies providing incentives for in-region manufacturing of clean technologies, combined with demand-pull policies driving more capacity onto the grid, can further solidify the region’s status as a leader in clean technology manufacturing.
The biggest response in grid deployment and, as a result, the biggest response in clean manufacturing comes in the solar sector. The solar panels at solar farms across the region are made up of a supply chain of key components, from polysilicon as a key input through wafers and cells that are ultimately assembled into the solar modules that are installed and produce electricity for the grid.
As of the third quarter of 2025, the Southeast region hosted 11.5 GW of solar cell manufacturing capacity and 3.5 GW of solar wafer manufacturing capacity. These are facilities that are either currently operational or where construction is already underway. Based on results from our national solar manufacturing model alongside RMI’s state investment attraction model, we find that the Southeast could attract another 5.3-6.8 GW of solar cell manufacturing—a 46-59% increase over current capacity. We also find that the region could increase solar wafer manufacturing by as much as 2.8 GW (a 76% increase) and establish a new foothold as a producer of polysilicon for use in solar with as much as 4.9 GW of new in-region capacity. We do not find additional in-region response in the manufacturing for other clean technologies owing to a combination of sufficient national manufacturing capacity and relatively small responses in regional deployment.
State policies lead to increased private investment and jobs
Policies supporting electro-industrial expansion in the Southeast not only influence energy outcomes but also generate tangible economic opportunities across the region. These opportunities include thousands of jobs and mobilizing billions of dollars of private investment into the region. In the following sections, we detail the private and public investment impacts, employment effects, and occupational opportunities of this state-level action.
Investment impacts
Over the ten-year window, the State Action scenario results in $45.7 billion in additional private capital investment in the region compared to current policy, while the projects spurred by Enhanced State Action would attract $81.3 billion in private investment into these states (Figure 6).1 In both policy scenarios, private investment is driven primarily by the build-out of additional solar capacity, bringing substantial capital into the local economy. Slight decreases in investment in natural gas capacity are outweighed by substantial increases in investment in solar, wind, and storage.
Private capital investment is effectively flat for solar manufacturing as compared to baseline, despite meaningfully higher solar manufacturing capacity in the region. There are two reasons for this. First, the advanced manufacturing production tax credit as described above provides a higher portion of the total cost of these projects than similar production and investment tax credits for electricity generation facilities. Second, the total cost of these factories is more heavily weighted toward ongoing O&M expenses, which don’t show up in calculating private capital investment. But these O&M expenses do result in robust job growth in this sector, which we unpack further below.
Employment impacts
Across both state action policy scenarios, net jobs in the energy sector and associated industries increase substantially compared to our current policy baseline. In the State Action scenario, we find jobs increase by 164,755 to 197,770 job-years between 2026 to 2035 compared to baseline (Figure 7).2 Enhanced State Action is associated with more than twice as many net jobs: 350,320 to 425,240 job-years over the same timeframe. (Figure 7). These net employment numbers are inclusive of any job losses resulting from displaced existing fossil capacity and new fossil capacity that would otherwise be built in the baseline policy scenario.
We break these top-level job results out across two different dimensions. First, we classify results as project-level jobs or supply chain jobs. Project-level jobs are associated with direct inputs, including the construction, engineering, equipment, materials, and operating expenses of electricity generation facilities and the associated transmission and manufacturing build-out. Supply chain jobs refer to jobs associated with economic activity upstream of project-level jobs—for instance, jobs associated with transport and logistics, real estate, and component fabrication. Roughly two-thirds of the jobs are project-level jobs, and the remaining one-third are supply chain jobs.
Within project-level and supply chain jobs, we further disaggregate jobs by project phase, between development and construction versus operations and maintenance (O&M). Development jobs are those associated with building energy generation facilities. Examples of development phase job growth include jobs associated with establishing a solar or wind farm that is realized only under a state action scenario. An example of development phase job loss is jobs associated with the construction of a natural gas plant that would have been built in the baseline scenario, but that is not built under the state action policy scenarios. O&M jobs are those required to operate and maintain these assets. As the next section shows, the majority of net job growth is associated with clean energy deployment, particularly solar. Since the installation phase of clean energy projects is the most labor-intensive, and operations and maintenance requirements are relatively modest thereafter, the majority (around 90%) of employment is associated with development.
In both state action policy scenarios, examining employment impacts separated by technology largely mirrors the energy system capacity changes relative to baseline. Solar is the industry with by far the largest increase in jobs, accounting for 70% of total job-years on an absolute basis. Under Enhanced State Action, jobs associated with solar increase by 265,390 to 324,370 job-years between 2026 and 2035 (Figure 8).
In both state action policy scenarios, we also see increases in jobs associated with solar manufacturing, wind energy, storage, natural gas combustion turbines, and transmission—all industries with additional capacity and build-out compared to baseline. We see net negative jobs associated with building and operating natural gas combined cycle plants, given the decrease in capacity compared to baseline. Moreover, the decrease in coal industry jobs is all O&M jobs, stemming from a decrease in coal generation under the state action scenarios.
Occupational analysis
To better understand how employment impacts translate into workforce needs, we analyzed net changes in occupations between the state action scenarios and our current policy baseline. Among both development and O&M jobs, we found exclusively net increases across occupational categories. The significant growth in roles—particularly those related to solar expansion and solar manufacturing—more than offset occupational losses tied to declines in other technologies.
Eight occupational categories account for just over 80% of total development occupations in both state action scenarios (Figure 9). Solar deployment is the largest driver of development phase occupations. Accordingly, the occupational mix shown here aligns with the workforce profile typically associated with the solar industry. Construction and installation workers account for the largest share of labor needs in energy infrastructure development, including construction equipment operators, solar photovoltaic installers, and electricians. Financial operations encompass roles such as accountants and auditors, bookkeepers, and financial analysts. Workers in this field help to support project development by designing financial structures, preparing and reviewing financial documents and forecasts, and ensuring financial regulatory compliance.
The top eight occupational categories associated with ongoing O&M account for more than 70% of total O&M occupations in both state action scenarios. It’s important to keep in mind that the magnitudes underlying these occupational percentages are significantly smaller for O&M compared to the development phase. These results primarily reflect the large number of ongoing O&M occupations generated by solar deployment and solar manufacturing. Construction trades workers include maintenance-related occupations such as solar photovoltaic installers and electricians, as well as construction helpers and laborers. These workers are often tasked with installing, maintaining, and upgrading key pieces of equipment across the energy system. Executives and business operations roles are composed of project and operations managers and management analysts. These positions oversee facility performance, coordinate project schedules, and improve business efficiency for power generation facilities.
Fiscal impacts
In addition to crowding in private investment and supporting meaningful job growth, these policies also have important implications for state government balance sheets. As is the case with the rest of this analysis, we examine government fiscal impacts on a ten-year basis from 2026 through 2035.
Regional investments into electro-industrial growth increase state government revenue collection from a variety of sources, including personal taxes, corporate profit taxes, taxes on production and imports, and social insurance taxes. The State Action scenario would generate almost $900 million in gross increased revenue while the Enhanced State Scenario would result in $1.9 billion in additional tax revenue between 2026 and 2035 (Figure 11). These gross revenue increases are accompanied by fiscal costs to state government, largely in the form of foregone tax revenue. Government costs over a ten-year time period total $5.6 billion in the State Action scenario and $32.8 billion in the Enhanced State Action scenario. Taken together, the net fiscal impact to state governments is $4.7 billion in the State Action scenario and $30.9 billion with Enhanced State Action policies.
While these are not insignificant numbers, the outlays are small relative to overall state budgets. The enacted annual budgets for these states—either fiscal year 2025 or 2026 depending on each state’s budget schedule—is $166 billion (Table 2). This total only represents state-fund appropriations and does not include any federal funding states receive. Thus, the annualized net fiscal impacts of these policies represent 0.3% of total current state spending in the State Action case and 1.9% of state spending under Enhanced State Action policies.
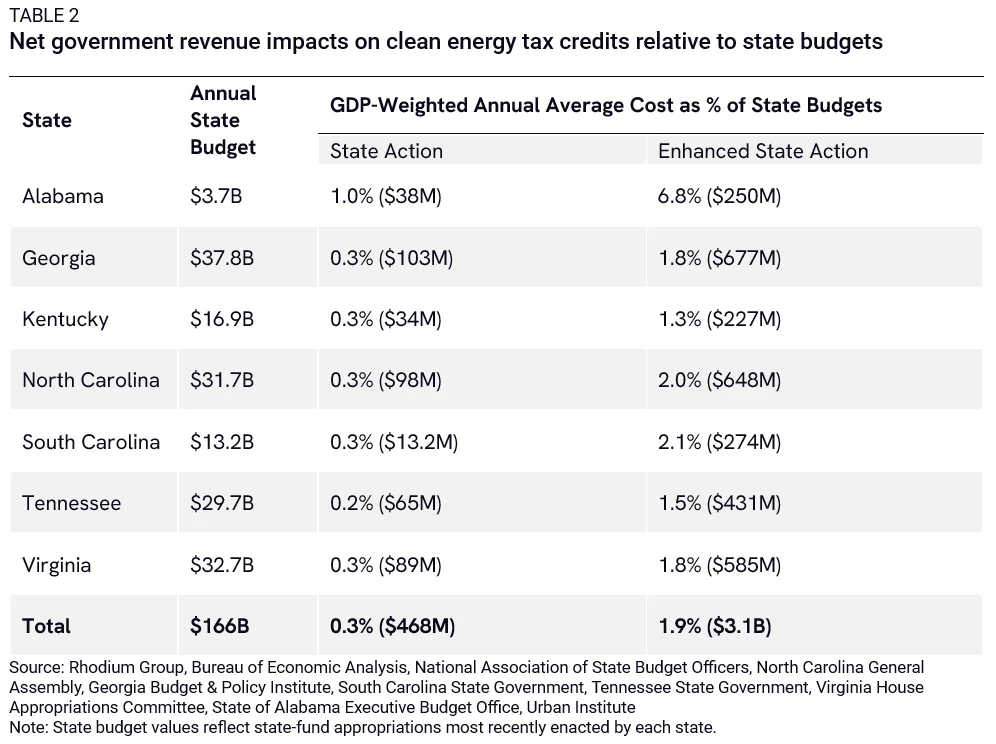
This analysis doesn’t provide individual state-level estimates of the fiscal impacts because the actual execution of these policies would be dependent on policy design choices that states make as well as the heterogeneity of resources across the region. To provide a rough proxy of impacts for any given state, we allocated the regional cost of the policy package across each state on a GDP-weighted basis. The result is that the State Action scenario generally has a net government revenue impact of around 0.3% of each state’s total budget, while the Enhanced State Action scenario has an impact of 1.5-2.1%.
Moreover, government spending on clean energy tax credits mobilizes private capital at a scale that far exceeds the public cost. In the State Action and Enhanced State Action scenarios, every $1 of public investment yields $8.16 and $2.48 in private investment, respectively.
Modeling approach
To estimate the impacts of these policies, we use a suite of modeling tools that Rhodium Group has deployed in other work, including energy system impacts using our RHG-NEMS economy-wide model and resulting economic impacts using the IMPLAN input-output model. Though we’ve used these pieces individually, this project marks the first time we’ve employed a soup-to-nuts modeling approach to describe a wide range of policy effects. To focus on the achievable, medium-term impacts of these policies, we focus our analysis on the years 2026 through 2035. We analyze the impacts of these policies on the region as a whole rather than for individual states. Each state in the region has a unique mix of resources that make them well-suited for a particular suite of investments. The regional impacts we report should be understood as indicative of the opportunity available to each state, but state-specific policy plans should be developed with in-state stakeholders and in light of the most promising investment options.
Energy system modeling
We evaluate the impact of these policies on power sector dynamics, electricity prices, and emissions using RHG-NEMS, Rhodium Group’s US energy system model. We model three policy scenarios: a baseline that represents current policy at the federal and state levels, including the OBBBA updates to clean energy and vehicle tax credits and rollbacks of Biden-era regulations; a State Action policy scenario that includes state-level clean energy and manufacturing tax credits to the Southeast; and an Enhanced State Action scenario that layers additional clean investment policy on top of the State Action scenario. To evaluate policy impact, we compare State Action and Enhanced State Action scenarios with the baseline scenario. All policy scenarios adopt the assumptions of our Taking Stock 2025 mid-emissions case, which pairs moderate clean technology costs with baseline economic growth and central fossil fuel prices. For more details about our mid-emissions case and baseline policy assumptions, see our Taking Stock 2025 report.
Manufacturing modeling
We take a two-step process to estimate expansions in manufacturing capacity resulting from these policy changes: we estimate national-level changes in manufacturing capacity and subsequently downscale these results to the state level using an investment attraction model.
To determine national-level manufacturing capacity additions, we compare average national demand for clean technologies in the baseline scenario with the policy scenarios. Where there is greater than a 10% increase in national demand for a given technology, we examine the status of domestic manufacturing for critical components of that technology as of the first quarter of 2025. So, for instance, we look at the amount of operational, under construction, and announced solar polysilicon, wafer, and cell production or battery cell and module production as of early 2025, which we consider to best represent the response to the IIJA, CHIPS and Science, and IRA-driven policy environment.3 If national demand for these technologies exceeds the current operational and under-construction capacity for these components, we assume that a policy similar to the pre-OBBBA 45X can support the development of additional manufacturing capacity up to the total announced capacity level as of early 2025.
We provide this national incremental manufacturing capacity to the NEIS team, who maintain a state-level investment attraction model to determine the most likely geographic distribution of this new manufacturing capacity. NEIS estimates the proportion of national investment that a state will attract in specific technologies by scaling up a model that predicts county-level investments using a probabilistic linear regression. The variables included in this model include past and current investment and economic activity, social indicators, employment conditions, and subnational policies. We then incorporate the manufacturing capacity expansions in our seven-state Southeast cluster into our broader economic impact modeling.
Economic impact modeling
Our economic impact analysis focuses on increases in private investment, net employment, net occupational opportunities, and net fiscal impacts in the Southeast region. We calculate the inputs to our economic model based on the results from the energy system and manufacturing modeling described above. For each technology, we develop inputs for key components of building new electricity-generating facilities based on current and projected in-region availability.
We input Rhodium’s cost data into IMPLAN—the economic input-output model—using its state-level tools to create a Southeast region comprised of the seven states in focus. To account for uncertainty around where each project deploys in the region, we apply a range of jobs to capture state-by-state differences in the rate of employment per dollar invested. This captures differences in capital intensity and productivity across states.
Our net employment estimates are reported in job-years, meaning one job for one year between 2026 and 2035. These numbers capture both on-site and off-site jobs supporting energy projects and manufacturing facilities. On-site jobs include construction labor to build the projects, while off-site jobs encompass activities such as equipment manufacturing or engineering performed elsewhere. Finally, we validated our findings against employment numbers reported by existing energy projects and manufacturing facilities, including those found in CIM.
To identify the types of jobs that will have the largest changes compared to the current policy trajectory, we analyzed the net occupations between the baseline scenario and our policy scenarios. We pulled occupational results from IMPLAN for development and O&M jobs and supplemented these outputs with Bureau of Labor Statistics data and industry insights. We do not consider supplier jobs in our occupational analysis.
We estimated fiscal impacts by analyzing net changes in state revenues and expenditures between the baseline scenario and each policy scenario, using IMPLAN’s tax impact outputs for development and O&M activity. These revenues are estimates and should not be used for budget planning.
Meeting the moment: a state playbook for success
Well-designed, targeted, ambitious policy can position states in the Southeast to take advantage of current energy and political trends in an emerging electro-industrial era. Far from a blip on the radar, structural increases in electricity demand are here for the foreseeable future—whether from explosive growth of data centers or steadier increases in electrification across the economy. Federal policy support for building out the grid to meet this moment is far less certain, so state governments have the opportunity to make technology, geography, and policy pivots. The payoff from these pivots is quite material. State policies can drive tens of gigawatts of new capacity onto the grid and reduce reliance on electricity imported from other regions while holding down growth of electricity rates. The billions in private capital investment to build new power-generating facilities, transmission lines, and clean technology factories, combined with sustained spending on operations and maintenance at these sites and beyond, can bring hundreds of thousands of net new jobs in the energy sector and associated industries increase drastically compared to current policy. And all of this can be accomplished with relatively minimal impact to state budgets.
This first case study of the GREASE policy framework demonstrates what’s possible for states that are interested in building a sustainable ecosystem oriented toward meeting the electro-industrial moment. But these policies aren’t self-executing. It’s incumbent on state officials and other key stakeholders to engage with the broader community to adapt these policies to local circumstances and underscore the potential value in their enactment. As our colleagues at the NEIS Center aptly state, “the electro-industrial transition is not a spectator sport.” Action now shifts to states to start putting steel in the ground and capturing their share of the electro-industrial future.
This nonpartisan, independent research was conducted with support from the New Energy Industrial Strategy (NEIS) Center in partnership with RMI. The results presented reflect the views of the authors and not necessarily those of the supporting organization.

Join an upcoming webinar: Wednesday, February 25th
Rhodium experts will be discussing our new work on electro-industrial policy in states in the Southeast.
RegisterFootnotes
When discussing private investment, we refer exclusively to capital expenditures (e.g., buildings, equipment) and not ongoing operations and maintenance (O&M) spending. We incorporate both capital and O&M expenditures when calculating employment impacts below. Private investment reflects total investment net of government expenditures, which we unpack in further detail below.
We use the term “jobs” occasionally to describe general employment trends, but all quantified employment results reflect job-years. A job-year represents one job sustained for one year.
Since the peak in early 2025, we’ve begun to see meaningful cancellations of manufacturing projects owing to the loss of clean energy and vehicle tax credits as demand drivers and restrictions on the use of foreign-sourced materials by manufacturers who want to claim the section 45X advanced manufacturing production tax credit.