Skip to content

Note

Energy & Climate

Building a Geothermal Powerhouse Region in the South-Central and Southwest United States

Targeted, well-designed, ambitious policies enacted by states can leverage the immense changes and investment opportunities on the horizon to drive deployment of geothermal on the grid.

A stretch of the South-Central and Southwest United States, from Louisiana and Texas to Arizona and Colorado, is already experiencing rapid changes to its energy system and economy, and those changes are poised to continue. Rapidly increasing electricity demand from large load sources like data centers and record installations of new electricity generators look to sustain this transformation. States in this region can strengthen their grids and their economies by transforming it into a hotspot of next-generation geothermal power deployment and manufacturing. Next-generation geothermal provides a clean, firm complement to increasing amounts of variable energy generation projected to come online in this region, and a combination of promising subsurface geology, a robust workforce rooted in the region’s oil and gas backbone, and strengths in manufacturing make this cluster of states particularly well-suited to seize the opportunity.

Targeted, well-designed, ambitious policies enacted by states can leverage the immense changes and investment opportunities on the horizon to drive deployment of geothermal on the grid, which can scale from basically zero today to providing as much as 4% of total regional power generation by 2035. The region is also well-positioned to manufacture Organic Rankine Cycle (ORC) turbines, a key current bottleneck in large-scale geothermal deployment. The effects stretch beyond this corner of the country, with the region becoming a supplier of these turbines to geothermal facilities elsewhere in the US, and the learning that comes from drilling and installing new geothermal plants driving down costs everywhere. The result: the region can drive $5-12 billion of the coming investment wave into the next-generation geothermal industry by 2035 and support tens of thousands of job-years, positioning these states as a geothermal powerhouse for the next decade and beyond.

Leveraging the electro-industrial transition

A concentrated wave of investment has been building in the United States over the past few years, focused on growth of electricity-intensive industries like data centers and clean manufacturing alongside with the electric infrastructure needed to power these quickly expanding fields. These trends are poised to continue, driving rapid increases in demand for electricity and linking US economic fortunes to its ability to serve electric load quickly, reliably, and cheaply. In this note, we continue our analysis of the ability of states to meet the moment in this transition to a new electro-industrial era.

Our first note on this topic, Unlocking Electro-industrial Growth to Meet Surging Electricity Demand in the Southeast, describes the basics of this electro-industrial growth and demonstrates how states in the Southeastern United States can enact smart, targeted policy to meet fast-rising electricity demand while building a sustainable regional economic engine with substantial private investment and job growth. In that first note, we show how state policy can act as an accelerant for trends that are already strongly established in a region.

We continue our work on the electro-industrial economic transition by answering a different question in this note: how can states scale a much more nascent but critical industry, creating a regional powerhouse of deployment and manufacturing? As we’ll unpack later, this means we take a different approach to discussing results in this analysis as compared to the first electro-industrial cluster, focusing on the growth of clean resources over the next ten years.

In this note, we first identify next-generation geothermal power generation as an early-stage but promising technology and explain how it can play a critical role in this transition. Then, we zoom in on our study region, portions of the South-Central and Southwestern US, and demonstrate how this region is particularly well-suited to drive momentum for new geothermal deployment and manufacturing. We outline key policies that states can enact to seize this momentum and then quantify the energy systems and economic results of putting these policies in place.

The role for next-generation geothermal in the electro-industrial future

The case for an electro-industrial future is predicated on continued—and expanded—availability of low-cost, efficient sources of electricity (on the supply side) and low-cost, efficient processes to convert these electrons into valuable economic outputs (on the demand side). The lowest-cost source of electricity in most parts of the country today is some combination of solar, wind, and battery storage. These technologies have the added benefit of avoiding conversion losses inherent to fossil fuel consumption.

These commercially available technologies can provide much of the electricity generation needed to power the electro-industrial era—an average of 57% in 2035 in the National Lab of the Rockies’ 2024 Standard Scenarios main cases and as much as 80% of generation across all scenarios in 2050. There are lots of ways to manage these sources’ intrinsic variability, including demand flexibility and a robust transmission network build-out. But firm generating capacity (generators that are available when called on rather than relying on variable inputs like wind and sun) plays a critical role even in these high renewable futures, and a robust portfolio of grid resources can maximize reliability while minimizing cost.

Next-generation geothermal power generation has numerous advantages in meeting this demand for firm power. Today, effectively all of the 4 gigawatts of installed geothermal capacity in the US use conventional hydrothermal technologies, which rely on naturally permeable subsurface reservoirs that are limited in their geographic availability. By contrast, next-generation geothermal approaches, including enhanced geothermal systems (EGS), closed loop geothermal systems (CLGS), and superhot geothermal, do not rely on these specialized formations and can be built in a much wider range of locations. Some of these systems can also operate flexibly, further enhancing their value to the grid. Much more information on these different types of geothermal technologies can be found in the Department of Energy’s Pathways to Commercial Liftoff: Next-Generation Geothermal Power report.

Recent advances in geothermal drilling techniques have substantially driven down the cost of drilling the wells needed for these next-generation systems. Geothermal drilling also leverages a large, skilled workforce focused on oil and gas production, as we unpack in greater detail below. As a result, we’ve previously found that EGS in select locations has a levelized cost of electricity that can be cost-competitive with natural gas plants—the most widely available firm technology today. Geothermal costs are also locked in once constructed, while the cost of gas generation is subject to considerable volatility in fuel costs. Finally, geothermal is one of a handful of technologies that will continue to benefit from federal support through the early 2030s in the form of a federal clean electricity tax credit, helping to further drive down costs to utilities and consumers and bring federal dollars to the region.

Clean firm resources more broadly—firm sources of electricity that emit few if any greenhouse gases—are particularly of interest to governments and companies that have clean energy or climate targets. Next-generation geothermal has been a leading source of new deals to provide clean firm capacity to corporate buyers, with large data center companies like Google and Meta lining up behind new-build geothermal projects.

The turbine bottleneck

Scaling geothermal deployments to achieve their promise will also require scaling the supply chains of the components required to drill geothermal wells and produce power. Our partners at RMI conducted a review of the current state of play and found that the need to build out this supply chain will not only enable faster geothermal growth on the grid but can also be a major economic opportunity.

For this work, we focus on one key link in the supply chain that RMI identified: the turbines that turn the heat that geothermal wells produce from the subsurface into electrons. Geothermal power plants use three primary turbine types: dry steam, flash steam, and binary cycle. Dry steam and flash steam turbines are typically used in higher temperature geothermal reservoirs, whereas binary turbines can generate power from lower reservoir temperatures, making them well-suited for most EGS projects. Today, most geothermal turbine manufacturing occurs outside of the US, with production concentrated in countries such as Israel and Italy. Lead times for turbines delivered to the US typically range from 12-18 months, with roughly 3-5 months of this attributable to international shipping alone. Expanding domestic manufacturing capacity could meaningfully reduce these lead times and accelerate project deployment, an increasingly important consideration given the emphasis on quickly bringing new capacity online. A more robust domestic turbine manufacturing base would also help protect geothermal development from global supply chain disruptions, such as shipping lane disturbances from geopolitical conflicts, tariffs, and export controls. The US has some existing binary turbine manufacturing capacity; however, it is primarily for small-scale turbines used in waste heat recovery applications rather than larger turbines required for utility-scale geothermal power deployment.

Before the shale boom in the late 2000s reshaped energy markets, high oil and gas prices led to a wave of excitement around geothermal as an energy source. In turn, we saw an uptick in domestic investments in geothermal turbine manufacturing at this time. In the years since, the geothermal sector’s boom-and-bust cycles have made investors wary of committing capital to domestic manufacturing facilities, given the risk of stranded assets.

Reversing this trend will require a coordinated policy approach: supply-side incentives to encourage in-region turbine manufacturing, paired with demand-side measures to accelerate geothermal deployment. Together, these strategies can not only restore domestic manufacturing capacity but also position the South-Central and Southwestern US as a leading hub for geothermal turbine production.

The South-Central and Southwestern US can scale up geothermal

Our study region for this work consists of seven states across the South-Central and Southwest US: Arizona, Arkansas, Colorado, Louisiana, New Mexico, Oklahoma, and Texas. This region has already experienced meaningful changes to its grid and economy and, as we unpack in the sections that follow, these changes are likely to continue. Between continued expectations of rapid load growth, high-quality subsurface geothermal resources, a huge concentration of skilled workers in the oil and gas industry, and a history of turbine manufacturing, the region is a perfect place for state policymakers to make investments to develop a strong geothermal industry.

First, there is a growing need in the region for firm, reliable power. For at least the last 15 years, this region has experienced mostly steady annual electricity demand growth while national demand fluctuated from year to year. Because of these trends, regional electricity demand increased by 33% from 2010 to 2025 while national demand grew by only 8% over the same time frame. National demand growth trends have recently shifted: demand has increased consistently since 2024, and all signs point to sustained growth into the future. Yet, the South-Central and Southwest US region continues to see higher levels of demand growth than the national average. These states drove 27% of national electricity demand growth over the last two years, and we expect that they will account for about 30% of national demand growth from 2026 to 2035. This demand growth is largely driven by data centers (especially in Texas), the electrification of oil and gas production in the Permian Basin, growth in manufacturing of semiconductors and clean energy technologies, and population growth. Data centers in particular need constant access to reliable power, while both data centers and oil and gas operations require low-cost electricity. Meeting this growing power demand is critical to sustaining economic growth in the region.

The seven states in focus pair rising demand with ample geothermal resources. Unlike the neighboring states of Nevada, Utah, and California, these states have seen little geothermal growth to date (apart from a single conventional hydrothermal plant in New Mexico). However, the availability of next-generation geothermal technologies like EGS opens up much more of the country to geothermal development. Recent estimates from the Department of Energy find hundreds of gigawatts of potentially developable resources in states across the region (Figure 1).
This analysis is focused on enabling a next wave of geothermal deployment in regions with deep oil and gas expertise, including the Permian Basin and Gulf Coast. In fact, expanding into states without much previous geothermal history is a feature—not a bug—of a build-out in this region. The Department of Energy’s Pathways to Commercial Liftoff: Next-Generation Geothermal Power report identifies a validation suite of projects across four to six states as the critical first step towards reaching commercial liftoff. This initial phase would entail 2 to 5 GW of deployment in locations that do not have any existing geothermal capacity.1 As our energy system impacts results below demonstrate, with targeted state-level policies, the South-Central and Southwest region is well-positioned to serve as this validation suite.

Two of the largest barriers to advanced geothermal deployment are its relatively high upfront capital cost and limited access to capital due to perceived investment risk. Establishing a regional validation suite could help overcome both hurdles by enabling EGS to benefit from learning-driven cost reductions while simultaneously increasing investors’ confidence in the technology. In turn, this initial wave of deployment could lay the foundation for geothermal expansion into greenfield sites beyond this region, accelerating the pathway to large-scale deployment.

This region is uniquely positioned to capture the workforce transition opportunity presented by geothermal development, as it is the epicenter of the nation’s oil and gas industry. According to Bureau of Labor Statistics data, 78% of the country’s oil and gas extraction workforce is concentrated in these seven states, and five of the seven states are the top states overall for highest oil and gas employment (Figure 2). The skillsets of oil and gas workers—including subsurface engineering, drilling operations, and resource extraction—closely align with the requirements of geothermal development.

These states are also well-suited to be geothermal frontrunners due to a legacy presence of binary turbine manufacturing in the region, including manufacturing facilities associated with TAS in Texas and Barber-Nichols in Colorado. This foundation of expertise in manufacturing turbines suitable for geothermal power underscores the region’s existing workforce strengths in energy-related manufacturing and indicates the potential to reestablish or expand these domestic capabilities.

In addition to being well-positioned for geothermal deployment for all the reasons listed above, the South-Central and Southwestern region includes states that rank high and very high on NEIS’s electro-industrial readiness index. This favorable rating highlights that these states are ready to capture electro-industrial momentum. This policy momentum extends explicitly into geothermal as well. Both New Mexico and Colorado have enacted limited experiments with policies to support geothermal power generation deployment, indicating state interest in this burgeoning field.

State policies to spur geothermal growth

Recognizing the advantages that geothermal deployment and manufacturing can yield and the unique position the South-Central and Southwest are in to capture these advantages, we partnered with our colleagues at the New Energy Industrial Strategy (NEIS) Center to develop policies these states could use to establish themselves as geothermal pioneers and leaders. As with our previous analysis of the Southeast load growth cluster, we heavily relied on NEIS’s GREASE Lightning policy framework to identify targeted, ambitious state policies.

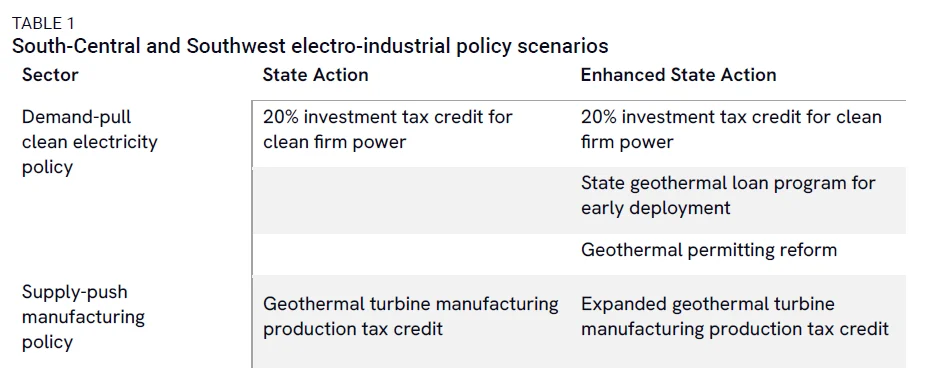
We model two policy scenarios that drive meaningful growth in geothermal deployment and manufacturing capacity (Table 1). The first, which we term the State Action scenario, includes a state investment tax credit available to all clean firm resources, which provides a credit of 20% of total capital investment to build qualifying new generating capacity. It also provides a manufacturing tax credit for the production of new ORC turbines sold for use at geothermal plants. These policies represent core demand-pull and supply-push approaches to support the growth of geothermal on the grid and in-region manufacturing of a key constrained component.

In the Enhanced State Action scenario, we expand beyond these core provisions to further amplify the impact of policy. First, we institute a short-term state geothermal loan program. A lack of access to capital is a commonly cited barrier to the near-term growth of geothermal deployment. Many geothermal developers, especially those that are earlier in their lifecycles, struggle to access the project finance they need to scale their impact, as commercial financiers are hesitant to back projects with some amount of technology risk. Even established developers face performance and operability risks. This is a clear opportunity for state governments to step in and provide patient concessionary capital to give these developers the durable certainty they need to get off the ground. By focusing on first- through early-nth-of-a-kind commercial-scale facilities, states can efficiently use their ability to raise low-cost capital and drive down costs for future installations through technological learning.

Another key policy component to drive more geothermal deployment is reforming the permitting regime these projects face. The Center for Public Enterprise recently released a report identifying how geothermal projects can be built and come online within a three to six-year timeframe, and in less than three years in optimal conditions, which relied in part on concurrent permitting and environmental review. Whether federal (as in CPE’s work), state, or a combination thereof, more efficient permitting processes can enhance geothermal’s speed-to-power. We reflect this in our modeling by making these technologies available earlier and with a shorter construction timeline.

Rounding out demand-pull enhancements, we also keep the investment tax credit from the State Action scenario in place and make that credit transferable. On the supply-push side, we increase the manufacturing credit to cover more of the cost of producing turbines.

State policies accelerate geothermal scale-up on an evolving grid

This region’s electric grid is expected to transform dramatically from today to 2035, growing to accommodate surging demand while replacing older, more expensive coal plants with a suite of newer technologies. State-level policies supporting geothermal deployment can help ensure that geothermal, a valuable zero-emitting baseload resource, plays a meaningful role in this grid transformation. In this section, we’ll discuss how critical electricity characteristics evolve over time with state policies in place.

Capacity and generation

The grid in the South-Central and Southwestern US is projected to expand dramatically through 2035 in order to meet regional demand that grows by 22% above today’s levels. Solar and wind, two of the cheapest resources available to connect to the grid, comprise most capacity additions: solar contributes about 30% of new capacity through 2035 in both scenarios, while wind contributes 22-27% of new capacity (Figure 3). Combined cycle gas plants also deploy substantially, contributing 22% of additions in both scenarios and providing baseload power to balance the growth in variable renewables. Along with meeting load growth, these capacity additions replace 25 GW of aging coal plants as they become uneconomic and retire.

The states in this region have an opportunity to create a foothold for geothermal technologies during this next decade of large-scale grid expansion. Since nuclear technologies remain too expensive to deploy within this timeframe even with state-level tax credits in place, geothermal represents the primary clean, firm technology available to build in the region in the medium-term. We find that our modeled state-level policies drive meaningful geothermal deployment by 2035, with regional geothermal capacity increasing by 2 GW in the State Action scenario and 6 GW in the Enhanced State Action scenario (Figure 4). These levels of geothermal additions see the study region capturing 14-29% of national geothermal additions, a dramatic increase above the region’s current less than 1% share of national geothermal capacity.

Geothermal growth primarily displaces wind builds, because wind dominates regional additions in the early 2030s when EGS becomes available and starts to scale up. Comparing the Enhanced State Action scenario to the State Action scenario, 4 GW of additional geothermal deployment displaces 8 GW of wind additions. Since geothermal is a firm generating resource while wind is variable, each gigawatt of geothermal deployment displaces more than one gigawatt of wind, leading to lower overall grid capacity expansion in the Enhanced State Action scenario.

EGS is still early in its commercial-scale deployment, so every additional unit of built capacity pushes the entire technology another step towards larger-scale deployment. The additional 3.7 GW of in-region geothermal deployment spurred by Enhanced State Action over State Action policies increase the industry’s pace of learning, bringing down costs for all future geothermal plants and leading to 2 GW higher geothermal deployment in the rest of the country (Figure 4). Put another way, investments in geothermal in this region yield benefits for geothermal plants nationwide.

Capacity expansion also transforms the region’s generation mix, increasing zero-emitting generation shares from 43% today to 59-60% by 2035 (Figure 5). In the Enhanced State Action scenario, clean firm generation shares increase from 11% today to 13% in 2035, and geothermal surpasses coal in the generation mix. Geothermal generation driven by state policy meets 10-25% of regional demand growth by 2035.

Electricity prices and emissions

Beyond positioning the region as a geothermal powerhouse, state policies supporting geothermal can moderate rising electricity prices and reduce emissions. State policies supporting geothermal deployment lower electricity prices relative to a scenario without policy support. While the impact on prices is relatively small through 2035, the savings resulting from spending less on electricity bills add up meaningfully. State policies save industrial customers $500-700 million dollars from 2030 to 2035. Commercial customers, including data centers, see even bigger potential savings of $400 million to $1.1 billion over the same timeframe. Impacts continue to grow throughout the rest of the 2030s, with average annual savings of $200 million and $400 million for industrial and commercial customers, respectively. As mentioned above, this region is rapidly becoming a hotspot for energy-hungry industries like data centers that benefit from lower electricity prices. State policies that help mitigate price hikes can help sustain these industries and attract more investment down the line. Additionally, though market shocks like the current war in Iran are not captured in our modeling, geothermal electrons provide clean, firm power independent of the volatile fuel markets often responsible for driving major national and global cost uncertainty—potentially further amplifying the cost savings accruing to the region’s ratepayers.

Despite the region’s increase in electricity demand, these states are able to keep prices low while also reducing power sector CO2 emissions. In-region CO2 emissions decrease by 31-33% from today’s levels to 2035 as coal retires and zero-emitting generation shares increase. Regional geothermal incentives can see the technology achieve the crucial step of deploying next-generation geothermal across a wider range of geological settings in order to provide a validation suite, as proposed in the Pathways to Commercial Liftoff: Next-Generation Geothermal Power report.

Positioning this region as a geothermal turbine manufacturing hub

As discussed earlier, limited domestic manufacturing capacity and long international lead times for geothermal turbines present a major bottleneck for geothermal deployment in the US. However, this also creates a clear opportunity for the South-Central and Southwestern region to emerge as a geothermal turbine manufacturing hub. By combining incentives for in-region manufacturing with measures to accelerate geothermal deployment, state policy can play a decisive role here in shaping outcomes.

In the State Action scenario, average annual geothermal deployment on the grid between 2030 and 2035 is 0.3 GW in our study region and 2 GW nationally. To capture a range of potential manufacturing build-out outcomes, we apply both low and high growth rate assumptions, reflecting conservative and accelerated turbine manufacturing expansion scenarios. More details on these assumptions and the underlying methodology can be found in the manufacturing modeling section at the end of this report. By 2035, regional turbine manufacturing capacity reaches 0.2 GW in our low regional manufacturing scenario and 1.6 GW in our high regional manufacturing scenario (Figure 6).

In the Enhanced State Action scenario, a higher manufacturing credit combined with greater geothermal demand leads to increased levels of in-region manufacturing. The average annual geothermal deployment between 2030 and 2035 is 0.9 GW regionally and 3 GW nationally. By 2035, regional turbine manufacturing capacity reaches 0.9 GW in our low manufacturing scenario and 3.0 GW in our high manufacturing scenario.

In both of the high manufacturing scenarios, in-region manufacturing exceeds local demand, enabling the region to become an exporter of geothermal turbines to serve demand elsewhere in the country. These results demonstrate how a combination of state-level demand-side policies and manufacturing tax credit incentives could cement the South-Central and Southwestern US as the country’s manufacturing hub for this growing industry.

State policies lead to geothermal investment and jobs

As the energy system undergoes significant transformation over the coming decade, substantial economic opportunities will emerge across the South-Central and Southwest region. Rising load, retiring legacy grid assets, and sheer market economics will drive a huge change in the region’s power system—and beyond—over the next decade. Targeted support for geothermal deployment and manufacturing can help anchor these emerging industries in the region, translating into job creation and substantial private investment. In the following sections, we detail the private and public investment impacts, employment effects, and occupational opportunities of geothermal-focused state-level action.

Investment impacts

Over the next ten years, substantial capital will flow into this region’s energy system to meet the growing demand outlined above. Between 2026 and 2035, the region sees $163-168 billion in private and federal capital investment in the energy sector and associated industries under the two policy scenarios (Figure 7).2 Given the growing demand in the region, considerable investments will go towards expanding established energy industries, including wind, solar, natural gas, and storage.

With targeted policy interventions, states can help drive investment in advanced geothermal and establish the region as a hub for this industry. While the levels of investment into geothermal are small relative to other industries, they represent a substantial jumpstart to the emerging industry. In the State Action scenario, we see a total of $3.9 billion in federal and private capital invested in new geothermal capacity. The more favorable policies under the Enhanced State Action scenario crowd in almost three times the level of investment, totaling $11.4 billion. Geothermal remains eligible for technology-neutral federal clean electricity tax credits through the early 2030s, positioning this region to capture a meaningful share of federal funding. In the State Action scenario, this translates to $1.5 billion in federal investment flowing into the region, increasing to $4.3 billion under the Enhanced State Action scenario over the next decade. This boom in geothermal in the Enhanced State Action scenario results in a reshuffling of resources on the grid and related investment priorities over this window, most notably seen in 21% lower private and federal investment in wind ($11 billion) compared to the State Action scenario.

In both policy scenarios, there is also a shift in private capital investment for geothermal manufacturing. Although the Enhanced State Action scenario drives greater in-region geothermal manufacturing (as discussed in the manufacturing growth section above), states assume a slightly higher percentage of the cost to strengthen this incentive. As a result, total private capital is similar across scenarios, at roughly $1 billion. This analysis focuses specifically on the binary turbine manufacturing component of the geothermal supply chain. As such, these results likely represent a conservative estimate of the region’s total manufacturing investment opportunity, which could extend to broader supply chain elements such as oil and gas tubular goods and other related components.

Employment impacts

The large shifts in the power sector yield meaningful job impacts in the region as well. Across both scenarios, changes in the energy system are associated with an increase of 645,000 to 861,000 job-years between 2026 and 2035 (Figure 8). These gains underscore the potential for the energy transition to serve as a major driver of regional employment growth.

We break top-level job results out across two different dimensions. First, we classify results as project-level jobs or supply chain jobs. Project-level jobs are associated with direct inputs, including the construction, engineering, equipment, materials, and operating expenses of electricity generation facilities and the associated transmission and manufacturing build-out. Supply chain jobs refer to jobs associated with economic activity upstream of project-level jobs—for instance, jobs associated with transport and logistics, real estate, and component fabrication. About 60% of the jobs are project-level jobs, and the remaining 40% are supply chain jobs.

Within project-level and supply chain jobs, we further disaggregate jobs by project phase, between development and construction versus operations and maintenance (O&M). Development jobs are those associated with building energy generation facilities. O&M jobs are those required to operate and maintain these assets. Approximately 65% of these jobs are associated with development and 35% are associated with O&M. While development is typically more labor-intensive across most industries, this dynamic is especially pronounced in renewable energy, where ongoing operational requirements are relatively limited. The inclusion of non-renewable industries results in a more balanced distribution of jobs across project phases.

In both policy scenarios, examining employment impacts separated by technology largely mirrors the energy system capacity changes relative to today. Given the large capacity changes from today, solar, natural gas, wind, and storage account for almost 90% of the employment growth.

Zooming into geothermal-related results, in the Enhanced State Action scenario, stronger policy incentives for geothermal power and manufacturing are associated with 57,430 to 74,780 job-years—more than double the employment impact in the State Action scenario (Figure 9). This finding highlights the critical role of policy ambition in scaling geothermal workforce impacts, underscoring that more generous policies can lead to increased job opportunities in the sector.

Occupational analysis

Because this analysis focuses on policies aimed at expanding geothermal-related industries, we center our occupational analysis exclusively on geothermal power and manufacturing. To understand the workforce implications of this emerging field, we analyzed occupational shifts that occur in the State Action and Enhanced State Action scenarios as a result of geothermal power and geothermal manufacturing build-out. We find that there is meaningful growth in occupations associated with development and O&M, including those with transferable skillsets from other industries such as oil and gas.

Six occupational categories account for over 76% of total development occupations across both state action scenarios (Figure 10). Geothermal power development is the largest driver of occupations in the development phase. As a result, the occupational mix shown below more closely reflects the workforce profile associated with geothermal power development. Construction and installation workers represent the largest share of labor needs for geothermal development. This includes construction laborers, carpenters, electricians, and industrial machinery installation workers who build and install the specialized equipment and infrastructure required for geothermal facilities. Metal workers and assemblers encompass roles such as welders, machinists, and assembly mechanics who fabricate and assemble critical metal components used in geothermal systems, such as pipes, casings, and equipment housings. Drilling and rig workers include roustabouts, derrick and rotary drill operators, and rig transport personnel, who are vital for rig setup and carrying out drilling operations.

Many of the occupations in this category are already in high demand in the oil and gas industry, providing a strong pool of workers with transferable skills for geothermal development. In fact, four out of six of the top geothermal-related development occupations are also among the top six oil and gas development occupations.

The top six occupational categories associated with ongoing O&M for the geothermal industry account for over 80% of total O&M occupations in both state action scenarios (Figure 11). It’s important to keep in mind that the magnitudes underlying these occupational percentages are significantly smaller for O&M compared to the development phase. These results primarily reflect the large number of ongoing O&M occupations associated with geothermal power facilities. Metal workers and assemblers account for the largest share of O&M labor needs, and the category is primarily associated with machinists, welders, and tool operators who conduct repairs to power plant and wellfield equipment throughout the lifetime of the facility. Plant and system operators include power plant operators, distributors, and dispatchers tasked with ensuring the facility generates and distributes electricity to the grid as required. Engineers include mechanical, industrial, and electrical engineers who help to monitor plant performance and maintain key systems for the power plant and wellfield. Machinery installers, maintenance, and repairers include workers who maintain and repair industrial equipment such as pumps, turbines, and generators. Many O&M occupations demonstrate substantial overlap with those in the oil and gas industry, suggesting potential for workforce transferability. Five out of the six top geothermal-related O&M occupations are among the top six oil and gas O&M occupations—plant and system operators, engineering, machinery maintenance and repairers, construction trades occupations, and business operations.

Given the significant overlap in occupations between oil and gas and geothermal development, geothermal deployment opens new opportunities for a highly skilled workforce with minimal retraining requirements. This workforce alignment has important implications for economic development. Oil and gas jobs are typically associated with high wages, particularly for skilled technical and engineering roles. By broadening employment pathways into geothermal, this region can sustain high-quality job opportunities and stable household incomes.

Fiscal impacts

In addition to mobilizing private and federal investment and supporting geothermal employment, these policies also influence state fiscal outcomes. Consistent with the broader analysis, fiscal impacts are analyzed over a ten-year period from 2026 to 2035.

Regional investment in geothermal development drives increased state government revenue across multiple sources, including personal income taxes, corporate profits taxes, taxes on production and imports, and social insurance contributions.

Under the State Action scenario, geothermal power deployment and associated manufacturing activity generate approximately $151 million in additional gross state revenue between 2026 and 2035 (Figure 12). Under the Enhanced State Action scenario, these impacts more than double, resulting in $348 million in additional revenue over the same period.

These revenue gains are accompanied by fiscal costs to state governments, primarily in the form of foregone tax revenue associated with policy incentives. Over a ten-year period, total state costs are estimated at $1.6 billion under the State Action scenario and $3.7 billion under the Enhanced State Action scenario. Taken together, the fiscal impact to state governments is approximately $1.4 billion under the State Action scenario and $3.4 billion under the Enhanced State Action scenario.

While these are not insignificant numbers, these state outlays are extremely small relative to the overall budgets of states in this region. The enacted fiscal year 2026 annual budgets for these states total $194 billion. This total only represents state-fund appropriations and does not include any federal funding states receive. Thus, the annualized fiscal impact of these policies represents 0.07% of total current state spending in the State Action scenario and 0.18% of state spending in the Enhanced State Action case.

This analysis doesn’t provide individual state-level estimates of the fiscal impacts because the actual execution of these policies would be dependent on policy design choices that states make, as well as the heterogeneity of resources across the region. To provide a rough proxy of impacts for any given state, we allocated the regional cost of the policy package across each state on a GDP-weighted basis. The result is that the State Action scenario has a net state government revenue impact of 0.1% or less of each state’s total budget, and the Enhanced State Action scenario has an impact of less than 0.3%.

Across scenarios, these state-level costs are more than offset by the external capital they draw in. Each $1 of state investment yields $2.98 in private and federal investment for geothermal activity in the State Action scenario and $3.14 in the Enhanced State Action scenario.3

States can turn up the heat on geothermal

States in the South-Central and Southwest US are well-positioned to anchor a new electro-industrial cluster focused on next-generation geothermal deployment and manufacturing—and to derive substantial economic benefits from doing so. These states are already riding the wave of the electro-industrial transition, with meaningful electricity load growth and a burgeoning power grid working to keep up with that demand. Next-generation geothermal brings substantial value to this transition: advancement in drilling techniques and costs open wide swaths of this region to geothermal development, providing clean, firm, flexible power to the grid. The lack of availability of turbines to convert produced geothermal heat to electricity is currently a bottleneck to deployment, but this region can convert this bottleneck into an opportunity by becoming a turbine manufacturing powerhouse. In addition to building on in-region manufacturing know-how, deploying high levels of next-generation geothermal draws on another key characteristic of the region: huge oil and gas expertise, with directly transferable skills into drilling the wells needed for geothermal power production.

The upside to the region has the potential to be quite substantial. Between scaling up geothermal deployment from near-zero today to providing as much as 4% of total regional generation in 2035 and producing the turbines needed at these new facilities (plus the potential to produce for other parts of the country and the globe), the region can drive $5-12 billion in investment into the next-generation geothermal industry. What’s more, this investment can result in tens of thousands of high-quality jobs in the region—many of which leverage a huge oil and gas workforce already at home here.

Realizing this potential will require well-designed, targeted policy action from states. Pairing demand-side incentives for geothermal deployment with supply-side support for turbine manufacturing can unlock private investment and accelerate industry scale-up at a modest fiscal cost to state governments. With this policy framework in place, the region can capture the near-term benefits of geothermal growth while also establishing itself as a center of manufacturing and innovation within an in-demand clean energy industry. In short, states have the opportunity to shape regional economic prosperity and the trajectory of geothermal development nationwide.


Modeling approach

To estimate the impacts of these policies, we use a suite of modeling tools, including energy system impacts using our RHG-NEMS economy-wide model and resulting economic impacts using the IMPLAN input-output model. To focus on the achievable, medium-term impacts of these policies, we focus our analysis on the years 2026 through 2035. We analyze the impacts of these policies on the region as a whole rather than for individual states. Each state in the region has a unique mix of resources that make them well-suited for a particular suite of investments. The regional impacts we report should be understood as indicative of the opportunity available to each state, but state-specific policy plans should be developed with in-state stakeholders and in light of the most promising investment options.

Energy system modeling

We evaluate the impact of these policies on power sector dynamics, electricity prices, and emissions using RHG-NEMS, Rhodium Group’s US energy system model. We model two policy scenarios: a State Action policy scenario that includes state-level clean energy and manufacturing tax credits to the region; and an Enhanced State Action scenario that layers additional clean investment policy on top of the State Action scenario. Each of these scenarios also represents current policy at the federal and state levels, including the OBBBA updates to clean energy and vehicle tax credits and rollbacks of Biden-era regulations. To evaluate policy impact, we compare State Action and Enhanced State Action scenarios with today’s energy system. All policy scenarios adopt the assumptions of our Taking Stock 2025 mid-emissions case, which pairs moderate clean technology costs with baseline economic growth and central fossil fuel prices. For more details about our mid-emissions case and baseline policy assumptions, see our Taking Stock 2025 report.

Manufacturing modeling

Our manufacturing modeling analysis assumes a turbine size of 20 MW, which is larger than today’s industry average size but reflects what we expect to become a reasonable average-sized unit over the coming decade. To calculate manufacturing costs, we use National Laboratory of the Rockies cost data for manufacturing 5 MW binary turbines and apply industry-specific scaling factors to determine costs for 20 MW systems.4

For our in-region geothermal turbine manufacturing scenarios, we use historical megawatts of binary turbine manufacturing in the region as a baseline. Under the State Action scenario, the in-region geothermal manufacturing production tax credit is set proportional to the average amount of manufacturing costs covered for other energy industries (e.g., solar, storage) by the federal clean manufacturing production tax credit (often referred to by its section number, 45X) established under the Inflation Reduction Act (IRA). Correspondingly, we base our growth rate bounds on post-IRA manufacturing expansion trends observed in those other industries. In the Enhanced State Action scenario, we increase the policy incentives to cover the expected cost premium associated with manufacturing in the US relative to current international competitors. As a result, we assume the stronger demand signals and expanded manufacturing policy support incentivize more rapid growth in regional manufacturing capacity.

Economic impact modeling

Our economic impact analysis focuses on changes in private investment, employment, occupational opportunities, and fiscal impacts in the South-Central and Southwest region. We calculate the inputs to our economic model based on the results from the energy system and manufacturing modeling described above. For each technology, we develop inputs for key components of building new electricity-generating facilities based on current and projected in-region availability.

We input Rhodium’s cost data into IMPLAN—the economic input-output model—using its state-level tools to create a South-Central and Southwest region comprised of the seven states in focus. To account for uncertainty around where each project deploys in the region, we apply a range of jobs to capture state-by-state differences in the rate of employment per dollar invested. This captures differences in capital intensity and productivity across states.

Our employment estimates are reported in job-years, meaning one job for one year between 2026 and 2035. These numbers capture both on-site and off-site jobs supporting energy projects and manufacturing facilities. On-site jobs include construction labor to build the projects, while off-site jobs encompass activities such as equipment manufacturing or engineering performed elsewhere. Finally, we validated our findings against employment numbers found in literature and reported by existing projects.

Since our policy scenarios are aimed at boosting geothermal deployment, we focused our occupational analysis on geothermal generation and manufacturing jobs. We pulled occupational results from IMPLAN for development and O&M jobs and supplemented these outputs with Bureau of Labor Statistics data and industry insights. We do not consider supplier jobs in our occupational analysis.

We estimated fiscal impacts by analyzing changes in state revenues and expenditures between today’s levels and each policy scenario, using IMPLAN’s tax impact outputs for development and O&M activity. These revenues are estimates and should not be used for budget planning.


This nonpartisan, independent research was conducted with support from the New Energy Industrial Strategy (NEIS) Center in partnership with RMI. The results presented reflect the views of the authors and not necessarily those of the supporting organization.

Footnotes

Related content