Assessing the Costs and Benefits of Clean Electricity Tax Credits
An EPIC-Rhodium Group analysis finds that tax incentives to boost clean energy generation are among the most cost-effective climate policies and lead to some of the largest reductions in emissions.
The U.S. House of Representatives passed the Build Back Better Act in November 2021. If enacted, the Act will make unprecedented investments in climate change mitigation, including substantial changes to clean electricity tax credits. Building on previous modeling conducted by Rhodium Group, we analyze the costs and benefits of tax provisions similar to those passed by the House. These provisions reduce cumulative power sector carbon dioxide (CO2) emissions by 13-22% from 2022-2050, compared to a scenario without these policies. This corresponds to a 64-73% reduction in 2031 electric power emissions below 2005 levels.
We find that the benefits of the clean electricity tax credits are roughly 3-4 times greater than the costs[1]. Cumulatively, the benefits from the policies range from $335 billion to $1.8 trillion, while the costs range from $130 billion to $309 billion[2]. On a per ton basis, the tax credits will reduce CO2 emissions at a cost of roughly $33-$50 per ton. These costs are less than estimates of the damages from the release of an additional ton of CO2, i.e. the social cost of carbon (SCC), and are substantially less expensive than most current policies to reduce CO2 emissions. These benefits only account for reductions in CO2 emissions and do not include any co-benefits from reductions in conventional air pollution emissions, which would likely further improve cost effectiveness.
Build Back Better’s Clean Electricity Tax Credits
On November 19, 2021, the U.S. House of Representatives passed the Build Back Better Act [3] (BBB), a broad, $2.2 trillion piece of legislation that includes major investments in climate change, as well as health care, education, and the social safety net. The bill is currently under consideration in the U.S. Senate.
Included among the bill’s $550 billion [4] in climate change funding are several provisions critical to accelerating clean energy deployment in the United States. The bill extends and expands production tax credits (PTC) and investment tax credits (ITC) for zero-emitting generators. The bill provides a credit of up to 2.5 cents per kilowatt-hour (kWh) or up to 30% of qualified investment costs for new clean electricity generating facilities that meet apprenticeship and prevailing wage requirements. It does so first as an extension of existing PTC and ITC statutes through 2026 and then under a new clean electricity PTC and ITC thereafter (until predetermined emission reduction thresholds are met). Under a new zero-emission nuclear power PTC, the bill separately provides up to 1.5 cents/kWh to help existing nuclear plants stay online, scaled by the revenue of those plants. If they meet certain domestic content requirements, developers can take these tax credits via a direct pay mechanism. Direct pay eliminates the need to partner with tax equity investors, removing financing bottlenecks that would otherwise slow clean energy deployment.
Rhodium Group released [5] “Pathways to Build Back Better: Maximizing Clean Energy Tax Credits” in June 2021, which models several changes to tax policy similar to those proposed under BBB. Specifically, the report modeled a 2.5 cents/kWh PTC and 30% ITC available to new zero-emitting generating resources available through 2031, as well as a provision to retain existing nuclear generators without an announced retirement date. Though the modeled policies do not precisely align with the House-passed language, they are a reasonable proxy for the emissions impacts and costs of the provisions within BBB. Notably, the modeled policies do not include the extension of the ITC to grid storage and transmission projects, deadline extensions for residential and commercial distributed solar ITCs, or changes to the carbon capture tax credits in section 45(Q), so these policies are outside the scope of this analysis. In “Pathways to Paris: A Policy Assessment of the 2030 US Climate Target,” Rhodium Group modeled the effects of this more expansive set of power sector tax credits, plus federal executive and state actions, and found still more opportunities for emission abatement, including beneficial interactions between tax policy and other decarbonization policies.
Method
Cost-benefit analyses compare the sum of potential benefits for a given policy against the associated costs, allowing for an economic assessment of policies. In our cost-benefit analysis of the modeled clean energy tax credits, we measure the benefits from projected reductions in CO2 emissions. On the cost side, we account for projected increases in power system costs and the costs of raising government revenue to fund the tax credits. We then apply a discount rate to determine the present value of the policy’s costs and benefits. To measure the dollar value of the policy’s benefits, we apply estimates of the social cost of carbon (SCC), the monetized damages of an additional metric ton of CO2, to the projected emissions reductions calculated by Rhodium Group. Thus, we calculate the gross benefits of the tax incentives as the present value of the product of reduction in CO2 emissions and the SCC.
We run three scenarios with different values of the SCC. The Biden Administration set an interim value [6] of the SCC of $51 for 2020, which is a carryover from the Obama Administration. It is widely believed to be too low [7] , but we nevertheless monetize benefits at this value. The State of New York updated the Obama numbers based on changes in international capital markets to $121 per metric ton[8] of CO2 for 2020 and uses it for setting state policies. Therefore, we assess benefits at this value. Finally, we assess the benefits at $250[9] per ton of CO2, which is a ballpark estimate of the effects of updating the SCC to reflect recent research that finds that climate damages are larger than previously understood.
To measure the policy’s costs, we use Rhodium Group’s estimates of total electric power system costs, inclusive of private sector costs and increased fiscal cost to the federal government. There is an increase in overall system costs when including both private and public expenditures as the tax credits are not precisely calibrated to pay for the incremental difference between the clean technology they are incenting and the incumbent fossil technologies they are meant to displace in the dispatch stack. Though private costs to utilities and clean energy developers decrease, the overall system costs increase owing to this inefficiency.
The Rhodium Group cost estimates include two scenarios[10]: a low cost scenario and a central cost scenario. These pathways reflect a range of cost and performance estimates for electric generating technologies from the National Renewable Energy Laboratory’s Annual Technology Baseline as well as additional research conducted by Rhodium Group.[11]
Moreover, we account for the cost of taxes levied to finance the policy. A well-studied phenomenon in economics is that taxes can reduce total economic production by distorting incentives in the market. For example, increasing corporate profit taxes may cause businesses to relocate their production to other countries with lower tax rates. Using a standard value from the literature, we assume that the cost of such distortions is 40%[12] of the total revenue raised.
Though tax incentives phase out in 2031, the costs and benefits of the policies are spread out over the next 30 years. We calculate the present value of the costs and benefits at discount rates of 2%, 3%, and 5%. The 3%[13] figure has been used historically to represent the riskless real interest rate, however, the 2%[14] value better reflects changes in international capital markets over the last several decades. The 5% discount rate is also commonly used to conduct cost-benefit analyses. We treat the 2% discount rate as the base case.
The Benefits of Clean Energy Tax Incentives
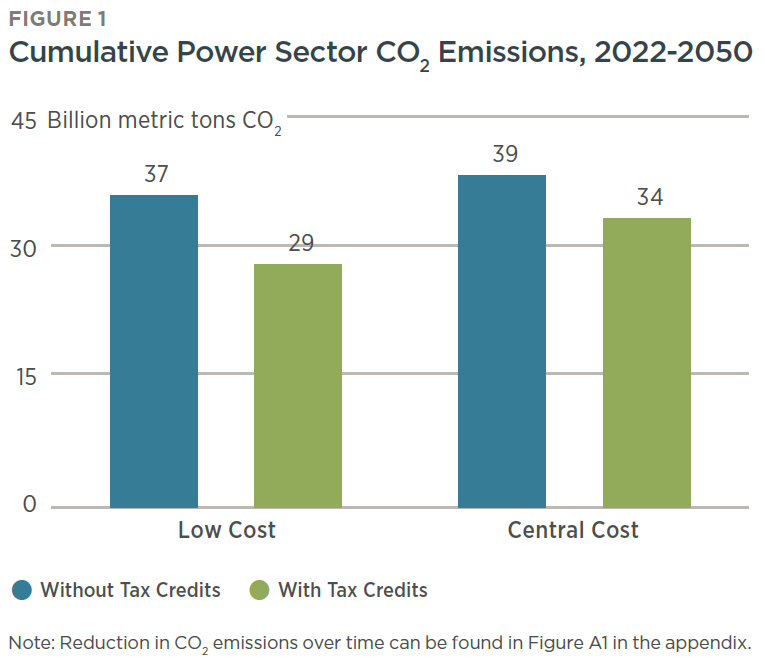
The tax incentives lead to large reductions in CO2 emissions in both technology scenarios. Figure 1 plots cumulative emissions with and without the tax credits from 2022 through 2050. The cumulative reduction in CO2 emissions under the low and central clean energy technology cost pathways are 8.1 billion metric tons and 5.1 billion metric tons, respectively. This represents a 13-22% reduction in emissions, relative to a scenario without tax credits. At peak, the tax credits reduce CO2 emissions by 33-45% in the power sector in 2031, relative to a baseline without those investments. This corresponds to a 64-73% reduction in 2031 electric power emissions below 2005 levels.
The monetary benefits of these CO2 emissions reductions are substantial. Figure 2 reports the gross benefits for the two technology scenarios at the three SCC estimates. The benefits range from $335 billion to $1.2 trillion in the central cost pathway and from $554 billion to $1.8 trillion[15] in the low cost pathway.
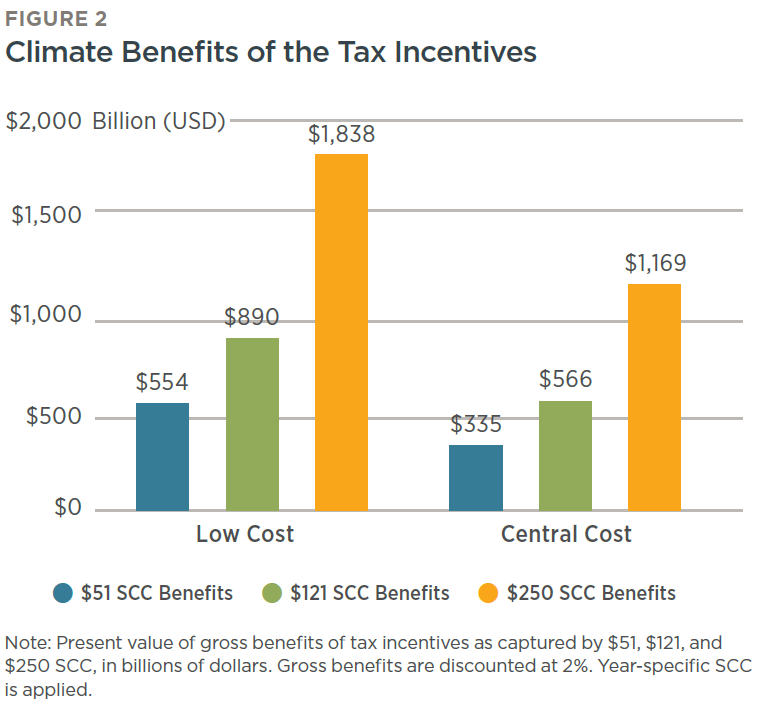
It is noteworthy that the estimates of the gross benefits are likely to be conservative. Specifically, they understate the full benefits because they do not account for any co-benefits[16] from reductions in conventional air pollution emissions, like particulate matter and sulfur dioxide.
The Costs of Clean Energy Tax Incentives Are Less than the Benefits
The tax incentives have two costs: increased overall costs to the electric power system (including private and public expenditures) and a deadweight loss owing to reductions in economic efficiency due to taxes levied by the federal government to pay for the policies. Figure 3 plots the present value of these costs, which range from $309 billion in the low cost case to $130 billion in the central cost case.[17] More clean energy is deployed in the low cost pathway relative to the central cost pathway, thus the economic costs are higher in that case (as are the emission reductions). On an annual basis, these costs peak in 2031, the year that the modeled tax credits expire, as developers rush to take advantage of the credits. In the subsequent years, the costs reflect the continuing higher costs for operating the electric power system and tax expenditure costs for the remaining PTC payments. These costs decline as the increasing numbers of projects reach the end of the ten-year payment period of the PTC.
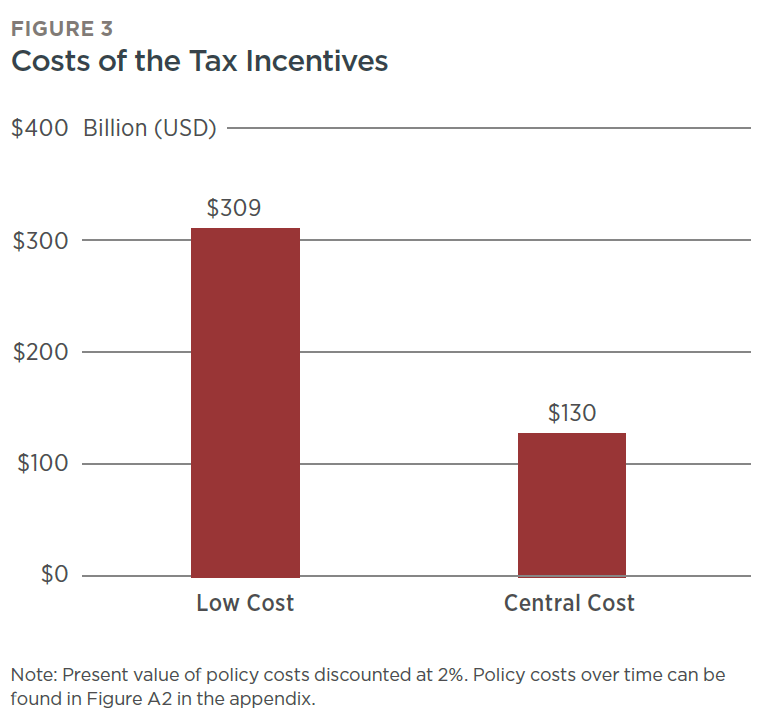
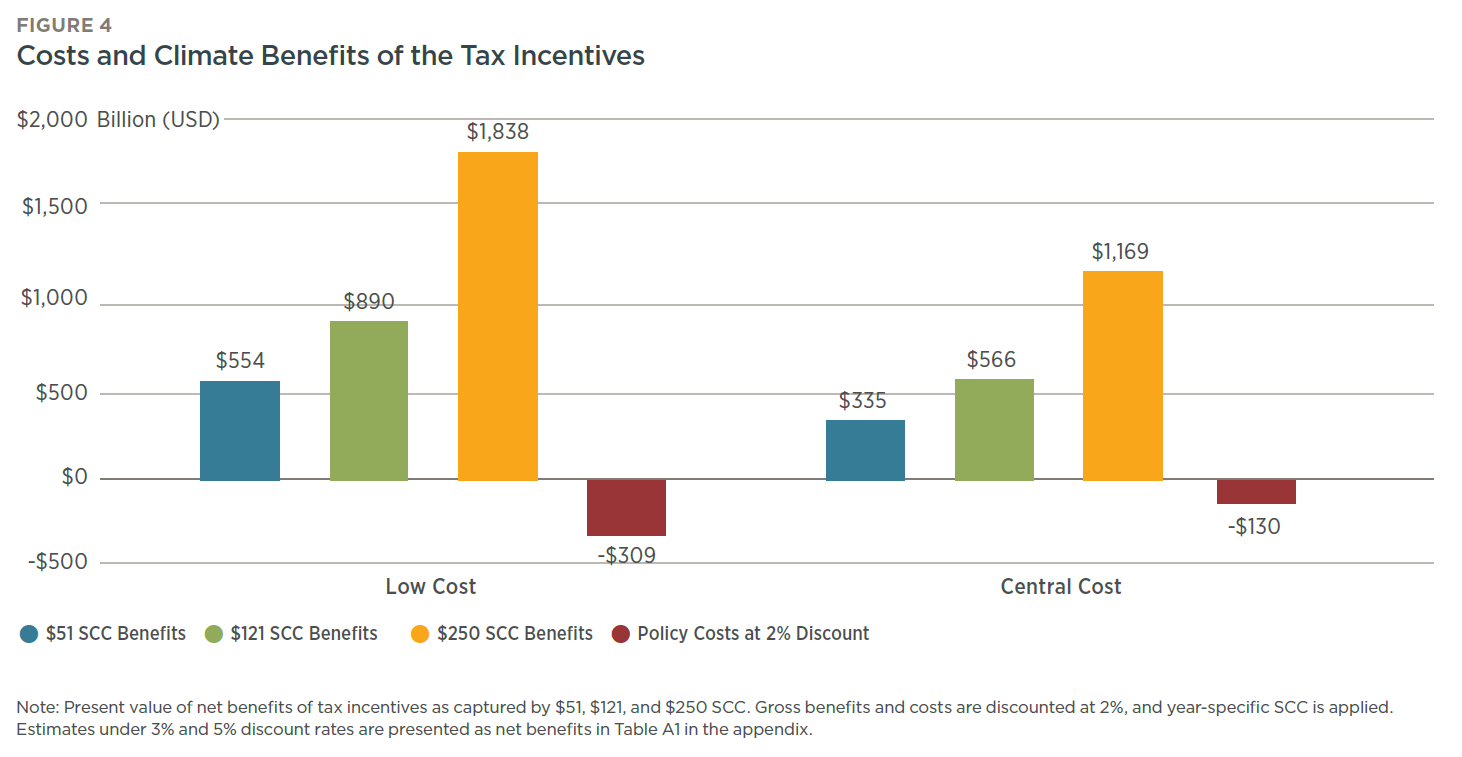
Figure 4 plots the present value of the benefits (as seen in Figure 2) along with the costs of the clean energy tax incentives under the two technology cost scenarios and for the three estimates of the SCC. Under the low technology cost scenario, the net benefits range from $245 billion to $1.5 trillion, while they range from $205 billion to $1 trillion with the central technology cost scenario.[18] The most striking feature of these results is that the benefits significantly outweigh the costs in all scenarios. With a $121 SCC[19], the ratio of the benefits to costs is 3:1 in the low technology case and 4:1 in the central technology case.[20]
Clean Energy Tax Incentives Deliver Inexpensive Reductions in CO2
Policymakers often compare the effectiveness of policy options to address climate change in terms of dollars per ton of CO2 abated. With the central discount rate of 2%, the clean energy tax incentives are projected to reduce CO2 emissions at a cost of $33-$50 per ton[21], with the range determined by the technology cost scenario. These values are on par with or lower than the values of the SCC used in this memo. In other words, the tax incentives reduce emissions at a lower cost than the estimated damages from the emissions per ton.
The clean energy tax incentives cost much less to reduce a ton of CO2 compared to many other climate policies. Figure 5 compares the tax incentives to a wide range of existing United States climate policies and is adapted from the “U.S. Energy & Climate Roadmap” by the Energy Policy Institute[22] at the University of Chicago (EPIC). The red range represents the tax incentives’ projected range of costs per ton of CO2 abated, while the other policies’ costs per ton are denoted with black ranges. The blue, green, and yellow vertical lines at $51, $121, and $250 denote the SCC values used in this report.
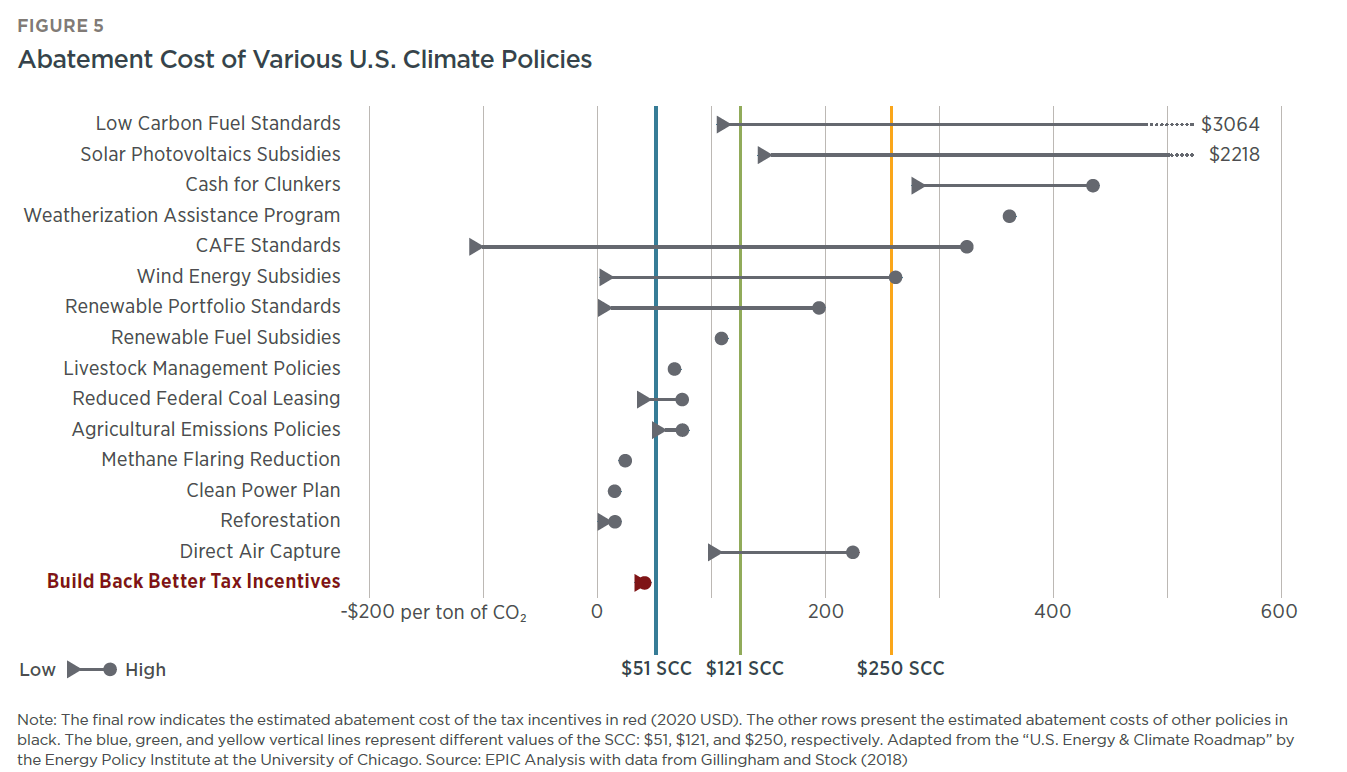
There are at least two critical points that come out of Figure 5. First, these tax incentives not only have benefits that exceed costs, but they are less expensive, substantially so in most cases, than almost all significant existing carbon policies. Second, most of the other policies represented cover relatively small parts of the economy, so they produce only modest reductions in CO2 emissions. In contrast, the clean energy tax incentives cover the entire electricity sector, which is the second largest source of emissions, and are projected to reduce that sector’s emissions by 33-45% in 2031 relative to a baseline scenario without these tax credits.
Conclusion
While the fate of Build Back Better is in the hands of the Senate, deliberations will in part focus on whether the extended and expanded clean energy tax credits merit inclusion in the final bill. Across a wide range of potential assumptions, we find that their projected benefits greatly exceed their projected costs. Additionally, on a cost per ton of CO2 abated basis, they tend to deliver greater carbon abatement bang for the buck than many other climate policies in place or under discussion in Congress and elsewhere. While tax credits are typically not considered a “first best policy,” such as pricing carbon emissions with a tax or targeting them with a cap-and-trade program, they have the potential to make substantial progress in decarbonizing the electric power sector while generating significant net-benefits to society.
[1] Under 2% discount rate and $121 social cost of carbon (see below). For 2% discount rate in general, multiples range from 2:1 ($51 SCC; low cost scenario) to 8.1:1 ($250 SCC; central cost scenario).
[2] Using 2% discount rate (see below). Numbers presented in 2020 USD.
[3] U.S. House of Representatives, “Build Back Better Act.” (H.R.5376).
[4] House Committee on the Budget, “The Build Back Better Act.”
[5] Larsen et al., “Pathway to Build Back Better: Maximizing Clean Energy Tax Credits”
[6] Interagency Working Group, “Technical Support Document.”
[7] Carleton and Greenstone, “Updating the United States Government’s Social Cost of Carbon.”
[8] New York State Department of Environmental Conservation. “Climate
Change Guidance Documents.”
[9] The SCC grows over time, consistent with empirical findings. For the $250 value, we use the SCC growth rates from the SCC estimation of $121 by NYDEC (2021). For the $51 value, we follow the United State Government’s time path, see Interagency Working Group (2021).
[10] Larsen, et al., “Taking Stock 2020: The COVID-19 Edition.”
[11] See the “Taking Stock 2020: Technical Appendix” for further detail. A short summary of the two pathways is summarized in the appendix.
[12] Finkelstein and Hendren “Welfare Analysis Meets Causal Inference.”
[13] OMB, “Circular A-4.”
[14] Greenstone and Stock, “The Right Discount Rate for Regulatory Costs and Benefits.”
[15] Gross benefits assuming 2% discount rate
[16] Lee and Greenstone, “Air Quality Life Index Annual Update.”
[17] Assuming 2% discount rate. Under 3% discount rate, these costs are $270 billion in the low cost case, and $116 billion in the central cost case. Similarly, under 5% discount rate, costs are $208 billion in the low cost case, and $94 billion in the central cost case.
[18] Net benefits assuming 2% discount rate. Net benefits under 3% and 5% discount rate, as well as central estimates for each discount rate, are presented in Table A1 in the appendix.
[19] Under $51 SCC, the ratio of the benefits to costs is 2:1 in low cost scenario and 3:1 in central cost scenario. Similarly, under $250 SCC, the ratio is 6:1 in low cost scenario and 9:1 in central cost scenario, assuming 2% discount rate.
[20] Using 2% discount rate. Under both 3% and 5% discount rates instead, the benefits to costs ratio is 1:1, 3:1 and 6:1 in low cost scenario under $51, $121, and $250 SCC, respectively, and 2:1, 4:1, and 9:1 in central cost scenario under $51, $121, and $250 SCC, respectively.
[21] Abatement costs per ton are calculated using discounted metric tons of CO2 to make estimations comparable. If undiscounted tons of CO2 are used instead, the abatement costs are lower than presented.
[22] EPIC, “U.S. Energy & Climate Roadmap.”
This note was written in collaboration with the Energy Policy Institute at the University of Chicago.