Pathways to Build Back Better: Jobs from Investing in Clean Electricity
One of the primary goals of President Biden's American Jobs Plan is to create millions of new jobs through new federal investments in clean infrastructure. This note focuses on the electric power sector.
One of the primary goals of President Biden’s American Jobs Plan is to create millions of new jobs through new federal investments in clean infrastructure. This note focuses on the electric power sector and assesses job creation and retention potential associated with a substantial clean energy investment package. We find that investments in decarbonizing electricity on net can create more than 600,000 jobs a year on average over the timeframe of 2022-2031. We find that the jobs created or retained in clean generation far outweigh jobs lost at fossil fuel-fired power plants and upstream fuel supply.
Investing in a clean future
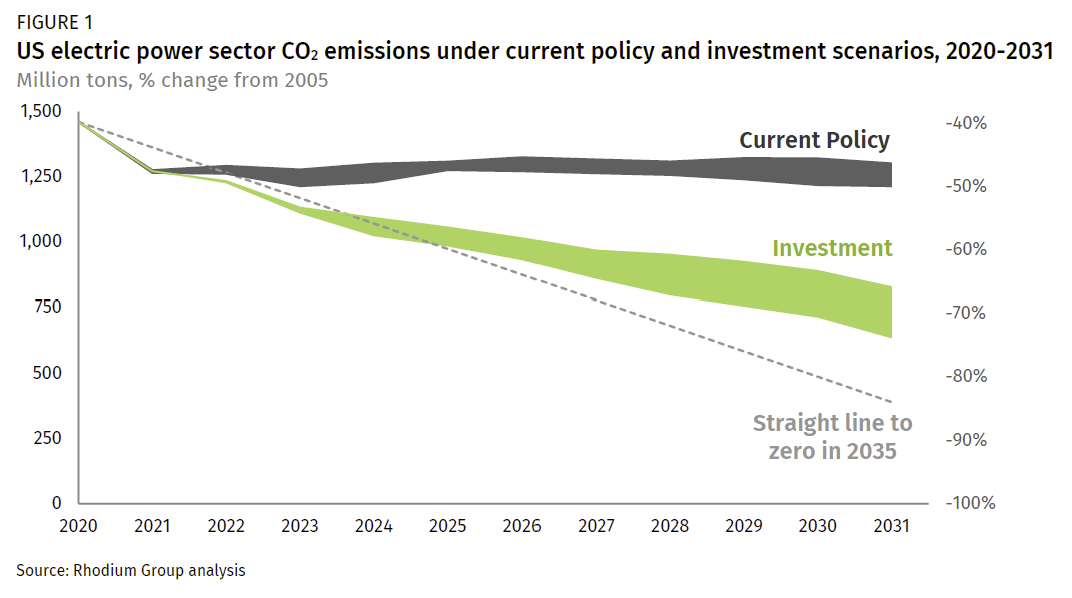
President Biden’s American Jobs Plan (AJP) includes a series of new programs and extensions of tax credits to drive investment in new clean electricity infrastructure. The core of the plan is a Clean Electric Standard (CES) coupled with a long-term extension of renewable tax incentives and new tax credits for storage and transmission. Meanwhile, members of Congress are considering their options for clean electricity investment policies and procedural pathways for passing legislation. We previously assessed the impact of an investment package consisting solely of tax credits and incentives to expand new clean generation, retain existing clean capacity and accelerate coal retirements. That research found that the federal spending package on its own could get electric power sector emissions on a straight-line path to zero in 2035, at least through 2025. In 2031, the package drives emissions down to 66-74% below 2005 levels depending on the costs of clean energy technologies (Figure 1). EPA regulations on CO2 and conventional pollutants deliver further gains.
In this note, we take the next step and quantify the employment impact of our investment scenario. With 9 million Americans still out of work 14 months into the COVID-19 pandemic, understanding if and how new clean energy investments can get people back to work is critical. While our investment scenario is not identical to the clean electricity provisions in the AJP, it is directionally consistent. Our investment scenario also reflects recent legislative proposals, including the Clean Energy for America Act and the American Nuclear Infrastructure Act. While it’s too early to know the contents of a congressional clean electricity infrastructure package, we think that the investment scenario is a decent proxy for what potentially is yet to come. It is also a good foundation for assessing the job impacts of clean electricity investment overall.
A clean infrastructure investment transition
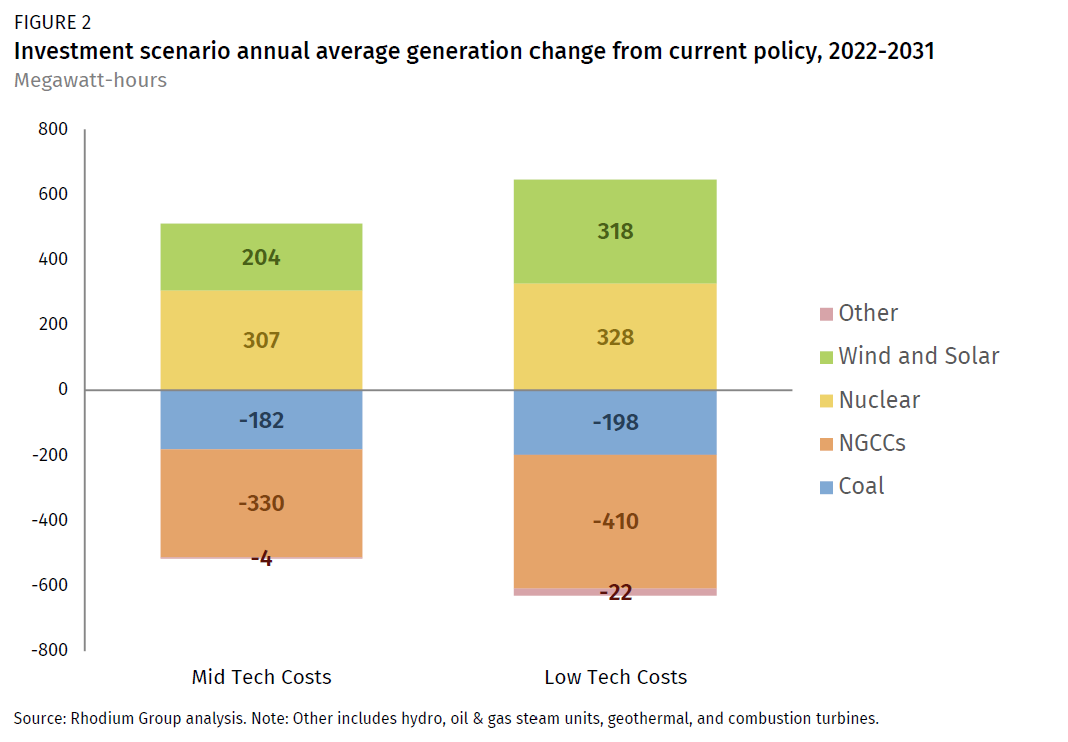
As we discussed in our previous note, federal investment can drive new clean capacity additions onto the grid at an annual average rate up to twice as fast as last year’s record. Investment also retains existing clean generators such as nuclear plants that would otherwise retire due to competition with cheap natural gas. The net impact is a surge of zero-emitting generation onto the grid over the next decade at the expense of coal and natural gas. In our analysis, on an annual average basis over the 2022-2031 budget window, every 3 megawatt-hours (MWh) of additional clean generation from investment displaces roughly 2 MWh of natural gas combined cycle (NGCC) generation and 1 MWh of coal. This leads to 307-328 MWh of additional nuclear generation and 204-318 MWH of wind and solar compared to current policy (Figure 2). The range reflects mid and low technology costs. Meanwhile, coal declines by 182-198 MWh, and NGCCs ramp down by 330-420 MWh on an annual average basis.
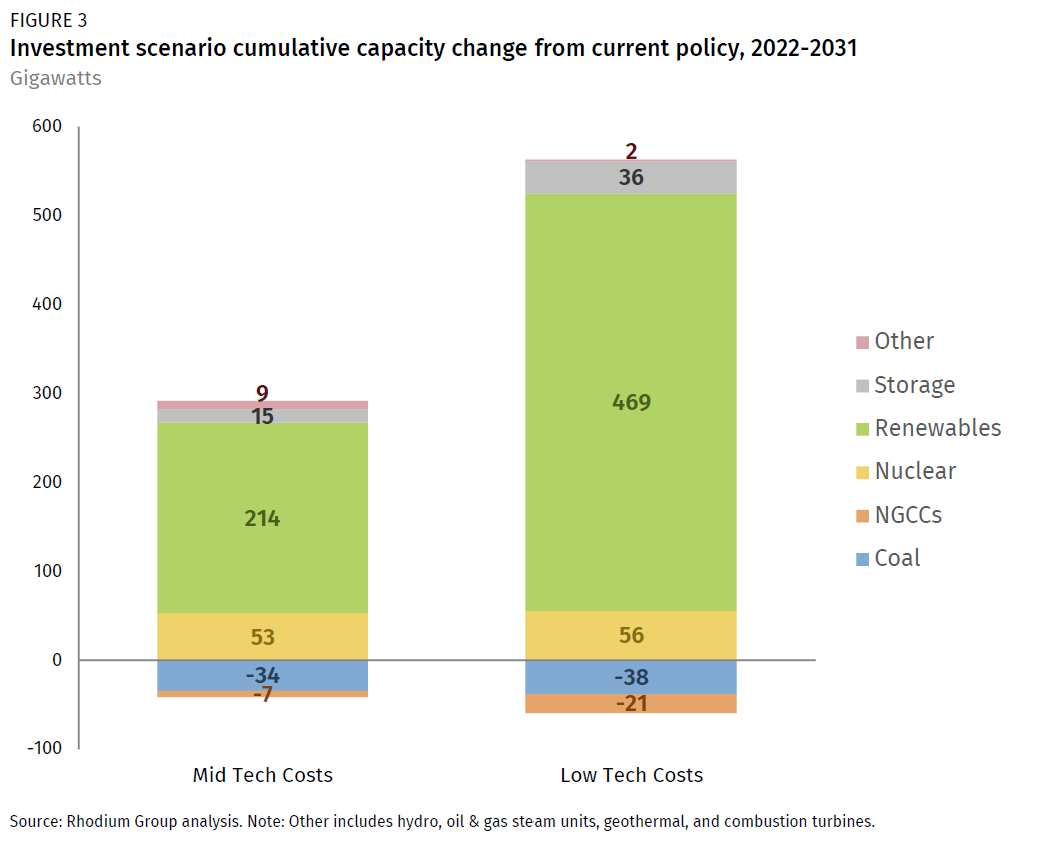
Reductions in fossil generation directly impact jobs both at the power plants generating electricity and at the coal mines and gas fields where the power plant fuel comes from, and in the transportation of those fuels to generation sites. The main driver of jobs associated with clean energy is the number of gigawatts (GW) of retained and new capacity built in response to federal investment. Think workers running nuclear plants and crews building record amounts of wind, solar, and storage over the next decade across the US. On a cumulative capacity basis, retained and new clean capacity dwarf the decline of fossil capacity (Figure 3). Under mid tech costs, clean capacity additions and retentions are 6.5X greater than fossil subtractions. This grows to nearly 9X when we consider low tech costs.
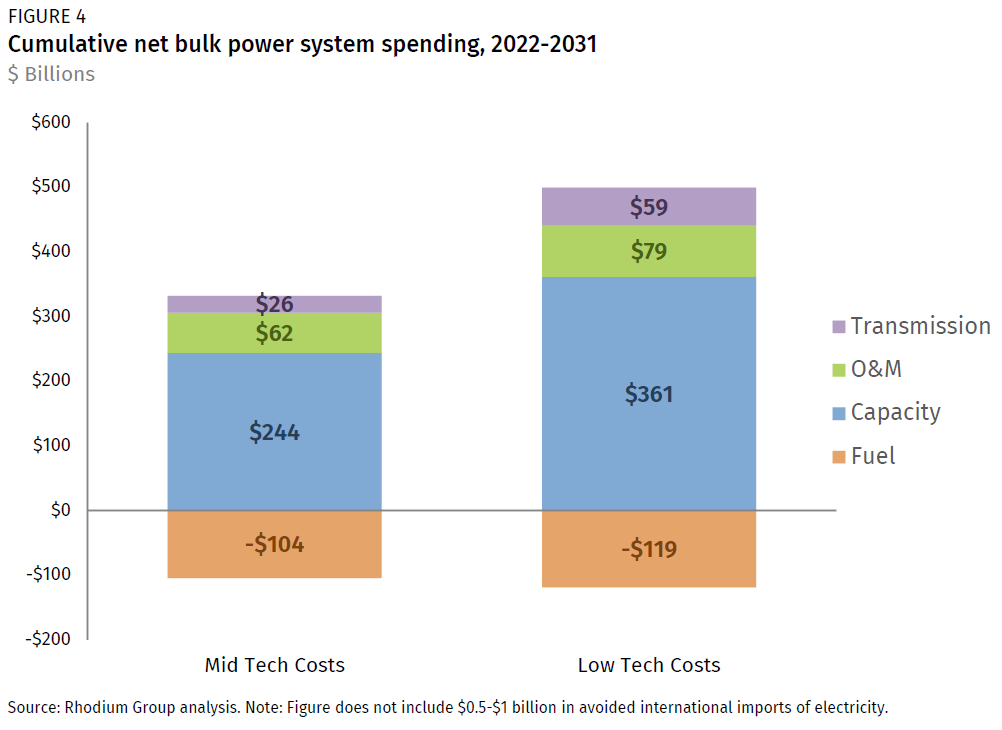
All of the new clean capacity additions and clean capacity retention reflect private investment into US clean energy infrastructure leveraged by federal spending. We estimate that federal spending catalyzes $332-$399 billion in net new investment in the bulk power system from 2022 through 2031. The investments consist of $244-$361 billion for new and retained capacity, plus another $26-$59 billion in transmission and $62-$79 in net new spending on operation and maintenance of generators (Figure 4). Meanwhile, switching the grid from fossil to clean results in $104-$119 billion in savings from avoided fuel costs. While this represents savings for consumers, it also reflects fewer work opportunities for coal miners, gas drillers, and fossil power plant operators.
The employment implications of federal electricity investment
To assess what new federally driven spending on electricity infrastructure and clean energy deployment means for jobs, we developed an employment projection model calibrated to the Energy Futures Initiative and NASEO’s annual US Energy and Employment Report. This survey identifies total annual employment in both electricity generation and fuel supply, broken down by technology and sector. We identify employment intensity trends in all generation technologies over the past five years (including solar, wind, geothermal, nuclear, coal, natural gas, oil, geothermal, hydro, and biomass), as well as all fuel supply and transportation categories and transmission investment by comparing historical employment survey data from the US Energy and Employment Report with historical energy data from the Energy Information Administration (EIA). We then apply these historical relationships to projected changes in electricity capacity additions, retirements, transmission buildout, and fuel supply from RHG-NEMS, a detailed energy system model used to produce the generation, capacity, and investment results described above.
We find that in our investment scenario, net national employment in power generation, upstream fuel supply, and downstream transmission is 290,000 jobs higher on average between 2022-2031 in our mid technology cost case and 606,000 jobs higher in our low technology cost case than under current policy over the same period (Figure 5). That’s 2.9 and 6.1 million job-years respectively. In our mid technology cost case, coal mining and transportation jobs are 14,000 and coal generation jobs are 11,000 lower in the investment scenario than in the current policy counterfactual. Natural gas production and transportation jobs are 31,000 lower and generation jobs are 3,600 lower (oil-related jobs are relatively unchanged due to the small amount of oil used for power generation in the U.S.) These losses in fossil fuel employment are dwarfed by gains in nuclear and renewable generation, battery storage and transmission. 26,000 jobs are saved at currently operating nuclear plants and 278,000 jobs are gained through the manufacture, installation and operation of new wind, solar, geothermal and other renewable energy sources. Jobs associated with building and operating transmission lines and battery storage are 33,000 and 11,000 higher respectively on average between 2022 and 2031 in our investment scenario than under current policy.
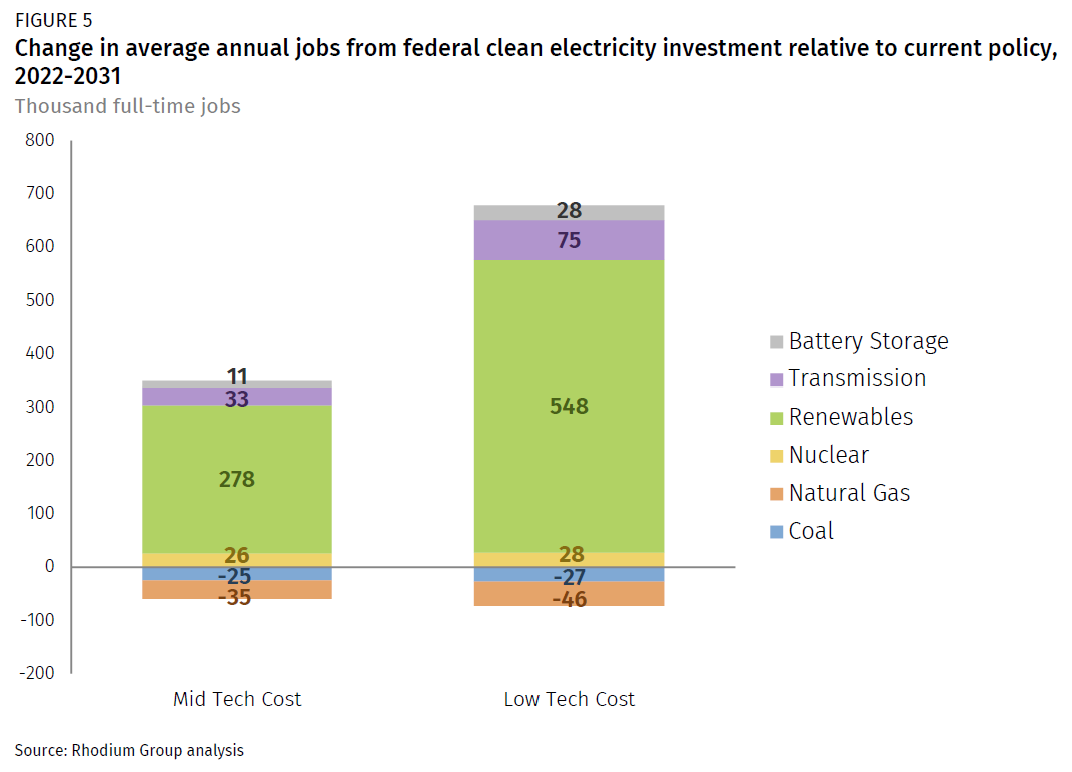
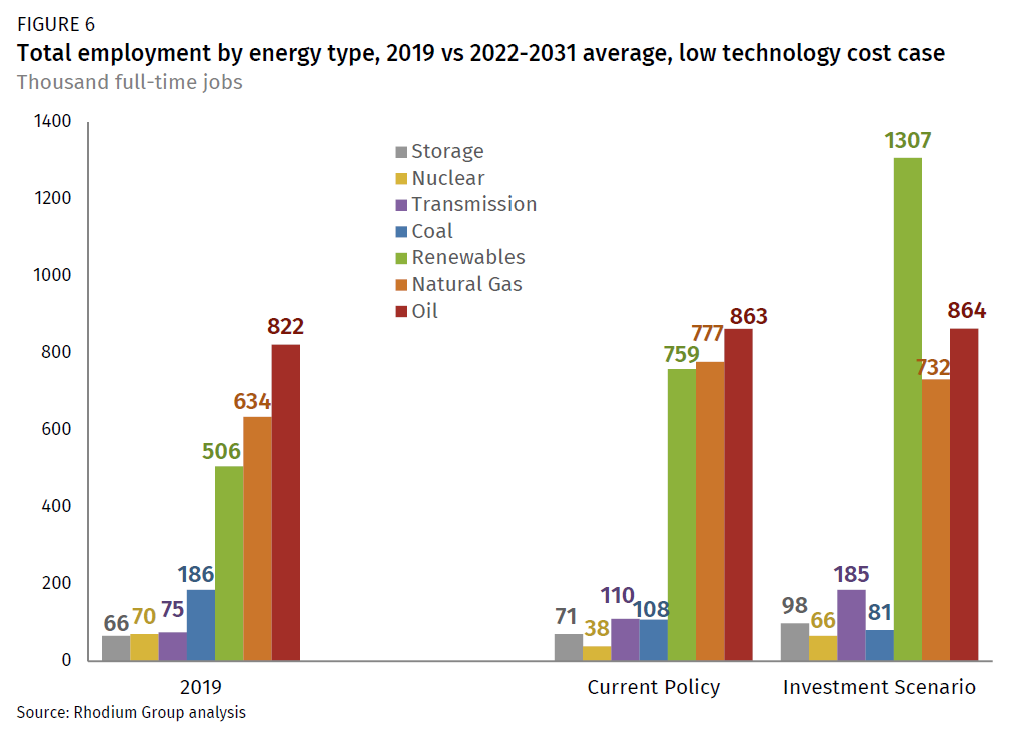
In our low technology cost case, coal employment (mining, transportation and power generation) is 27,000 jobs lower and natural gas employment (production, transportation and power generation) is 46,000 jobs lower on average between 2022 and 2031 as a result of federal clean electricity investment than under current policy. But the job gains in clean generation, storage and transmission are more than 8x larger than those lost in fossil generation and upstream fuel supply. Renewable electricity-related jobs are 548,000 higher on average between 2022 and 2031. Transmission jobs are 75,000 higher and battery storage jobs are 28,000 higher. All told, we project 1.7 million Americans on average would be working in the manufacture, installation and production of clean electricity between 2022 and 2031 (Figure 6). That’s nearly 1 million more than work in these fields today, and 679,000 more than would be employed under current policy over that same time period. In our investment scenario, clean electricity would employs as many people between 2022 and 2031 in the US as all fossil fuel production, transportation, distribution and generation combined.
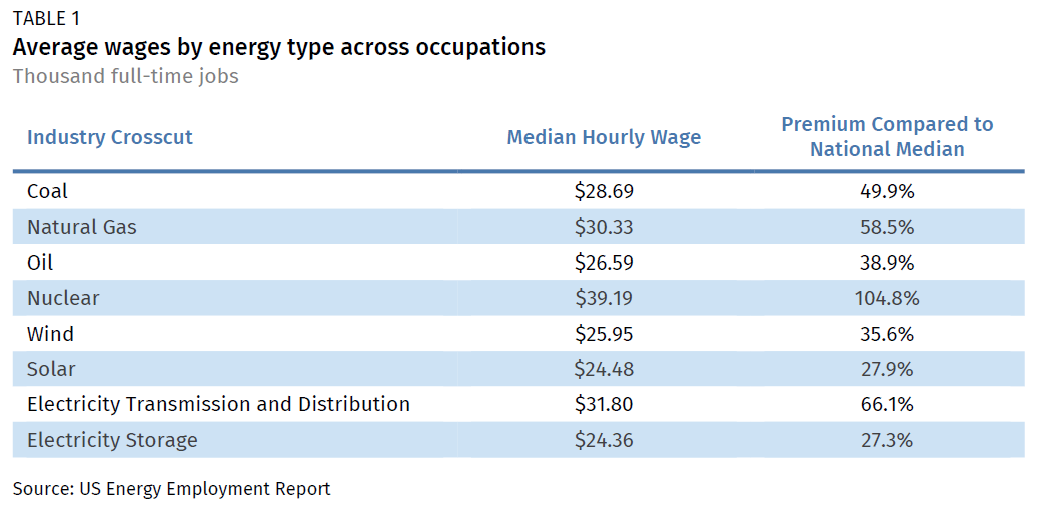
A core promise of the AJP is not just creating jobs but creating “good-paying union jobs.” How do the clean electricity jobs a federal investment package would create fare on this metric? A new US Energy and Employment Report provides national survey data on current average wages across all occupations associated with different energy sources (Table 1). Unfortunately, there is not the same kind of comprehensive survey data on unionization rates. The US Energy and Employment Report recommends the federal government start collecting and publishing these data going forward.
Across all energy types, median hourly wages are considerably higher than the national median wage. Workers in nuclear power and electricity transmission and distribution earn the most—105% and 66% more than the national median, respectively. In our investment scenario there are 49,000 more jobs on average in these areas combined between 2022 and 2031 in our mid technology cost case, and 103,000 more in our low technology cost case. Coal and natural gas jobs, both of which decline in our investment scenario relative to a current policy counterfactual pay 50% and 59% more than the national median respectively. Median wages for wind, solar and storage jobs, all of which grow considerably in our analysis, are 36%, 28%, and 27% higher than the national median.
It’s worth noting that while the majority of current solar jobs are associated with rooftop solar and other distributed applications, the majority of additional solar capacity built in our investment scenario is utility-scale solar serving the bulk power system. Utility-scale solar is less labor intensive than distributed solar, so this feature of our modeling significantly reduces projected job gains compared to a future where the current split between utility-scale and distributed solar remained constant. But utility-scale solar-related jobs also tend to pay more and are more likely to be unionized, so we would expect the median wage associated with the renewable energy jobs created as a result of the plan to be higher than Table 1 suggests. The inclusion of prevailing wage, project labor agreement (PLA) or other job quality requirements in a federal infrastructure package, as some in Congress are considering, would further increase future wages in renewable energy-related professions.
While the increase in clean generation jobs we project in our analysis far outweighs declines in fossil generation jobs and associated fuel supply, Congress can take additional steps to mitigate the impact of those job declines—particularly for coal communities. In our investment scenario, total natural gas-related employment still grows relative to 2019 levels, just less than it would under current policy. Oil-related employment stays relatively flat. Coal-related employment, which has been declining for decades, continues to fall sharply under current policy due to already announced and projected coal power plant retirements. Average annual employment between 2022 and 2031 is 42% lower than 2019 levels in our low technology cost case. In our investment scenario this grows to 56%. There will be some opportunities for coal mine, transport and power plant workers to find employment in renewable energy, nuclear, transmission, storage, or in carbon capture and sequestration (which is not the focus of this analysis but a likely additional area of infrastructure investment with substantial economic and employment benefits). But investments as part of a federal infrastructure package can also help diversify the economic and employment base of coal communities beyond energy and create new pathways to economic growth and prosperity.
Conclusion
It’s still unclear whether a clean energy infrastructure investment package will make it through Congress, and if it does, what it will include. What is clear from our analysis is that an ambitious effort to invest in decarbonizing the electric system will, on net, create and retain far more jobs in clean generation than will be lost in fossil fuel generation and associated fuel supply. These can be well-paid, high-quality jobs, particularly if an infrastructure investment package includes labor standards and support for coal communities. If one of the goals of an infrastructure package is to get Americans back to work after a pandemic-induced recession, robust investment in the electric power sector is a solid place to start.
This nonpartisan, independent research was conducted with support from Bloomberg Philanthropies, ClimateWorks Foundation, the Heising-Simons Foundation, and the William and Flora Hewlett Foundation. The results presented in this report reflect the views of the authors and not necessarily those of supporting organizations.
Related Research: Pathways to Build Back Better – Investing in 100% Clean Electricity