China’s State Investment Surge: Stimulus or Statistics?
Fixed asset investment data imply that the state has undertaken massive stimulus since the beginning of 2016. A closer look at the subcomponents of investment, however, give reason to believe that this may be a statistical or ownership reclassification rather than a sea shift in Chinese policymaking. If so, an apparent decline in private investment and surging state investment may not be the correct anchor for market or policy analysis.
Whose Investment?
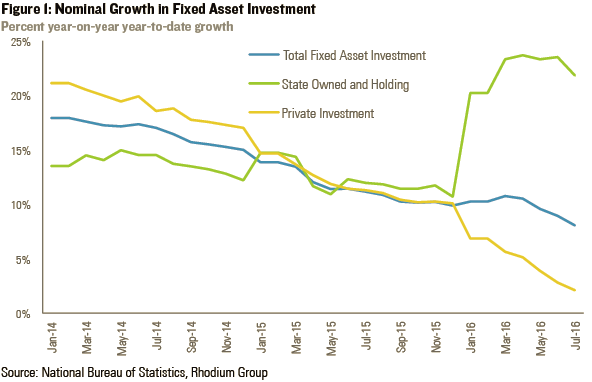
Since January 2016, investors and analysts have watched with increasing worry and confusion as Chinese private fixed asset investment (FAI) plummeted while investment by state owned and holding enterprises surged (See Figure 1). This anxiety was mirrored by Chinese officials. The State Council held an Executive Meeting on the state of private investment; the National Development and Reform Commission offered recommendations for encouraging private investment; and the National Bureau of Statistics (NBS) discussed structural and cyclical factors that may have contributed to the slowdown. Nowhere, however, did the NBS mention any technical reporting factors that may have led to the sharp adjustment, and the Bureau’s own Enterprise Registration Classifications remain unchanged from 2011. Yet an analysis of the subcomponents that comprise these NBS series point towards an abrupt shift that is more technical than fundamental. Private investment and overall FAI are undoubtedly slowing, but the actual decline is likely less severe than indicated by official data series.
A number of arguments have been put forth to explain this abrupt change in FAI data. Explanations include the 2015 equities bailout, which increased state ownership in previously private enterprises; an early 2016 infrastructure-led stimulus program that crowded out private investment; and deteriorating financing conditions for private enterprises. While these factors are likely part of the explanation, there remain several key questions. Figure 2, below, looks at the growth rate of the subcomponents of domestic FAI over the past year to delve deeper into the foundational elements of this issue.
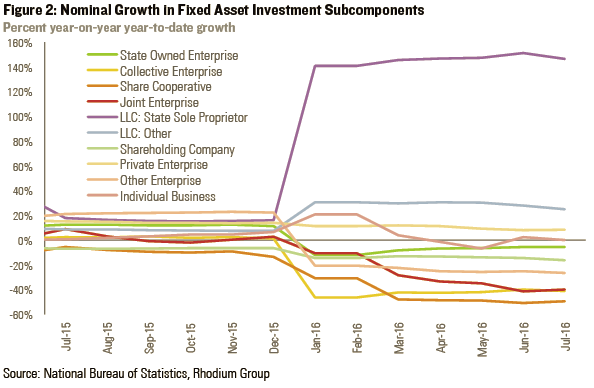
The changes in subcomponents in January 2016 are even more extreme than in Figure 1. Nearly every series had a significant shift; and while some held steady post-adjustment, others continued to decline, such as joint enterprises and share cooperatives. Private enterprise investment, a subcomponent of overall private investment, is the only series that seems to not have been adjusted. Notably, while investment by state owned and holding enterprises surges, SOE investment is down 5.7% year-to-date. And shareholding companies, the recipients of the 2015 bailout, have reduced investment by 16.4% year-to-date when compared with 2015.
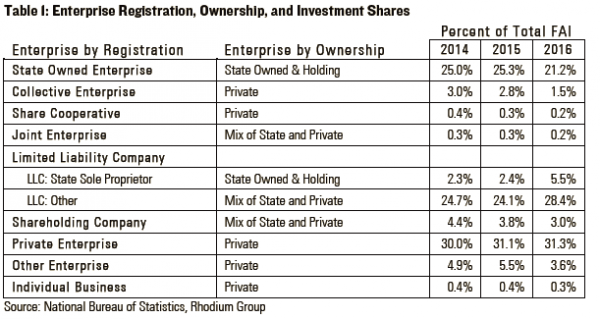
State sole proprietor LLCs, whose investment has nearly tripled since last year, are an immediate candidate to explain the shift – perhaps the state is using these vehicles to direct stimulus funds? Yet state LLCs account for only 5.5% of all FAI, not nearly enough to cause state investment growth to double year-on-year (See Table 1). (Indeed, the rise in state LLC investment mirrors the fall in SOE investment, implying that the shift is likely one of registration.) This chart does seem to support the thesis that there was a significant shift in ownership that was accounted for statistically only in January 2016, an understandable delay given the scope in changes. It does not explain the silence from officials in explaining what is happening to cause such jumps in the data.
While collective enterprises, share cooperatives, and joint enterprises had the biggest shifts in Figure 2 above, they account for such a small percentage of FAI that even a large shift in value will cause only small changes in overall FAI growth. Notably, the investment share of private enterprises has actually risen in 2016 year-to-date.
You’re not the boss of me
To further explore what may have happened it is helpful to attempt to recreate the NBS-provided “supercategories” of state and private investment described in Figure 1. While enterprise FAI is reported by registration, the state owned & holding and private investment series provided by the NBS are based on ownership. Despite this difference, it is possible to approximate the ownership classifications described in Table 1. Figure 3, below, uses the subcomponents of domestic investment to explore what 2016 FAI growth would have looked like had the ownership ratios remained consistent with 2015 values. As the charts show, our reconstructed series track the NBS series quite accurately; on average, they account for 99% of investment in both categories.
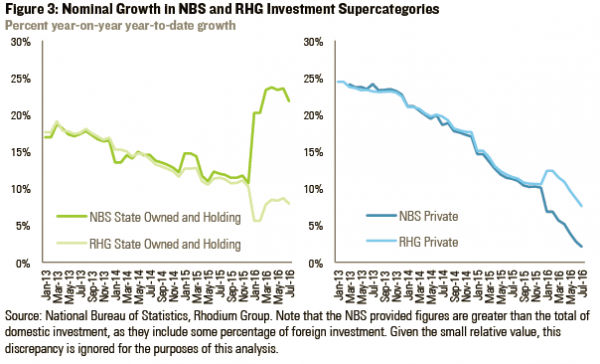
The accurate tracking based on subcomponents breaks down significantly in January 2016, painting the complete opposite picture described in Figure 1. Whereas the official figures show investment by state owned and holding enterprises as jumping significantly in January, the RHG series shows a sharp decline followed by a trend that is very much in line with 2015 figures and the overall slowdown in FAI. A similar story emerges in private investment, with some anomalous data in January and February, followed by a general return to trend. Indeed, using the consistent ownership ratios from 2015, growth rates in overall, state, and private investment are all within half a percentage point of each other in July 2016.
To account for the shift in investment, we must look to those categories of enterprises whose ownership is a mix of state and private. Joint enterprises are too small to have had a meaningful impact. And even if all shareholding companies were majority state controlled, they could not explain the shifts seen since January 2016. The only remaining category is other LLCs, whose share of investment has increased dramatically in 2016. If the 2015 equity market bailout, or some other measure, led to the change in ownership of a portion other LLCs that may have already had minority state ownership, then the dislocations above may not actually represent the significant shift in the investment climate that has been described recently.
Technically, by maintaining state ownership of 49% in all LLCs, the NBS would have been able to artificially boost the rate of private investment as described in their data series. A 2% increase in ownership by the state in these hypothetical LLCs would move them to the state category, even if there were no changes of investment behavior. As a result, it remains unclear how significantly the investment landscape has changed in 2016. Factors such as credit availability and general uncertainty regarding China’s future growth have undoubtedly played a part in the slowdown of investment. But the 13 percentage point rise in the growth of state investment, and the 8 percentage point fall in private investment’s growth rate are statistical noise, not market signals.
Conclusions
There has been an enormous amount of well-reasoned and experienced analysis poured into this issue since the beginning of the year. And several important questions remain.
First, why did the NBS or some other agency not explain what has happened here? Senior officials have led tours to evaluate the state of private investment and passed new regulations to stimulate its growth. Thus a simple ownership change, as described in this note, seems improbable. Yet it is also the most straightforward case, and difficult to dismiss outright.
Second, do the shifts in ownership more accurately reflect the actual state of investment, and if so, should previous investment series be revised accordingly? If there were a large portion of LLCs with minority state ownership “hiding” within the private ownership category, did that mislead prior analysis, both in China and elsewhere? Even if this is the case, 2017’s data should show a return to previous trends once the base effect disappears from the one-time adjustment in ownership.
Finally, FAI data is known to be plagued with inconsistencies – double counting, counting of land investments, and a significant divergence from gross fixed capital formation data. While it is a convenient measure, updated monthly and across different industries and company registrations, January’s opaque reorganization strongly reinforces questions regarding its role for both market and policy analysis without further clarification from the NBS.