Final US Emissions Numbers for 2017
Energy-related emissions fell by 0.66% last year, half their 2005-2016 average rate. Power sector emissions continued to decline, but emissions from transport, buildings and industry all grew, offsetting half the decline in the power sector.
In January, we provided preliminary estimates for US CO2 emissions in 2017. The headline story was that while emissions continued to fall last year, the pace of decline slowed from an annual average 1.3% between 2005 and 2016 to under 1% in 2017. EIA released their final estimates this week which align with our preliminary numbers. Energy-related CO2 emissions fell by 0.66% last year – half their 2005-2016 average rate. Power sector emissions continued to decline, but emissions from the transport, buildings and industrial sectors all grew, offsetting half the decline in the power sector. Growth in aviation emissions alone offset more than one third of the emissions decline from falling coal use in the electric power sector. To meet its Paris Agreement target in 2025, the US will need to do considerably better – a 1.7%-2% average annual reduction will be required.
A Slower Pace of Decline
Carbon dioxide (CO2) from energy consumption is the largest source of greenhouse gas (GHG) emissions both in the US and around the world. In 2015, the last year for which the Environmental Protection Agency (EPA) has published comprehensive inventory numbers, energy-related CO2 emissions accounted for 77% of gross US GHG emissions, with the remainder coming from direct CO2 emitted in industrial processes as well emissions of methane, nitrous oxide, and other greenhouse gasses.
Between 2005 and 2016, energy-related CO2 emissions in the US fell by 13.4%, an average annual decline of 1.3% due to a combination of slower energy demand growth and fuel switching from coal to natural gas and renewables. In January, we published preliminary emissions estimates for 2017 and found that the pace of decline slowed last year. EIA published full year numbers this week that align with our early estimates. They find a 0.66% decline in energy-related CO2 emissions in 2017, half the 2005-2016 average.
All the Progress Is In Power
Between 2005 and 2016, almost 80% of the reduction in energy-related CO2 emissions in the US came from the electric power sector. Improved efficiency of buildings and appliances has helped flatten electricity demand, and coal has lost market share to lower-carbon natural gas and zero-carbon renewables. That trend continued in 2017. Electricity demand fell in absolute terms last year, and coal continued to lose ground to alternative sources of power generation.
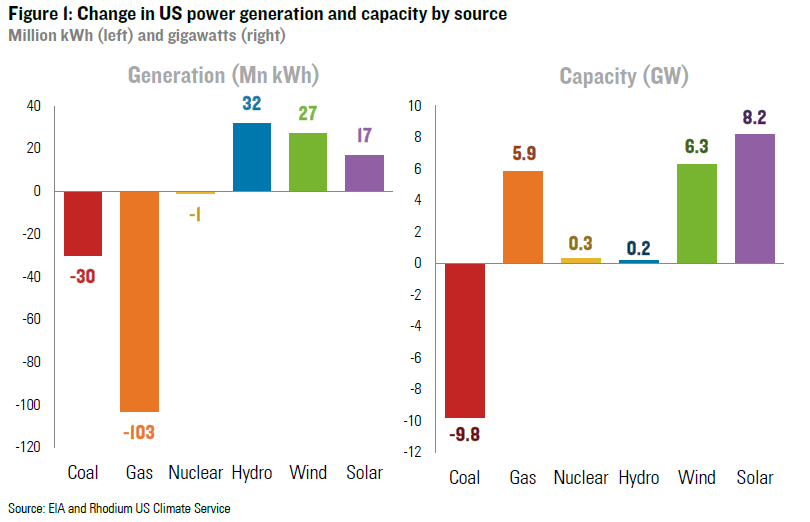
The one big difference relative to previous years was that natural gas and coal generation both declined year-on-year, displaced by growth in hydro, wind and solar generation. Coal and natural gas generation fell by a combined 133 million kWh, while renewable generation expanded by 78 million kWh (Figure 1). Natural gas generation fell further than coal despite a net addition of 5.9 GW of new gas generation capacity, due to higher gas prices earlier in the year. This balance changed during the last two months of 2017, with coal generation falling faster than gas, but both ended the year down relative to 2016 levels.
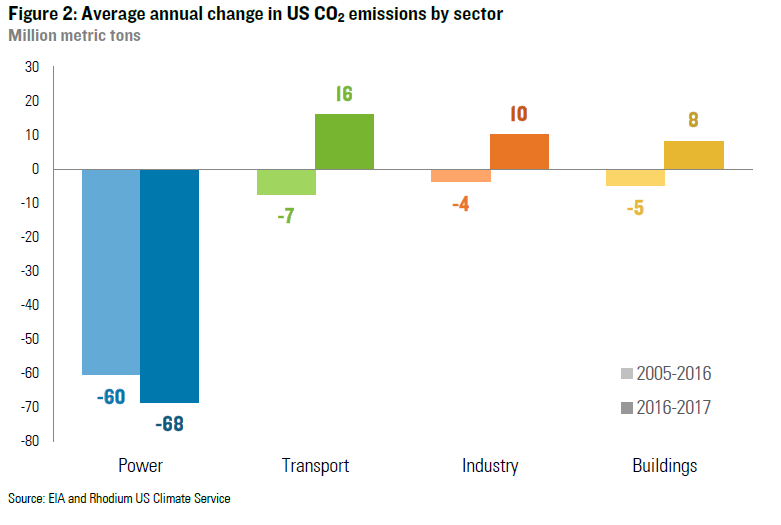
As a result of declining demand and this generation shift, power sector emissions fell by roughly the same amount in 2017 as the 2005-2016 annual average (Figure 2), though less than in 2016 and 2015 specifically. However, energy-related CO2 emissions did not fall in other sectors. In fact, they grew – offsetting half of the gains made in electric power.
Transportation Solidifies Its Emissions Lead
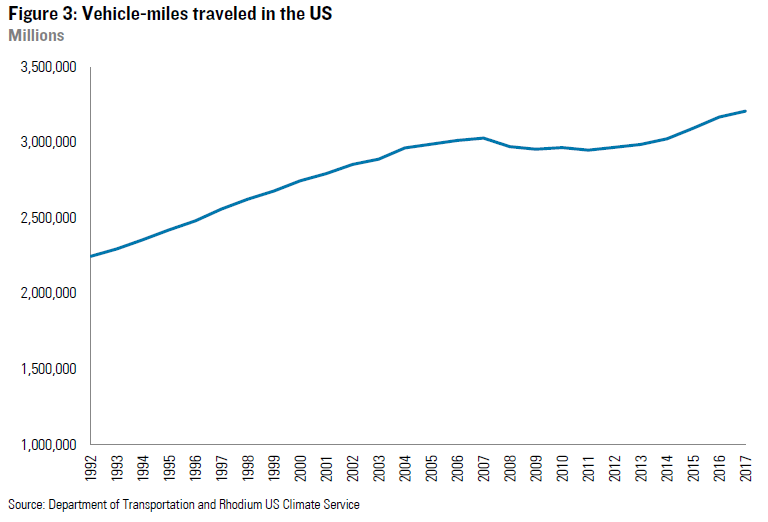
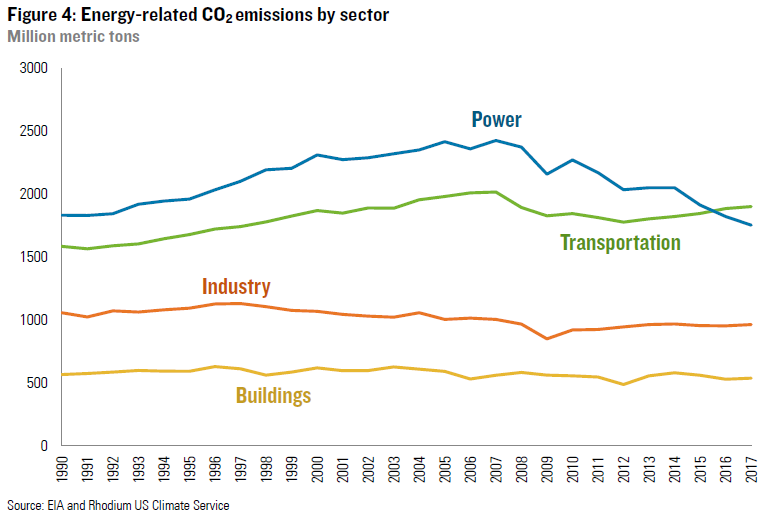
After a pause following the Great Recession, starting in 2012 vehicle usage in the US once again began to increase. Total vehicle miles traveled in the US increased 1.2% in 2017 (Figure 3). That’s a slower rate of growth than in 2015 and 2016, but when combined with flattening progress on fuel economy, it was enough to result in a modest emissions increase. That makes two years running where transportation emissions exceed power generation emissions in the US (Figure 4).
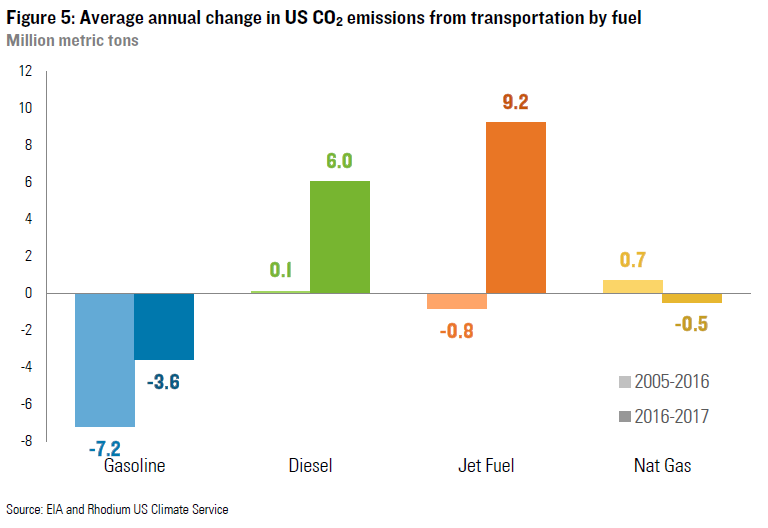
Within transportation, gasoline demand was relatively flat and gasoline-related emissions declined slightly based on full-year EIA data. The pace of decline, however, was half the 2005-2016 average annual rate (Figure 5). Diesel emissions grew by 6 million metric tons on the back of relatively strong trucking demand. The biggest increase, however, was in jet fuel. Robust growth in air travel in the US resulted in a 9.2 million metric ton increase in aviation emissions. That alone offset 40% of the decline in coal-related emissions last year.
Industrial Emissions on the Rise
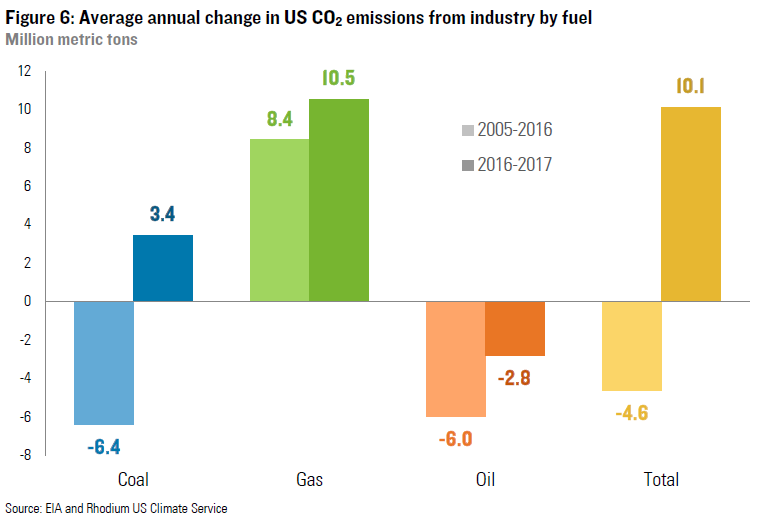
US industrial emissions increased by 10 million metric tons last year, following two years of decline. Oil consumption continued to fall, though at a lower average annual pace than 2005-2016. Emissions from natural gas use expanded faster than trend. And industrial coal demand posted its first gain in the past five years.
Barring a significant change in policy or macroeconomic conditions, we expect the industrial sector to overtake the power sector as the second leading source of US GHG emissions in within the next decade.
On Track to Copenhagen, But Still Short of Paris
Assuming no significant changes in non-energy CO2 or other GHG emissions, sustaining last year’s 0.66% annual decline in energy-related CO2 for the next three years should be sufficient to achieve the US Copenhagen Accord target of a 17% reduction below 2005 levels by 2020. But this pace of decarbonization will still leave the US considerably short of it’s Paris Agreement pledge of a 26-28% reduction from 2005 levels by 2025, as highlighted in our annual Taking Stock report last May. A 1.7-2.0% average annual reduction in energy-related CO2 emissions is required over the next eight years to meet that target, assuming no changes in other gasses. To achieve long-term emissions reductions consistent with the 2-degree temperature target in the Paris Agreement, an even faster rate of decarbonization is required.
Recent climate and clean energy policy developments at the state and city-level policy developments could potentially accelerate last year’s pace of emission reductions, while recent federal regulatory changes could slow that progress. We will be releasing an updated Taking Stock report this spring that attempts to net these two competing trends out with economy-wide GHG emission projections under a range of energy price, technology cost, and macroeconomic growth scenarios.
Learn more about US progress toward emissions targets in our Taking Stock 2018