Taking Stock 2018
We find that US emissions under current policy are heading towards 12 to 20% below 2005 levels in 2025, a far cry from the US Paris commitment of a 26-28% reduction.
Transparent reporting of greenhouse gas (GHG) emissions and mitigation strategy is the bedrock of the global effort to combat climate change. This year, the US let slip a key deadline for reporting its progress to the international community. In its absence, Rhodium Group’s 2018 “Taking Stock” report provides an independent assessment of where the US stands on its climate commitments. Our projections include the latest federal policy developments, state climate and energy rules, energy market trends, and technology advancements over the past year.
We find that US emissions under current policy are heading towards 12 to 20% below 2005 levels in 2025, a far cry from the US Paris commitment of a 26-28% reduction. This wide range represents uncertainty surrounding the fate of federal climate policies, how much pollution will be offset by sequestration from US forests, and the long-term viability of today’s low-carbon energy trends. Cheap natural gas and renewables continue to thrust coal out of the market, but after 2025 those same forces push a larger share of zero-emitting nuclear plants into retirement — leading to a rebound in power sector emissions. Transportation remains America’s largest source of emissions through most of our outlook, and while more affordable electric vehicles start to bend the curve, we find there is little downward pressure on economy-wide emissions post-2025.
Overview
Over the last year, US climate efforts have faced stiff headwinds as the Trump Administration continues to unravel Obama-era climate and clean energy policies. Although this may have slowed progress toward meeting America’s Paris goals, tailwinds in the form of cheap renewables and natural gas, steadily declining electric battery prices, and reinforced subnational policies have largely sustained the momentum built over the past few years, keeping US greenhouse gas (GHG) emissions on the downswing. It is too soon to tell how these clean energy tailwinds will shape up and whether they will be strong enough to overcome additional federal policy rollbacks. This edition of Taking Stock attempts to shed some light on the potential impact of a range of policy and technology developments on US GHG emissions over the coming decade.
In this edition of Taking Stock, we provide projections of US GHG emissions that account for recent economic, market, and technology developments as well as changes in federal and state policy as of May 2018. This report contains a range of projections based on policies on the books today, not an assessment of US emission reduction potential. Our methodology is consistent with reporting guidelines for countries tracking progress toward their national commitments under the UN Framework Convention on Climate Change (UNFCCC). In the absence of official US reports, Taking Stock provides an important, objective input to the Talanoa Dialogue, which was launched under the Paris Agreement to take stock of collective efforts and inform new more ambitious national commitments in the years ahead.
A lot can happen in a year, let alone a decade. This report does not attempt to predict where US emissions will be in 2025. Changes in state and local policy − whether independent of the new administration or in direct response to it − will shape future US emissions, as will the outcome of the 2018 Congressional and 2020 Presidential elections. However, the outlook presented here provides a useful signpost for where the US is headed as of today, and how much work remains to be done.
Turbulence on the Policy Front
Since our last installment of Taking Stock, the Trump administration has held fast to its campaign promises to dismantle Obama’s Climate Action Plan. Yet these federal efforts to nullify carbon-cutting initiatives are challenged on many fronts. From regulatory and legal hurdles to pushback by the regulated industries themselves, many of the Trump Administration’s rollback attempts remain stymied. Where the Administration has been extremely successful, however, is in sowing confusion among a wide array of stakeholders and significantly increasing regulatory uncertainty for American businesses.
Targeted efforts to rescind or replace policies designed to curtail emissions from power plants and transportation have had mixed success to date. Trump’s Environmental Protection Agency (EPA) quickly moved to dismantle the Clean Power Plan, its most decisive action to date, but the Clean Air Act still requires the agency to propose a replacement rule. The President’s recent request that the Department of Energy (DOE) use its emergency authorities to prevent the pending closure of a portion of the US coal and nuclear fleets faces significant and widespread opposition. At a time when cars and trucks are the nation’s top source of carbon emissions, EPA’s proposal to rollback federal Corporate Average Fuel Economy (CAFE) standards threatens to ignite legal battles with several states and has even rankled some auto manufacturers.
Several Obama-era policies to reduce short-lived super pollutants are in limbo pending court action. These include Bureau of Land Management (BLM) rules for venting and flaring of methane on public lands and EPA rules to phase out high-Global Warming Potential (GWP) HFCs from refrigeration and cooling. A landmark global agreement to phasedown HFC emissions under the Montreal Protocol languishes on the President’s desk, despite strong industry and Senate support. Even pollution limits that the Trump EPA failed to overturn — like the 2016 landfill methane rule — are not being enforced, spurring legal challenges from states.
Trump’s most prominent climate policy announcement to date, his commitment to withdraw the US from the Paris Climate Agreement, bucked the global consensus to curb emissions. The Agreement itself, however, prevents countries from officially withdrawing before the end of 2019. US representatives continue to participate in the UNFCCC process and ongoing Paris negotiations. Within days of Trump’s announced pull out, a wide swath of states, cities, and businesses stepped up to assume the mantle of US climate leadership. Several governors formed the US Climate Alliance − a bipartisan coalition committed to reducing GHG emissions consistent with the goals of the Paris Agreement that now includes 16 states and Puerto Rico. They are joined by 240 American cities (at the time of writing) whose mayors have pledged to meet the Paris Agreement goals, as well as 1,905 businesses and investors, and 345 colleges and universities in supporting the Paris Agreement under the banner “We Are Still In.”
In the face of ongoing federal regulatory rollbacks, many of these subnational actors have ramped up their pursuit of more ambitious clean energy policies over the past year. Seventeen states and the District of Columbia joined to sue the Administration to halt the weakening of CAFE standards. Several states bolstered their targets for renewable portfolio standards (RPS) and energy efficiency resources standards (EERS), and several states are providing support to nuclear plants to prevent early closures. The nine states participating in the Regional Greenhouse Gas Initiative approved new rules extending the cap-and-trade program to 2030 and tightened the cap and New Jersey and Virginia have taken steps to join the program. Meanwhile, cities and corporations are doing more than ever to procure renewable energy.
Energy and GHG Emissions Trends
Of course, policy alone doesn’t determine a country’s GHG emissions − a combination of policy, macroeconomic, technology and market factors play a role. Recent developments in clean energy technology, energy efficiency, and oil and gas production have played an outsized role in shaping America’s emissions future. Low-cost shale gas has eroded coal’s market share in power generation, while solar electricity and energy storage continue to see dramatic declines in cost. As a result, coal’s share of total generation across the US dropped to 30% in 2017, the lowest it has ever been in the post-war era. Meanwhile, natural gas has taken the title from coal as the leading source of electricity at 32% of total generation in 2017, and the share of electricity coming from renewable sources has doubled since 2005 to 16%. Declining battery costs are sparking new interest in electric vehicles (EVs). Over the past year, nearly every major auto manufacturer has pledged to dramatically expand their EV offerings, making the technology more accessible to a broader range of customers. Furthermore, continued improvements in energy efficiency have kept US energy consumption flat even as the economy continues its slow but steady post-financial crisis expansion.
All of these factors — policy, energy, and economy — helped push total net US GHG emissions down to 12% below 2005 levels in 2016. Most of that progress happened in the electric power sector, where emissions are now 25% lower than in 2005. Methane emissions declined as well, led by reductions from landfills and coal mines. Meanwhile, emissions of nitrous oxide (N2O) grew, driven primarily from increased agricultural activity. Emissions of fluorinated gases like hydrofluorocarbons (HFCs), which replaced ozone-depleting substances in air conditioning and refrigeration, also increased. Relatively modest post-recession economic growth means emissions are lower than they would have been compared to a stronger recovery. These trends combined mean the US has bent its emissions curve almost halfway to the Paris goals. As we discuss below, current federal and state policy will not get the US all the way to the 2025 target, even with help from strong low-carbon market trends.
Emissions Outlook
What does the current federal and state policy landscape imply about the outlook for GHG emissions in 2025 and beyond? To address uncertainty about the trajectory of the Trump administration’s plans, we model the full range of potential outcomes from federal policies that are in doubt — whether facing a legal challenge, undergoing agency review or revision, or undermined by lack of enforcement. We model the impact on US GHG emissions using RHG-NEMS, a version of the National Energy Modeling System used by the US Energy Information Administration (EIA) to produce its Annual Energy Outlooks (AEO). We make several modifications in RHG-NEMS and project impacts on all six GHGs targeted for reduction under the Kyoto Protocol. We account for the interactive effects across sectors and gases, such as the methane emissions associated with oil and gas production and consumption outcomes from each scenario.[1]
We make a second set of modifications in RHG-NEMS to incorporate our assessment of the range of technological and market drivers that can materially impact US CO2 emissions. As a starting point, we construct a Baseline scenario. We include all announced power plant retirements: 45 gigawatts (GWs) of coal and 11 GWs of nuclear capacity through 2030. We assume the cost of renewable energy and energy storage technologies will fall, consistent with moderate cost reductions in the latest projections from the National Renewable Energy Lab (NREL) and the International Renewable Energy Agency, respectively. We assume that electric vehicle battery costs decline more rapidly than in the AEO, in line with the mid-range of estimates available in the literature. In this Baseline scenario, global oil prices rise from to ~$50 per barrel in 2017 to ~$90 per barrel in 2030. Wholesale natural gas prices stay in the range of $3 per one million British Thermal Units (MmBTU). We assume the economy will grow at a real annual rate of 2.1% on average over the next ten years – slightly greater than the 1.9% growth rate projected by the Congressional Budget Office. Later in the report, we discuss the impact of uncertainty on these energy and economic drivers. A full description of our input assumptions and approach can be found in the technical appendix to this report.
Our projections include all meaningful state climate and clean energy policies currently on the books. Specifically, we calculate the impact of emissions-reduction policies that states have adopted as of May 2018. However, we do not include state or city emission reduction targets that have yet to be supported with binding policy, such as the long-term emission reduction pledges made by US signatories to the Under2 MOU. We also do not explicitly capture city and corporate clean energy goals due to the difficulty in determining whether those reductions are additional to state and federal renewable policies. For California, as an example, we include the state’s AB32 cap-and-trade program, which now goes out to 2030; zero emission vehicle (ZEV) mandates; GHG standards for passenger vehicles; Low Carbon Fuel Standard (LCFS); rules prohibiting high-GWP HFCs; and methane regulations for landfills.
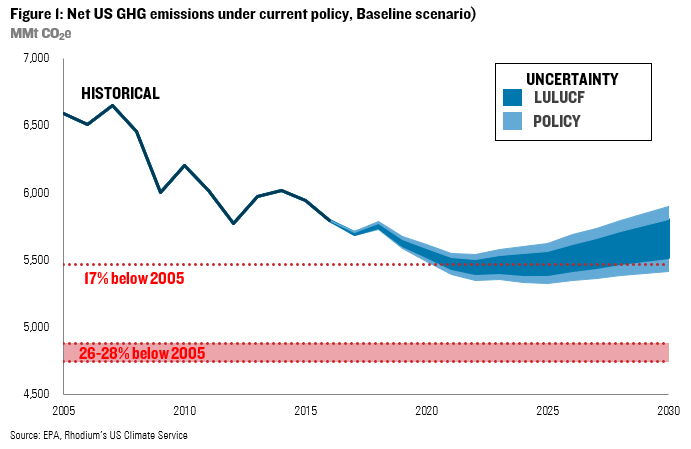
We estimate in the Baseline scenario that US GHG emissions will continue their downward trend in the coming years, reaching 15-17% below 2005 levels by 2020. This would put the US within striking distance of its Copenhagen Accord target of a 17% reduction (Figure 1). In this range we examine the influence of two key variables: 1) the status of federal rules, and 2) the ability of US forests and other lands to sequester carbon (referred to as “LULUCF”). Over time, uncertainty grows, putting emissions anywhere from 15-19% below 2005 levels in 2025 and 10-18% by 2030. That’s a fair way off from the 26-28% Paris commitment for 2025 and even further from the kind of 2030 reduction required to be on track to meeting long-term US emission reduction objectives. Below we provide an overview of our estimates for each of the six gases, including the status of relevant federal and state policies included in the high and low end of our Baseline range.
Drilling Deeper: Results by Gas and by Sector
Carbon Dioxide
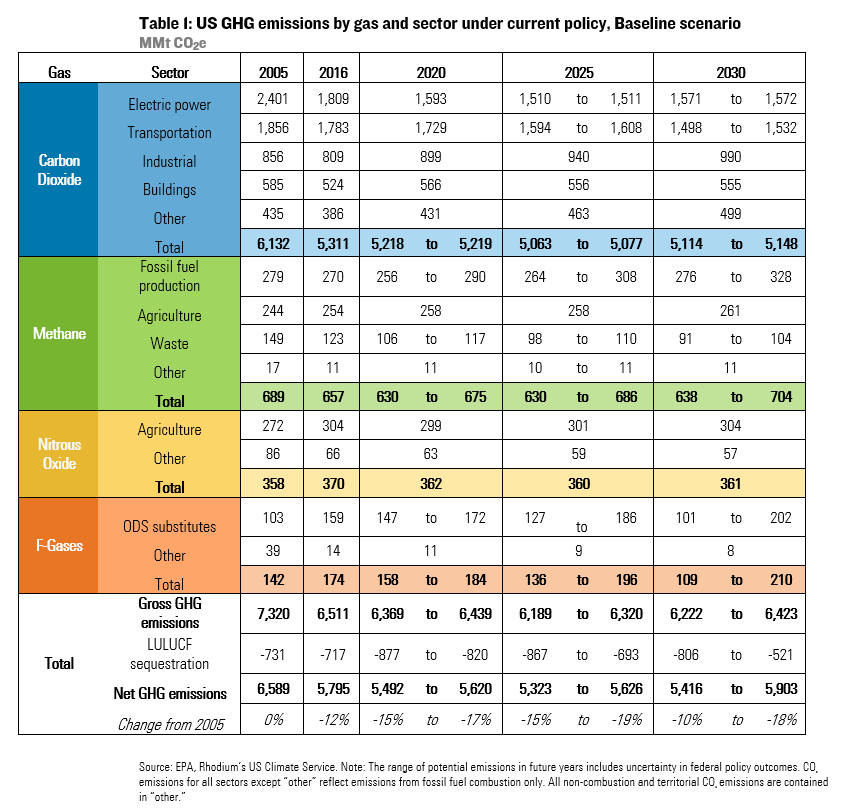
Despite recent progress in decreasing the carbon intensity of the US economy, CO2 continued to make up the lion’s share (82%) of gross US GHG emissions in 2016 (Table 1). In the electric power sector, tepid growth in electric demand, increasingly cheap renewables supported by energy storage and persistently low-cost natural gas drive a continued shift away from coal and lead to the closure of 80 GWs of coal capacity by 2025. That is nearly double what’s currently planned for retirement. In 2025 emissions from this sector are 1,510-1,511 million metric tons (MMt), 37% below 2005 levels, greater reductions than required by President Obama’s Clean Power Plan (32% by 2030). All of these market factors lead to the shutdown of 23 GWs of nuclear power capacity by 2025, 12 GWs more than currently planned. After 2025, emissions begin to rebound due to additional nuclear retirements. If the Trump Administration, states or wholesale market regulators act to prevent some or all of these nuclear retirements, then emissions would be lower than in Table 1. At the same time, if the actions are taken to prevent some or all of the coal plant retirements in our Baseline scenario — especially if a production incentive is used — emissions could be higher.
Transportation remains the largest emitting sector in our Baseline scenario through 2025 even as emissions decline by 14% compared to 2005. In terms of policy, the primary driver of transportation emission reductions is federal CAFE standards supplemented by state Zero Emission Vehicle (ZEV) mandates. As of this writing, the Administration has not released its proposed revisions to CAFE, but a leaked draft outlines several options, including a freeze. In our Baseline scenario, we assess the potential impact of a freeze and a more moderate rollback (reducing the annual fuel economy gains by a third for model years 2022-2025). A full freeze would mean transportation emissions decline to only 13.3% below 2005 levels in 2025, even after accounting for the fact that California and 12 other states have decided to challenge the federal rollback and plan to implement the original Obama era standards. Regardless of the fate of CAFE, decreasing battery costs lead to 1.3 million plug-in vehicles sold in the US in 2025 and 2.8 million in 2030 in our Baseline scenario. The surge in plug-in vehicles contributes modestly to transportation emission reductions through 2030, making up only 6% of all passenger vehicles on the road that year.
Industrial emissions increase through 2030 in our Baseline scenario, with emissions from the sector reaching 10% above 2005 levels in 2025. Cheap natural gas drives more energy-intensive manufacturing, such as petrochemical production, leading to higher emissions. Emissions from fossil-fuel combustion in buildings drop to 5% below 2005 levels in 2025. While building codes, appliance standards, and state efficiency programs make homes and businesses more efficient, upward pressure from the population and economic growth lead to emissions remaining essentially flat around 2015 levels in our Baseline.
Methane
After CO2, methane is the second-largest source of US GHG emissions. In 2016, this extremely potent GHG−over 25 times as climate-forcing as CO2 over 100 years−accounted for around 10% of total emissions. Methane emissions result primarily from livestock, leaks in natural gas systems[2], and waste decomposition in landfills. EPA this year reported a 4.5% decline in methane emissions since 2005, due primarily to a reduction in emissions from landfills and coal mining that was offset somewhat by a rise in emissions from petroleum systems and manure management.
The fate of US methane emissions over the coming decade largely depends on the status of a suite of federal oil and gas standards. These include 2016 New Source Performance Standards (NSPS) for new and modified oil and gas production sources; revised control techniques guidelines (CTG) for states in nonattainment areas; and BLM rules limiting venting and flaring of natural gas on public lands. If federal regulators enforce these standards, methane emissions would drop to 8.5% below 2005 levels by 2020, leveling off through 2025. If EPA and BLM overturn these rules−as they have sought to do, though unsuccessfully to date−methane emissions could begin to grow as soon as this year. With no federal regulation and enforcement, methane emissions drop to only 2% below 2005 levels in 2020 and only 1% by 2025. In the face of uncertain federal rules, state policies are increasingly important backstops. Our projections reflect estimated methane emission reductions from existing state standards in California, Colorado, Pennsylvania, and Wyoming across all scenarios.[3]
Obama-era regulations reducing methane from landfills are also in limbo. In 2016, EPA finalized New Source Performance Standards for municipal solid waste landfills and updated emissions guidelines for existing landfills. In May 2017, Trump’s EPA announced it would reconsider the rules and issued a 90-day stay. When the stay expired in August 2017, EPA had still not issued a notice of proposed rulemaking, leaving the rules intact, though EPA has not taken any steps to revise or enforce the rules. Several states have filed suit against EPA for failing to meet key enforcement deadlines. To reflect the full range of potential outcomes in our Baseline scenario, we estimate emission reductions with and without current federal landfill standards in place.
Hydrofluorocarbons (HFCs)
Fluorinated gases—including HFCs, Perfluorocarbon (PFC), and Sulfur Hexafluoride (SF6) – are thousands of times more climate-forcing than CO2. Emissions of HFCs, the most prevalent of the three, grew 32% between 2005 and 2016. Unchecked growth in HFCs, which are primarily used as a substitute for ozone-depleting substances in applications such as air conditioning and refrigeration, would lead to a nearly 20% increase from today’s levels by 2025.
A future of unrestrained HFCs emissions growth is much less likely after an international breakthrough in 2016 with the adoption of the Kigali Amendment to the Montreal Protocol requiring a global phasedown of the production and consumption of HFCs. Under the amendment, the US and other developed countries are required to reduce baseline HFC production and consumption by 10% in 2019, 40% by 2024 and 70% by 2029. Though Kigali marked a turning point for global HFC emissions, it remains unclear whether the US − one of the amendment’s primary architects and champions − will ratify and implement it. The US made some initial progress towards putting in place a framework for phasing down HFC use under its Significant New Alternatives Policy (SNAP). But in 2017, a DC circuit court overturned a portion of the SNAP rule that prohibited the use of high-GWP HFCs. EPA plans to initiate a new rulemaking to replace the vacated rule, but it is not clear whether they will seek to achieve the same level of stringency as the Obama era standard. In the meantime, states are beginning to consider their options for filling the federal gap. California recently adopted its own prohibition of high-GWP HFCs for refrigerants and foams, modeled after the vacated EPA SNAP standards. The state is in the process of developing new rules to cut HFC emissions to 40% below 2013 levels by 2030.
Despite federal policy delays, industry and state-level momentum will help bend the curve of US HFC emissions over the coming decade, though it remains uncertain just how far. To account for this, we include a range of potential outcomes. At the most ambitious end of our range, we assume the US meets its Kigali Amendment obligations, with federal, state and corporate action all contributing. We estimate this could limit emissions to 43% above 2005 levels by 2020 and 23% above 2005 levels by 2025. If there is no Kigali Amendment implementation and EPA fails to replace the vacated EPA SNAP rule, HFC emissions grow to 67% above 2005 levels by 2020 and just over 80% above 2005 levels by 2025. In all scenarios, we include the effect of unchallenged federal SNAP rules from 2016 and California’s 2018 prohibition rule.
Nitrous Oxide
Emissions of nitrous oxide (N2O), a powerful gas nearly 300 times more potent than CO2, have remained relatively flat since 1990 at around 350 MMt CO2e. N2O emissions contributed around 6% of total US GHG emissions in 2016. Almost three-quarters of total N2O emissions come from agricultural soil management, which has seen a 12% increase since 2005. We expect little change in N2O emissions from agriculture through 2030, based on relatively consistent levels of agricultural production expected throughout that period. N2O emissions from mobile combustion, a smaller source, have dropped by over half since 2005. The decline was largely due to tighter controls on vehicle emissions, and we expect this trend to lead to an additional 7% drop below 2005 levels by 2025. Between these two sources, net N2O emissions will decline by 3% by 2025 from today’s levels, then flatten out through 2030 under current policy.
Forests and Land Use
The ability of American forests and other lands to sequester carbon continues to be a wild card for net GHG emissions. In 2016, 11% of total US GHG emissions were offset as forests and other lands absorbed carbon from the atmosphere. Since 1990, the carbon sink has fluctuated between about 700 and 840 MMt CO2, with the most recent estimate for 2016 at 755 MMt CO2. Recent studies suggest that as a result of changing land-use patterns and the effects of climate change itself, US lands may over the long-term absorb carbon at a slower rate. But if and when such slowing occurs remains unclear. To account for this uncertainty, we present a range of potential carbon stock changes from land use, land-use change and forests (LULUCF) through 2030.
Our high and low sequestration estimates are based on modeling by the US Department of Agriculture (USDA), US Forest Service (USFS) and EPA presented in the 2016 US Biennial Report, as well as updated estimates from the 2018 EPA GHG Inventory. In our low sequestration scenario, forest area and forest carbon continue to grow slowly through 2020, with the net sink reaching 820 MMt CO2e, just over 12% of projected GHG emissions, after which it declines to around 693 MMt CO2e in 2025 and 521 MMt by 2030. In our high sequestration scenario, forest area and carbon sequestration continue to grow until 2020 reaching 877 MMt, nearly 14% of projected GHG emissions. After flattening out through 2025, they decline slightly through 2030 to around 800 MMt. The result is an uncertainty band of about 58 MMt between the two scenarios in 2020, growing to around 173 MMt by 2025.
What’s Driving Changes in This Year’s Estimate?
Market factors such as lower natural gas prices, cheaper renewables, more announced coal plant retirements, and cheaper EVs, make this year’s downward emissions slope steeper, compared to last year’s projections. Forecasts of slightly slower economic growth also contributed to this year-on-year improvement in the potential for emissions reductions. But some of this progress is threatened by the possible rollback of federal CAFE and methane standards and developments signaling federal inaction to reduce HFCs.
To understand what influenced our findings it helps to examine trends driving CO2 emissions from fossil fuel combustion, which makes up roughly 75% of the US GHG emissions inventory. Our annual average Baseline estimates for 2020-2030 are 196 million metric tons lower than last year’s projections for the same period (Figure 2). The vast majority of the difference — 176 million tons − is due to a reduction in carbon intensity of energy (Figure 2). The switch from coal to lower-cost natural gas, along with increased deployment of renewables and EVs, contributed to this dynamic (for more detail, see the Technical Appendix). Increased ambition in state clean energy policies also plays a role.
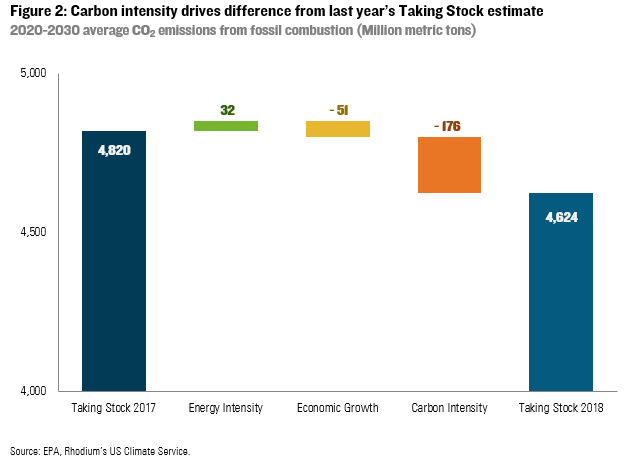
The secondary factor driving emissions down compared to last year’s estimate — a 2020-2030 reduction of 51 million metric tons — is more moderate assumptions about economic growth. Our projections more closely align with the Congressional Budget Office’s (CBO) growth outlook of 1.9%, using the EIA assumptions that best mirror that forecast over the next decade. Last year we assumed annual growth of 2.2%. Lower growth leads to lower overall energy demand, all else equal. Energy intensity also increased in our projections compared to last year, driven by the possible rollback of federal CAFE standards and slightly higher assumed economic output from energy-intensive manufacturing, putting 32 million tons of upward pressure on average annual emissions in our 2020 to 2030 estimates.
This decrease in CO2 emissions relative to last year’s estimates is somewhat negated by developments signaling a potential increase in non-CO2 emissions. With EPA’s SNAP standards vacated by the courts and federal inaction on the Kigali Amendment to the Montreal Protocol, we included a wider range of HFC emission outcomes this year. The potential for complete federal inaction on HFCs adds just over 100 MMt CO2e to our emissions totals in 2025 compared to last year’s assessment, which assumed full federal implementation.
Uncertainties Abound
While plenty can change in a year, one thing remains constant: the future is difficult to predict. Our Baseline scenario presents a likely range of outcomes to account for the varying degree to which forests and other lands may sequester carbon in the future, as well as uncertainty surrounding the status of federal regulations. However, politics and policy are not the only unknowns as we look ahead. Uncertainty surrounds the economic, technological and market forces that play a critical role in shaping US emissions trends. How might additional coal and nuclear plant retirements, an unexpected jump in natural gas prices, plummeting solar costs, or an economic recession impact US emissions? This section details two additional areas of uncertainty in our projections. Holding our policy assumptions constant, we examine how energy market and economic variables could shape US emissions in the years ahead.
Energy Markets
We constructed two scenarios to show the bounds of energy market uncertainty in terms of technology costs and natural gas prices. The first scenario looks at a combination of higher technology costs and higher natural gas prices. The impact is an increase of 96 MMt CO2e in 2020 and 145 MMt CO2e in 2025 when compared to our Baseline. In this case, Henry Hub natural gas prices (a benchmark for US contracts) rise steadily from an annual average of $3/MmBTU in 2017 to $4/MmBTU in 2025. This price is about $1.00/MmBTU higher than our Baseline scenario. Renewable energy and storage are also higher than our Baseline, reflecting EIA’s AEO2018 reference case assumptions. For some technologies, these costs are much higher than our Baseline assumptions, for example, utility PV costs are nearly double what they are in our Baseline. EV battery costs fall, but at the slowest pace projected by NREL. We then couple these more expensive gas and renewables assumptions with possible regulatory rollbacks and lower offsets from LULUCF carbon sequestration to arrive at this higher emissions outcome.
The second scenario focuses on lower technology costs and lower natural gas prices, resulting in a decrease of 59 MMt CO2e in 2020 and 63 MMt CO2e by 2025. In this case, annual average Henry Hub natural gas prices stay at their recent lows of ~$2.50/MmBTU throughout the projection period. Renewable energy costs decline at the fastest pace projected by NREL. Likewise, we incorporate Bloomberg New Energy Finance’s (BNEF) for optimistic forecasts for energy storage and EV battery costs. We couple these cheaper natural gas and renewables assumptions with an expectation of minimal rollbacks of climate policies and our high LULUCF sequestration scenarios. See the Technical Appendix for a full discussion of energy market assumptions across all scenarios.
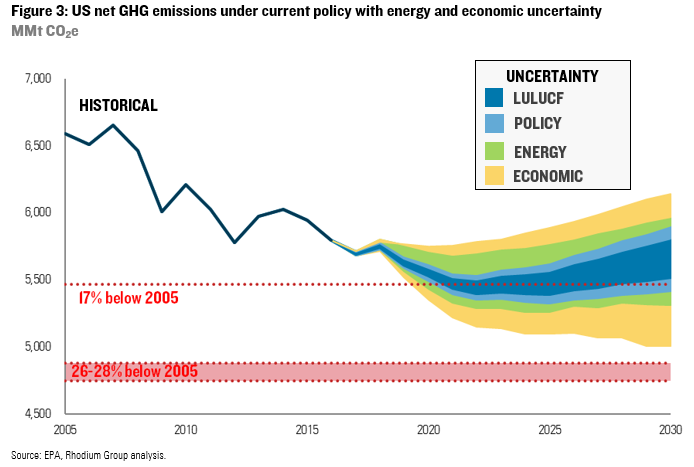
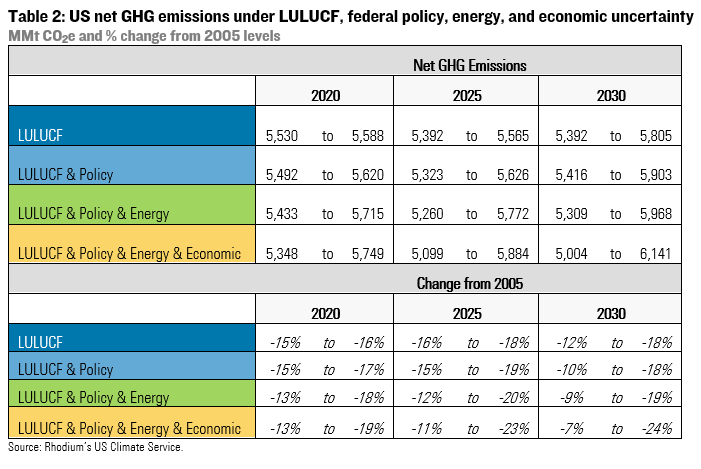
The result: a 13-18% reduction in US GHG emissions from 2005 levels in 2020 (Figure 3) broadening to 12-20% by 2025 and 9-19% by 2030 (Table 2). The wider emissions range reflects big differences in the US energy system that go beyond policy impacts. For example, across the emissions range, the coal power plant fleet in 2025 is as large as 191 GWs or as small as 161 GWs compared to the roughly 260 GWs in operation in 2017. In 2025, electricity from all renewable resources provides 21% to 25% of total electricity, and the nuclear fleet shrinks by 13% to 26% on a capacity basis compared to 2017. In the transportation sector, plug-in vehicles make up 2-4% of all vehicles on the road in 2025 and 3% to 11% by 2030.
Economic Growth
Our Baseline scenario assumes the economy grows at a real annual rate of 2.1%, on average, over the next decade. An unexpected boom in growth could push emissions up compared to our Baseline scenario all-else-equal. Meanwhile, a recession or more tepid growth could result in lower emissions. To quantify the potential range of emission impacts, we modeled a scenario in which US GDP grows at 1.6% per year, on average, over the next ten years – or 0.5% per year slower than our Baseline and lower than current CBO projections. Combined with low natural gas prices and renewable energy costs, minimal rollbacks of federal regulations aimed at emissions reductions, and optimistic assumptions for LULUCF, this could lead to emissions falling 19% below 2005 levels by 2020, 23% by 2025 and 24% by 2030 (Figure 3 and Table 2).
Economic growth could also be faster than we assume in our Baseline scenario. President Trump’s fiscal year 2019 budget assumes the economy will grow at 3% a year, not 2.1%. We consider the impact of growth at 2.6% about halfway between our Baseline approach and the Trump budget and couple this with high natural gas and renewable energy costs, full rollback of key climate policies and pessimistic assumptions for LULUCF. We find that US GHG emissions could be as high as 13% below 2005 levels in 2020, 11% in 2025 and 7% in 2030.
Opportunities For Achieving Additional Reductions
Our analysis shows that US emissions are likely to decline at least modestly from current levels over the next decade. However, the US is not currently on track to meet its 2025 Paris emission reduction goal — even under the most optimistic federal policy and energy market scenarios, and relatively pessimistic economic growth scenarios. What’s more, emissions begin to rise after 2025 in nearly all of our scenarios. The market drivers that are pushing the US towards clean energy only deliver so much progress towards climate goals before they begin to push emissions in the wrong direction. For example, cheap natural gas and renewables push out coal in the electric power sector through 2025 but then push more zero-emitting nuclear out of the market, leading to a rebound in electric power emissions. Today’s regulatory rollbacks also have a bigger impact after 2025 — exacerbating these market drivers.
Efforts to maintain policies currently targeted for rollbacks by the Trump Administration could bolster emissions reductions from transportation, oil and gas operations, HFCs, and the power sector. For HFCs, the Administration could send the Kigali amendment to the Senate for ratification as many members of that body have requested. Preventing policies such as the possible new DOE order supporting coal and nuclear plants will also be important to maintaining low-carbon energy market trends. At a minimum, these steps could keep the US closer to the low end of our projections.
States and cities can continue to fill the federal policy vacuum by adopting and implementing new policies, especially outside of the electric power sector emissions steadily decline in our projection range, where we see markets making less of a dent. Corporate players could use their buying power to continue to accelerate clean technology deployment beyond today’s levels. While it is clear that the current US administration and Congress are unlikely to make climate change mitigation a priority, the result of upcoming mid-term elections could offer policymakers opportunities to test-drive new legislation. Such efforts could soften the ground for sowing new climate policy if mitigation becomes a priority after the 2020 presidential election.
Taking Stock serves as the foundation for our new US Climate Service (USCS) offering.
Learn more about access to Taking Stock and USCS data and research
Click here to access the technical appendix.
[1] For CO2 emissions from sources other than fossil fuel combustion as well as all other GHG emissions contained in the baseline we primarily rely on EPA best practice methods. Methane emission reductions from petroleum and natural gas systems from existing federal and state policy are derived from analysis conducted by the Clean Air Task Force. LULUCF sequestration projections are derived from the latest US Biennial Report and calibrated to EPA’s latest inventory. Consistent with EPA’s inventory we use the IPCC’s 100-year Global Warming Potential (GWP) values from its Fourth Assessment Report (AR4) to convert non-CO2 gases to CO2 equivalents.
[2] According to a new study in in Science (Alvarez et al 2018), methane emissions from oil and gas facilities were 60% higher than EPA inventory estimates 2015. Applying the study’s revised estimates to EPA’s most recent inventory would increase emissions by as much as 120 MMt CO2e in 2016. It is difficult to say what this would do to the relative difference in emissions between 2005 and current or future years as it is not clear whether the study’s findings would apply to EPA’s 2005 emission estimates.
[3] Our estimates of oil and gas methane emissions and reductions from federal and state policy are based on 2018 modeling done by the Clean Air Task Force.