Preliminary US Emissions Estimates for 2017
The US appears on track to meet it’s 2020 emission reduction pledge under the 2009 Copenhagen Accord but will need to significantly accelerate the current pace of emission reductions to meet it’s Paris Agreement targets.
Last week, we estimated full-year US coal consumption and production numbers for 2017. In this note, we combine those data with recent petroleum and natural gas statistics to provide a preliminary estimate of US carbon dioxide (CO2) emissions in 2017. We find that emissions continued to decline in 2017, by just under 1% year-on-year. That was due entirely to changes in the power sector, the result of falling electricity demand and growth in wind, solar and hydropower generation. Emissions from the transportation, industrial and buildings sectors all rose in 2017, with transportation now outpacing power as the largest source of US CO2 emissions for the second year in a row. The US appears on track to meet it’s 2020 emission reduction pledge under the 2009 Copenhagen Accord but will need to significantly accelerate the current pace of emission reductions to meet it’s Paris Agreement targets.
Rhodium’s Final US Emissions Estimates for 2017 were published in March 2018.
A slower pace of decline
Carbon dioxide (CO2) from energy consumption is the largest source of greenhouse gas (GHG) emissions both in the US and around the world. In 2015, the last year for which the Environmental Protection Agency (EPA) has published comprehensive inventory numbers, energy-related CO2 emissions accounted for 77% of gross US GHG emissions, with the remainder coming from direct CO2 emitted in industrial processes as well emissions of methane, nitrous oxide, and other greenhouse gasses.
Between 2005 and 2016, energy-related CO2 emissions in the US fell by 13.4%, an average annual decline of 1.3% due to a combination of slower energy demand growth and fuel switching from coal to natural gas and renewables. Using a combination of data from the Energy Information Administration’s (EIA) Monthly Energy Review, EIA’s weekly coal and petroleum consumption statistics, daily power generation data provided by GenScape and daily natural gas delivery data from Oil Price Information Service (OPIS) PointLogic, we estimate that energy-related CO2 emissions continued to decline in 2017, but at a slower pace. Our preliminary estimate is a 1% year-on-year decline.
All the Progress is in Power
Between 2005 and 2016, almost 80% of the reduction in energy-related CO2 emissions in the US came from the electric power sector. Improved efficiency of buildings and appliances has helped flatten electricity demand, and coal has lost market share to lower-carbon natural gas and zero-carbon renewables. That trend continued in 2017. Electricity demand fell in absolute terms last year, and coal continued to lose ground to alternative sources of power generation. The one big difference relative to previous years was that natural gas and coal generation both declined year-on-year, displaced by growth in hydro, wind and solar generation. Between January and October, for example, coal and natural gas generation fell by a combined 138 million kWh relative to the same period the year prior, while renewable generation expanded by 75 million kWh (Figure 1). Natural gas generation fell further than coal despite a net addition of 3.8 GW of new gas generation capacity, due to higher gas prices earlier in the year. This balance changed during the last two months of 2017, with coal generation falling faster than gas, but both ended the year down relative to 2016 levels.

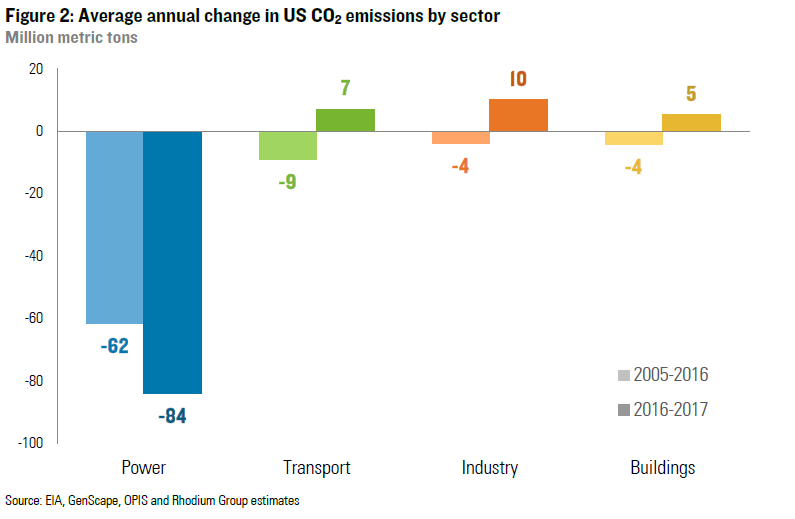
As a result of declining demand and this generation shift, power sector emissions declined by more in 2017 than the 2005-2016 annual average (Figure 2), though less than they did during the last two years of that period. However, energy-related CO2 emissions did not fall in other sectors. In fact, they grew – offsetting more than one-quarter of the gains made in electric power.
Transportation Solidifies its Emissions Lead
After a pause following the Great Recession, starting in 2012 vehicle usage in the US once again began to increase. Between January and October of 2017, total vehicle miles traveled in the US were up 1.3% relative to the same period in 2016 (Figure 3). That’s a slower rate of growth than in 2015 and 2016, but when combined with flattening progress on fuel economy, it was enough to result in a modest emissions increase. That makes two years running where transportation emissions exceed power generation emissions in the US (Figure 4).


On Track to Copenhagen, But Still Short of Paris
Assuming no significant changes in non-energy CO2 or other GHG emissions, sustaining last year’s 1% annual decline in energy-related CO2 for the next three years should be sufficient to achieve the US Copenhagen Accord target of a 17% reduction below 2005 levels by 2020. But this pace of decarbonization will still leave the US considerably short of it’s Paris Agreement pledge of a 26-28% reduction from 2005 levels by 2025, as highlighted in our annual Taking Stock report last May. A 1.7-2.0% average annual reduction in energy-related CO2 emissions is required over the next eight years to meet that target, assuming no changes in other gasses. To achieve long-term emissions reductions consistent with the 2-degree temperature target in the Paris Agreement, an even faster rate of decarbonization is required.
Recent climate and clean energy policy developments at the state and city-level policy developments could potentially accelerate last year’s pace of emission reductions, while recent federal regulatory changes could slow that progress. We will be releasing an updated Taking Stock report this spring that attempts to net these two competing trends out with economy-wide GHG emission projections under a range of energy price, technology cost, and macroeconomic growth scenarios.
For our full assessment of US progress toward emissions targets see Taking Stock 2018