State Contributions to Recent US Emissions Trends
Recent EPA data offers a first look at how state-level greenhouse gas emissions have changed over the past few years, and who is responsible for the sharp decline in US emissions between 2010 and 2012.
Two government reports released last week confirmed 2012 was a particularly good year for the US when it comes to greenhouse gas (GHG) emissions. The Energy Information Agency (EIA) published final 2012 data showing energy-related carbon dioxide (CO2) emissions declined 3.8% last year to their lowest level since 1994. And the EPA released facility-level data for 2012 from the mandatory Greenhouse Gas Reporting Program (GHGRP) covering all major industrial sources and all greenhouse gases. These firm-level numbers show a similar decline to the aggregate EIA estimates. Emissions from reported sources dropped 4.5% in 2012, led by an impressive 5.9% drop in emissions from power plants. This trend began appearing in EIA’s monthly data more than a year ago (see here and here). But the EPA data released last week offers a first look at how state-level emissions have changed over the past few years, and who is responsible for those nation-wide trends.
Leaders and laggards: In the electric power sector, the largest year-on-year decline in CO2 emissions by volume occurred in Texas, followed by Ohio, Georgia, Indiana and Alabama. These states accounted for roughly half the all 2012 reductions nation-wide. Growth in oil and gas system and industrial emissions offset more than half the decline in power plant emisisons in the Lone Star State, however. Combine all sectors and gases included in the GHGRP data and Ohio comes out on top, followed by Georgia, Pennsylvania and Indiana. Reported emissions rose in 13 states last year, with the biggest gains by far occurring in California.
Warm weather and cheap gas: As we’ve noted in the past, mild weather and low-cost natural gas were the primary drivers of the nation-wide emissions decline in 2012, and this comes through loud and clear in the state-level data. Texas, Ohio, Georgia and other states that delivered large emission reductions did so thanks to a weather-related decrease in electricity demand and a switch from coal to natural gas in power generation. The biggest increase in gas-fired power generation actually occurred in California. But this was due to the shut down of the San Onofre nuclear plant and a drop in hydropower generation, rather than displacement of coal, and is why California emissions increased.
Looking forward: This divergence in state performance in the EPA data shows that variability in fuel prices and weather patterns can have a bigger impact on emissions in the short term than state-level energy and climate policy. But variability cuts both ways and colder winter weather and higher natural gas prices this year have already unwound much of 2012’s emission reduction gains. Achieving medium and long-term emission goals will require new policy action, either from Washington or the States.
About the Data
Last Monday’s EIA report provides final economy-wide estimates of CO2 emissions from fossil fuel combustion in the energy sector in 2012. Media coverage of the report highlighted the report’s finding that energy-related CO2 emissions fell 3.8% in 2012 to their lowest level since 1994, though that wasn’t particularly new information. EIA publishes regular emissions estimates as part of its Monthly Energy Review, and released its first full-year 2012 estimate in March, showing a 3.7% year-on-year decline.
More interesting was EPA’s release, two days later, of the facility-level data that major industrial emitters are now legally required to provide to EPA under the GHGRP. EPA’s annual Greenhouse Gas Inventory is the official tool for measuring economy-wide GHG emissions. Compiling a robust inventory is a complicated affair, however, and as a result official data often lags by over a year. The 2012 GHG inventory won’t be available until April of 2014. Facilities reporting emissions under the GHGRP account for the majority of US emissions, however, offering an early look at economy-wide GHG emissions totals. And the GHGRP provides a wealth of sectoral and geographic information not available in either the EIA data or the official EPA GHG Inventory.
Launched in 2010, the GHGRP includes self-reported emissions from over 8,000 facilities and suppliers, covering 9 industry sectors, including power plants, oil and gas production and refining, iron and steel mills, and landfills. The mandatory reporting program covers large facilities that emit at least 25,000 metric tons of GHGs per year (measured in tons of carbon dioxide equivalent or CO2e); suppliers of certain products that would result in GHG emissions if released, combusted or oxidized; and facilities that inject CO2 underground for geologic sequestration. As the program evolves, additional sources and facilities are incorporated. In 2011 EPA added several additional sectors, including petroleum and natural gas, bringing the total number of source categories to 41.
The GHGRP data released last Wednesday includes estimates of CO2 and other major greenhouse gases (methane, nitrous oxide, and fluorinated gases) emitted directly from reporting facilities in 2012. This includes most power plants, oil and gas operations, industrial facilities and landfills in the country but excludes vehicle emissions and most emissions from the direct combustion of coal, oil or natural gas in the residential and commercial sectors (these sources fall below the 25,000 metric ton threshold). Emissions associated with electricity consumed in the residential and commercial sector, however, are captured through power plant reporting. Most states that have GHG goals or caps, like California, account for emissions produced by in-state facilities but also those associated with electricity purchased out-of-state. The EPA numbers don’t capture this dynamic and therefore do not necessarily provide the full picture for assessing a state’s progress toward its GHG goals.
In 2011, direct emissions reported through the GHGRP captured roughly half the economy-wide emissions in the EPA GHG Inventory. For the power generation and petroleum and natural gas systems, the 2011 GHGRP data covered more than 95% of economy-wide emissions, and for industrial and waste-related emissions it covered roughly two-thirds. So the 2012 GHGRP data just released provides reasonably robust estimates of how stationary source emissions have changed, but provides no insight into mobile sources.
Headline Results
Reported direct GHG emissions fell 4.5% in 2012, to 3,129 million metric tons (mmt) CO2e (Table 1). Power plants, which account for more than one-third of economy-wide GHG emissions in the US and two-thirds of direct emissions reported through the GHGRP, fell by 5.9% or 132 mmt of CO2e. That comes on top of a 4.7% year-on-year reduction in 2011 for a combined 10.3% drop in emissions between 2010 and 2012 (Table 2). CO2 accounts for more than 99% of reported power sector GHG emissions and the 10.3% decline in the GHGRP data is right in line with the economy-wide change in power sector emissions reported by the EIA.
Reported industrial sector emissions fell as well in 2012, by 3% or 22 mmt relative to 2011. Waste emissions rose slightly. Petroleum and natural gas emissions posted the largest gains, up 3.3% year-on-year in 2012. That’s still pretty modest, however, given that oil and gas production rose 8.5% during the same period. Interestingly, the increase in petroleum and natural gas emissions was driven entirely by CO2. Emissions of methane (CH4), a more potent greenhouse gas, actually decreased 1.4%. It is difficult to tell if these results reflect changes in emissions or variation in methods used to monitor and calculate emissions across years. EPA’s mandatory reporting rule prescribes uniform methods to calculate GHG emissions, but in some cases leaves it up to the facility-owners to decide whether to use direct measurement, engineering estimates or emission factors as the basis for their emissions calculations. As companies adjust to the new GHG reporting rules, EPA also allows the use of “alternative methods for determining inputs to calculate emissions.” In 2012, the EPA notes that as much as a third of companies opted to use alternative methods.
Leaders and Laggards
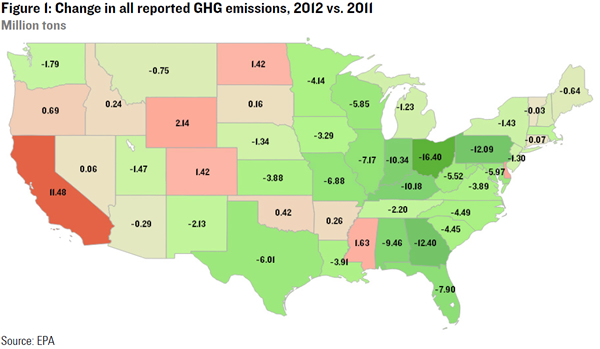
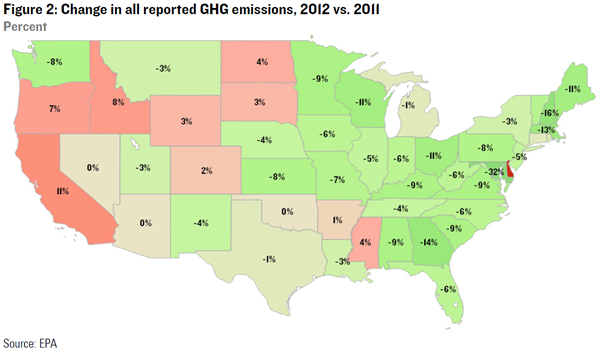
Geographically, the sharp decline in US emissions in 2012 was not distributed evenly. Nearly 90% of the reduction occurred east of the Mississippi River, an outsized contribution given that those states accounted for only half of reported direct emissions in 2011 (Figure 1 and Table 3). In tonnage terms, the biggest reductions occurred in Ohio, Pennsylvania and Georgia, with Indiana, Kentucky and Alabama not far behind. In percentage terms, the steepest declines were in DC, Maryland and New Hampshire (Figure 2).
Emissions rose in 13 states. California posted the largest gains in tonnage terms by far, and second largest gains in percentage terms after Delaware. This may come as a bit of a surprise, given California’s leadership on climate policy at the state level, with a functioning cap-and-trade system and some of the most aggressive renewables and efficiency incentives in the country. We discuss the drivers of this increase below. Wyoming, Colorado, North Dakota and Mississippi posted relatively large gains by tonnage, while emissions in Oregon and Idaho increased significantly in percentage terms.
Warm weather and Cheap Gas
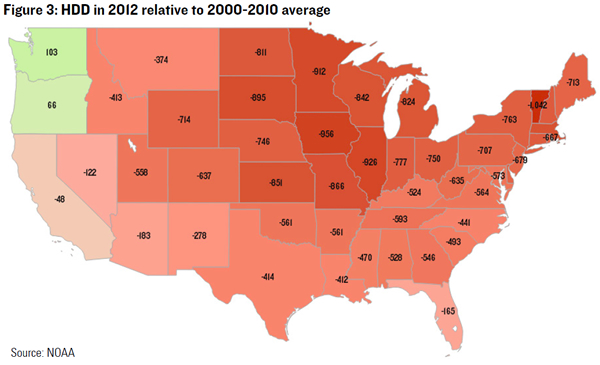
As we’ve mentioned before, winter was unusually mild in 2012, which depressed demand for heating in residential and commercial buildings. That mild weather was not evenly spread throughout the country, however. And from an energy standpoint, warm winters have a far greater impact in the Midwest and Northeast where heating needs are greatest, than in the South or the West.
Figure 3 maps the heating degree day (HDD) difference between 2012 and the 2000-2010 average, using data from the National Oceanic and Atmospheric Administration (NOAA). With the exception of New Hampshire, heating demand was most depressed in the Midwest. Less heating demand means less power generation, which explains part of the decline in reported emissions in 2012. Natural gas is used for residential and commercial heating as well. And lower end-use demand for gas helped depress gas prices, which contributed to the widespread fuel-switching away from coal in the electric power sector already underway thanks to rapid natural gas production growth, further reducing CO2 emissions from power generation.
According to EIA’s Electric Power Monthly, the biggest decline in coal-fired power generation in 2012 occurred in Texas. That explains the 17.8 mmt reduction in electricity sector CO2 emissions – the sharpest drop in the country – reported through the GHGRP (Figure 4 and Table 4). Higher oil and gas and industrial emissions offset most of these gains, leaving the Lone Star State with a 6 mmt reduction in reported GHG emissions overall (Figure 1 and Table 3). Ohio and Georgia saw the second and third largest drops in coal generation and power sector CO2 emissions. Along with Indiana and Alabama, these five states accounted for half the nation-wide reduction in reported power sector CO2 emissions in 2012.
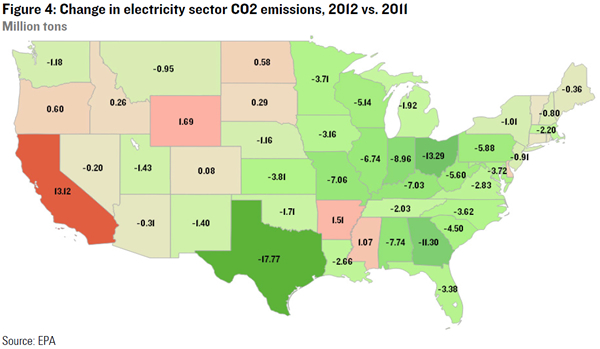
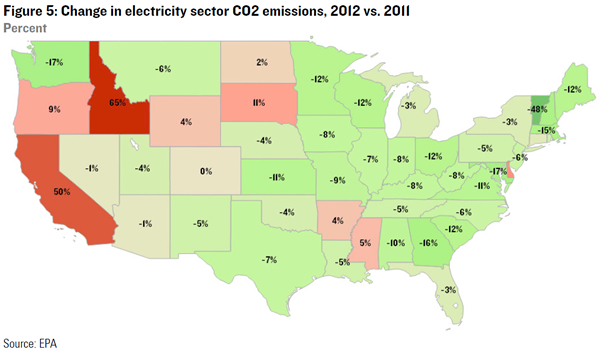
While these states saw large increases in natural gas-fired power generation in 2012, the biggest change occurred in California (Figure 6). But instead of displacing coal, in California gas was used to make up for a sharp drop in nuclear power generation after the San Onofre power plant was closed for repair and a decline in hydro generation following a particularly wet 2011. As a result, reported CO2 emissions in California from the electric power sector rose by 13 mmt in 2012, or 50% (Figure 5). It’s important to note that California gets roughly one third of its electricity from out of state, the emissions from which are reported in the state in which the generation occurs. The California numbers reported in Figures 4-6 and Table 4 cover in-state generation only. The normalization of hydro in 2012 caused year-on-year emissions increases in Oregon and Idaho as well. In Washington, higher nuclear output offset the decrease in hydropower. Reported CO2 emissions from the electricity sector also rose in Arkansas, Colorado, Delaware, Mississippi, North Dakota, South Dakota and Wyoming.
Looking forward
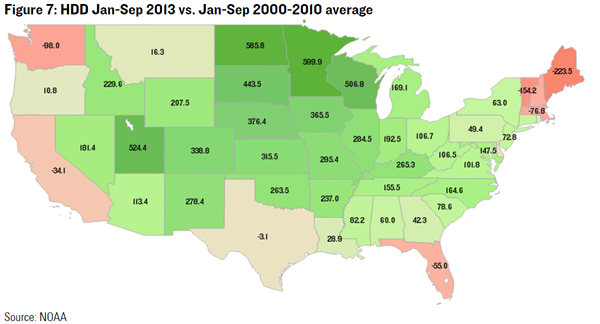
The divergence in state-level performance discussed above demonstrates the importance of variation in fuel prices and weather patterns in determining short-term emission trends. And that variability cuts both ways. As we’ve noted in the past, the twin drivers of the 2012 decline – warm weather and cheap gas – have fallen away in 2013. HDDs have not only returned to normal but are running 4% above the 2000-2010 average nation-wide so far this year (Figure 7). Colder winter weather in 2013 has been concentrated in the Midwest, where the weather-related emissions decline was greatest in 2012.
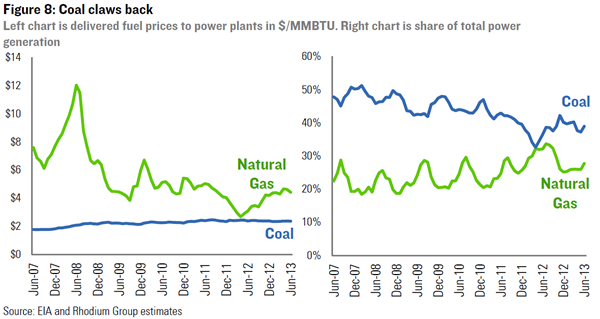
Higher heating demand has contributed to modest growth in power generation in the Midatlantic, Mountain region and much of the Midwest in 2013, though year-to-date electricity demand growth has been pretty flat nation-wide. And greater residential and commercial demand for natural gas and slowing production has also helped push up natural gas prices, which has allowed coal to claw back some of the market share it lost in 2012 (Figure 8).
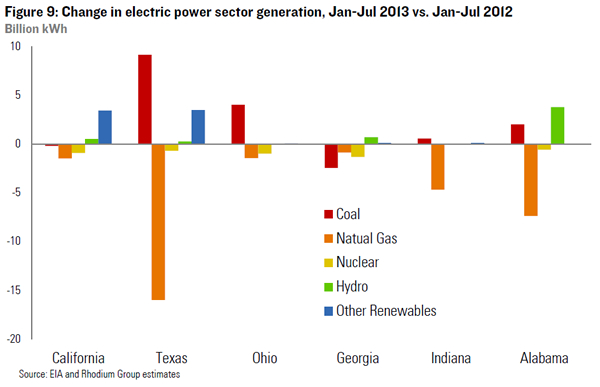
This is particularly true in Texas where coal demand in the power sector is especially sensitive to the price of natural gas. Based on January-July EIA data, Texas is on track to unwind most, if not all, of the coal-gas switch that occurred in 2012 (Figure 9). While non-hydro renewables are growing rapidly, the increase in coal-fired power generation and industrial and oil and gas production means the state’s reported emissions will likely be meaningfully higher in 2013. Ohio has also seen a rebound in coal-fired power generation, though due primarily to a recovery in overall demand rather than a move away from gas. Coal has continued to lose market share in Georgia, while recovering modestly in Indiana and Alabama. Beyond the states listed in Figure 9, Wisconsin, Pennsylvania, Illinois and Virginia have experienced the largest coal-fired power generation gains so far this year while North Carolina and South Carolina have seen the sharpest declines.
For California, 2013 doesn’t look much better than 2012. Hydro generation has remained at last year’s levels and the San Onofre plant is going to be permanently decommissioned. The state is experiencing rapid growth in non-hydro renewables, particularly solar, and that’s displacing some natural gas-fired generation. But for this year and next, in-state stationary source emissions look like they will stay pretty close to where they were in 2012. California is in the process of moving away from long-term supply contracts with out-of-state coal-fired generators, but the resulting emission reductions (provided that power is not just resold elsewhere) will show up in the state-level data where the generator is physically located.
Yet while California’s recent emissions performance is the worst in the country, it’s energy and climate policies are arguably the most ambitious. And over the medium and long-term, policy will matter much more than variation in fuel prices and weather patterns. The question now is whether that policy is implemented successfully and whether other states follow suit – either through state-level legislative initiatives or State Implementation Plans (SIPs) developed to comply with forthcoming EPA regulations on existing stationary emission sources. And the sharp decline in in coal-related emissions in 2012 in the Gulf Coast, Midwest and Southeast provide useful insight into the kind of impact such policies could have.