Taking Stock 2017: Trump’s Regulatory Rollback Begins
In this report we update our Taking Stock analysis to include recent energy market developments and the impact of President Trump's executive order rolling back many of the Obama administration's climate policies.
The wait is over. Tomorrow, President Trump releases his long anticipated Executive Order annulling Obama’s Climate Action Plan and rolling back many of the underlying policies, including its centerpiece, the Clean Power Plan. Last year in our Taking Stock report, Rhodium Group quantified the impact of all climate policies adopted or proposed by the Obama administration on US greenhouse gas (GHG) emissions. In this report we update that analysis to include recent energy market developments and the impact of tomorrow’s Executive Order (EO).
The Starting Point
Over the past eight years the US has made impressive progress on climate. According to EPA’s draft inventory released last month, US GHG emissions were 11% below 2005 levels in 2015. Carbon dioxide (CO2) emissions are at their lowest level in a quarter century – 15% below 2005 levels in 2016 based on preliminary data from the EIA. Both policy and market forces have contributed to this decline. Low cost shale gas has eroded coal’s market share in power generation, as has renewable energy boosted by state renewable portfolio standards, federal tax credits and impressive cost declines. Fuel economy standards for cars and light trucks and building codes and appliance efficiency standards have reduced energy demand, and resulting emissions, as has slower than expected economic growth and electricity demand.
As discussed in our Taking Stock report last year, policies outlined in President Obama’s Climate Action Plan put the US in striking distance of its Copenhagen commitment of a 17% reduction below 2005 levels by 2020. But even with the Clean Power Plan, stringent methane standards for new and existing oil and gas sources, and ambitious plans to phase down hydrofluorocarbons (HFCs) under the Kigali Amendment to the Montreal Protocol, more would have been required to meet the 26-28% reduction pledged in Paris by 2025.
We have updated our analysis to include energy market developments over the past year as reflected in EIA’s most recent Annual Energy Outlook forecast and find that the Climate Action Plan policies would have achieved reductions of around 21% below 2005 levels in 2025. That leaves a sizeable gap for the new Administration to close. During the 2016 presidential campaign, Hillary Clinton pledged to close this gap through a combination of federal pollution and efficiency standards, competitive grants to states, cities and rural communities that exceeded those standards, and public investments in low-carbon infrastructure and innovation. President Trump promised to undo the Climate Action Plan and “cancel” the Paris Agreement. Tomorrow, President Trump is releasing an Executive Order (EO) intended to demonstrate his commitment to follow through on the first of those promises.
Trump’s Executive Order
The EO won’t be out until Tuesday morning, but the White House held a press call with reporters tonight to preview its content. Based on reporting of the call, the EO will call on EPA to revisit both the carbon pollution regulations on existing power plants (the Clean Power Plan) and new power plants. The EO will also reportedly direct both EPA and BLM to review methane regulations for oil and gas production. It will lift the moratorium on federal coal leasing, rescind the Obama Administration’s NEPA guidance for how agencies should factor climate change into environmental reviews, and will revisit how the Social Cost of Carbon is calculated.
It’s important to note, the EO itself won’t directly impact US emissions. Rather, it will direct federal agencies to take regulatory action, action that may be subject to court challenge. It’s also not yet clear whether “revisiting” or “reviewing” Obama-era climate policies like the Clean Power Plan will result in complete elimination. What is the potential impact on emissions if the EO directives are successfully implemented and the targeted Obama administration policies are fully eliminated?
As this EO has been weeks in the making, we’ve had time to model a range of possible scenarios. We model energy-related CO2 emissions in RHG-NEMS, a version of the EIA’s National Energy Modeling System maintained by RHG. We employ complementary models to assess the impact of policies targeting other GHG emissions like methane regulations on oil and gas production. We have included here the policy scenario that matches what’s reported to be in the EO. We will update our analysis tomorrow if anything changes.
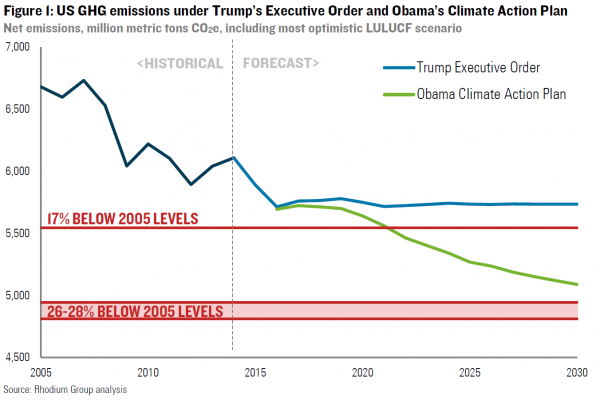
Figure 1 compares US GHG emissions under a fully-implemented Trump EO to those anticipated under Obama’s Climate Action Plan. Despite the rollbacks called for in the EO, we expect relatively little impact on emissions over the next couple years, given the lag in policy implementation (or policy removal). But by 2019, a gap begins to open up. Whereas emissions would have continued to decline under the Climate Action Plan, under Trump’s EO GHG emissions stabilize at around 14% below 2005 levels – a little shy of the Copenhagen Accord commitment. That level holds through 2030, however, leaving the US pretty far from the 26-28% Paris commitment in 2025 and nowhere close to what is considered necessary to meet global climate goals in 2030.
Of course the Trump administration could go much further toward dismantling Obama era climate progress than was explicitly referenced in the EO. There are a number of actions, either through executive action or with the help of Republicans in Congress that a Trump administration could take, which we have not reflected in our analysis. This includes: failure to phase down hydrofluorocarbons (HFCs) under the new Kigali amendment to the Montreal Protocol; watering down the Phase II heavy-duty vehicle standards adopted last year; lowering CAFE standards after 2021 as the auto industry has called for, failure to develop new building codes and appliance standards; failure to enforce the Renewable Fuels Standard (RFS); changes to the volatile organic compound (VOC) rule for oil and gas production; and standards that control methane from new and existing landfills. Trump could also open up vast amounts of new federal land to fossil fuel production. He could also push Congress to prematurely end the Production Tax Credit (PTC) for wind and Investment Tax Credit (ITC) for solar, though there appears to be relatively little Congressional appetite to do so.
It could be worse (or slightly better)
Predicting the future is hard, of course, and a lot could change over the next few years. Future policy actions of the Trump administration, both domestic and international, are particularly hard to predict and have the potential to significantly impact emissions. As we’ve cautioned before, starting a trade war with China or bombing Iran will likely reduce emissions. If he somehow succeeds in pushing US economic growth to 5 or 6%, emissions will increase.
In our estimates above, we held macroeconomic and energy price assumptions constant and aligned with EIA’s 2017 Annual Energy Outlook forecast to isolate the impact of policy changes embedded in the EO. However, changes in the cost and availability of natural gas and renewable energy can have a big impact on emissions. If the US natural gas resource base is larger and cheaper than currently believed, prices will be lower than currently projected, leading to displacement of more coal in the power sector and increased gas consumption in end-use sectors. The converse, where the gas resource base is smaller and more expensive, would enable coal plants to be more competitive and reduce gas consumption in buildings and industry.
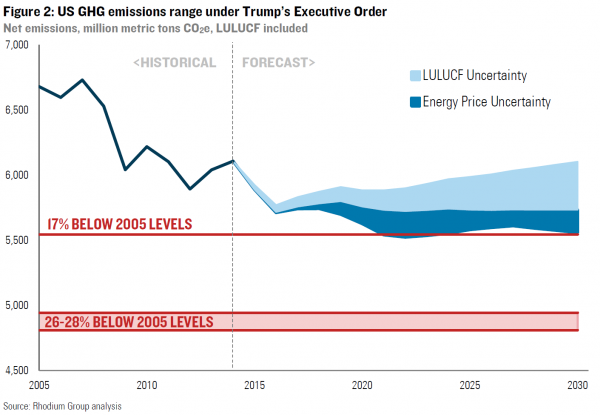
To capture a range of energy price futures, we explored a number of renewable and natural gas market scenarios. This includes an expansion of the US natural gas resource base large enough to keep prices at current levels through 2025, as well as a reduction in the gas resource base that pushes up prices to roughly double current levels by 2025. We also explored the emissions impact of National Renewable Energy Lab’s (NREL) most optimistic renewable energy costs projections, in which wind and solar cost 23% and 60% less, respectively, in 2025 than in EIA’s 2017 Annual Energy Outlook. This energy price uncertainty is captured in Figure 2 below.
Another wild card is whether American forests are able to maintain their historically high rate of carbon sequestration. In 2014, over 11% of total US GHG emissions were offset as forests and other lands absorbed carbon from the atmosphere. Recent studies suggest that as a result of changing land-use patterns and the effects of climate change itself, over the long-term US forests may absorb carbon at a slower rate. There is significant uncertainty, however, about when such slowing will occur. In its 2016 Biennial Report, the Obama administration addressed this issue by projecting a range of land use, land use change and forestry (LULUCF) emissions and removals out to 2030.
In the estimates discussed above, we assume the most optimistic end of that range, in which forest area and carbon sequestration continue to grow out to 2025. To capture the full range of LULUCF uncertainty we also consider the more pessimistic scenario, in which forest area and forest carbon begin to decline after 2020. When energy price and LULUCF uncertainty is added to our EO policy projection the full uncertainty band is 406 MMt CO2e in 2025, growing to 546 MMt CO2e by 2030 (Figure 2).
Assuming the most optimistic LULUCF and policy assumptions hold, cheaper natural gas and renewables could bring total emissions down enough to come very close to meeting America’s Copenhagen target in 2020. But the US would still be short of its Paris target in 2025 with emissions only 16% below 2005 levels. And in 2030, emissions would only be 17% below 2005 levels. If forest and land use trends move in the opposite direction, with less than optimal sequestration, it would more than offset the benefit of cheaper gas and renewables. If all factors go in the wrong direction, emissions could end up only 10% below 2005 levels in 2025 and 9% by 2030.
The New Face of Climate Leadership
This new Trumpian emissions future is not yet baked in. Many elements in Trump’s EO will likely be challenged in the courts once translated into specific regulatory actions. But it will largely fall to states, cities and corporates to be the driving force of US climate action. Well-designed and well-coordinated action in states and cities could play a meaningful role in offsetting some federal policy-enabled emissions growth, particularly in the transportation and buildings sectors. Corporate renewable energy procurement can help continue to reduce power-sector emissions. Increased philanthropic, corporate and mission-driven investment in innovation, carbon removal and agricultural emission reductions also hold promise. It likely won’t be enough to substitute for federal leadership, but it can help limit the damage. On this front, Trump’s EO may prove to be a call to action.

