China and the Future of Global Supply Chains
We review China’s role in four major sectors—apparel, consumer electronics, PV, and autos—over the past decade, then consider four plausible scenarios to 2030 and their implications for China’s future role in global trade and investment patterns.
Executive summary
Rumors of globalization’s death are greatly exaggerated. Even after decades of fast-paced expansion, China’s weight in global production and exports continues to grow on the back of heavy-handed industrial policies and deep domestic imbalances. But after a long period of accommodation, trading partners are pushing back, concerned about their own industrial bases, jobs, and supply chain security. Some are erecting trade barriers, others are prioritizing the “de-risking” of strategic supply chains. However, these policies are running up against the incredible efficiency of China’s manufacturing sector, as well as excess capacity buildup since the outbreak of COVID-19.
At the margins, the structure of global trade is changing. Global supply chains are adapting to new geopolitical realities. Countries are fighting to create or save their manufacturing jobs, investing billions to strengthen their technological edge, and using new tools to shape global trade and investment flows to their advantage. Ongoing and upcoming policies—in the US and beyond—could further reshape global production and trade patterns.
At this important juncture, we look back and ahead. We review China’s role in four major sectors—apparel, consumer electronics, solar photovoltaics (PV), and autos—and associated supply chains over the past decade. We then look forward to four plausible scenarios to 2030 and their implications for China’s future role in each of these sectors, as well as for global trade and investment patterns more broadly.
Aggregate findings
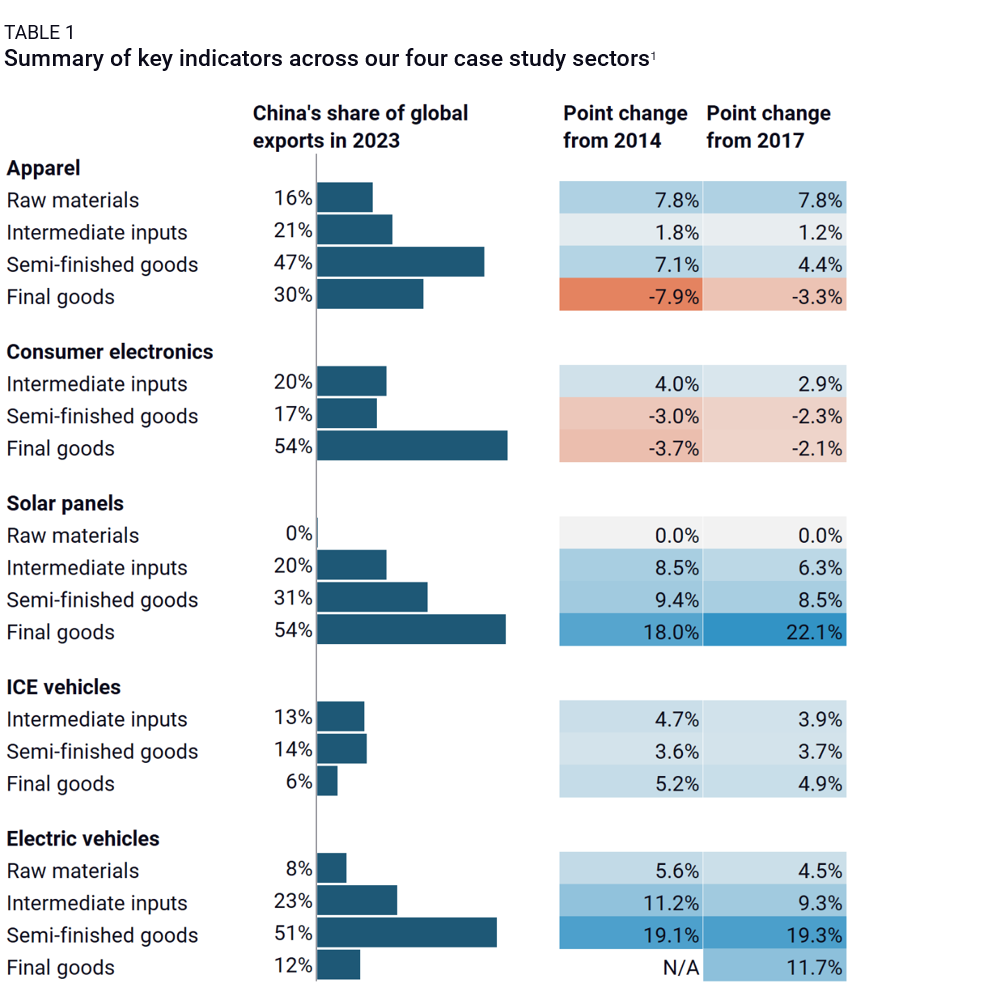
- China has gained global export and manufacturing share in all four sectors over the past decade at the expense of other producers (Table 1). While the US’s “China shock” happened over a decade ago, Germany and Japan have suffered significant, systematic declines in global market share across sectors and supply chain steps from China’s manufacturing expansion in the past ten years. South Korea, Central and Eastern Europe (CEE), and Mexico have been more resilient. They benefited from the past seven years of US policy pushback, but pressure is building from low-priced Chinese inputs.
- Some production has relocated outside China since the start of the US-China trade war in 2017, but at varying scale and speed depending on the sector (see our sectoral takeaways below). Apparel and electronics have seen more movement out of China than automotives and solar. Much of that relocation has benefited emerging markets (EMs)—first and foremost in Asia—rather than advanced economies, with one exception: the US under the Inflation Reduction Act (IRA). Most striking, however, is China’s resilience as a producer of inputs and finished goods for the world, despite quickly rising costs in the country and growing trade and other barriers globally.
- In many sectors, labor cost considerations seem to have taken a backseat to production and logistical efficiency. Today, no country can replicate China’s highly optimized production ecosystem at scale, so firms remain slow to relocate to alternative production hubs, even in lower-tech, lower-value-add sectors such as apparel.
- As a result, policy is becoming a core driver of diversification outcomes. Indian and Vietnamese incentives to attract electronic manufacturing have driven large-scale investments by major MNCs that in turn played a crucial role in driving manufacturing relocation. A range of more drastic US policy decisions kick-started significant movement in global production of solar PVs. Finally, trade integration underpinned much of the past decades of auto supply chain regionalization, as well as more recent decisions to expand apparel production in Egypt and Turkey.
- Diversification from China almost always involves Chinese companies. Chinese firms lead FDI in manufacturing in Southeast Asia and are growing their footprint in Mexico, CEE and North Africa. They also remain the top intermediate input and semi-finished goods suppliers for many MNCs. This complicates efforts to reduce dependency on China by blurring the definition of a “Chinese good” and can spark tensions between the US and diversification partners that benefit from Chinese FDI. It also gives the Chinese government leverage over the pace and extent of de-risking, as seen with Beijing reportedly prohibiting automakers from investing in India and restricting Chinese Foxconn employees from transferring to iPhone factories in India.
- Diversification has concentrated in a few countries, with Vietnam topping the list for all sectors in our study except autos. This concentration has been positive in the short run. Vietnam has offered manufacturers—Chinese and non-Chinese—an easy and practical way out of China. But Vietnam’s centrality will be a liability in the long run. It will likely come under increasing scrutiny from the new US administration and an over-concentration of manufacturing activity in the country will put pressure on its human, logistical, and energy resources. Electronics suppliers, as a matter of fact, are already being asked to diversify manufacturing beyond Vietnam.
- Diversified production capacity remains fragile. China’s dominance of various supply chains means it has become a global price maker in many industries. Hence, China’s market share losses can reverse over time, especially in contexts of overcapacity, high inventories, and producer price declines in China. China’s extremely stable production environment offers an easy fallback for more volatile emerging market environments (e.g. Bangladesh after a power supply and currency crisis in 2022). Relocation of production to smaller markets can also create inflationary pressures that quickly upend diversification momentum.

Sectoral findings
Apparel sector
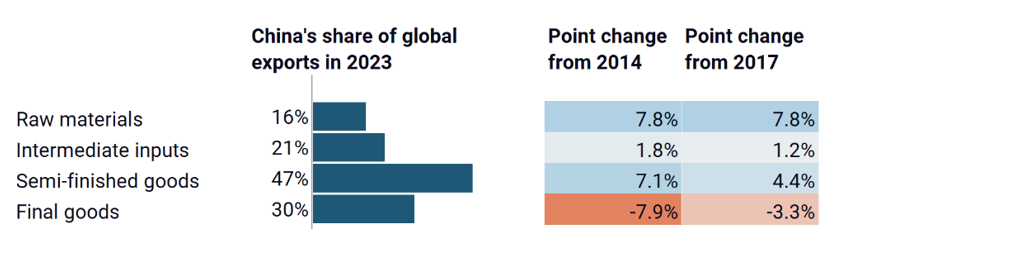
- China’s share of global apparel production and exports has been sliding for more than 15 years on the back of fast-increasing labor costs in China.
- Since 2020, however, China’s contribution has plateaued amid broad-based production capacity expansion during the pandemic.
- China still dominates global production and exports of apparel and textile inputs, with global export shares of close to a third and a quarter, respectively. This is despite the sector’s cost sensitivity and US policy action, including tariffs and the Uyghur Forced Labor Prevention Act (UFLPA).
- Countries in South Asia, Southeast Asia, and the Middle East and North Africa (MENA) could pick up momentum, especially if the US maintains or further increases tariffs on China-origin apparel. Their success in attracting production will depend on their ability to increase production efficiency and keep labor costs in check as local capacity grows.
Consumer electronics sector
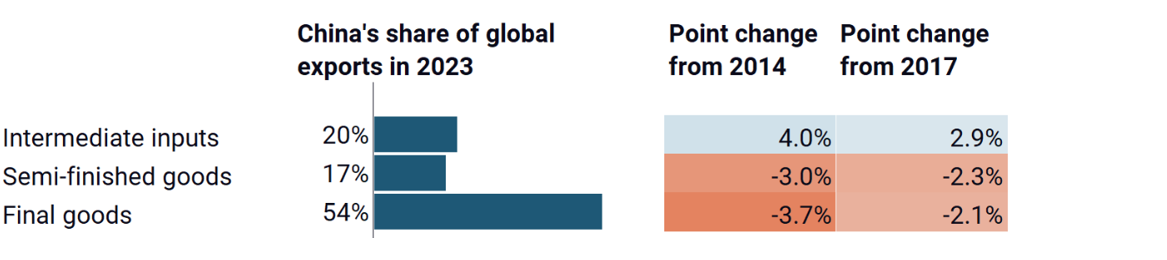
- Of our four case study sectors, China’s global production and export shares are highest in consumer electronics. For over 15 years, China has exported more laptops, tablets, and mobile phones than all other countries combined. Yet electronics is the only sector where China’s contribution to global exports decreased not just in final assembly but also in upstream segments since 2014.
- A few final assembly hubs have gained importance in recent years as government incentives and commitments from major companies reduced the cost and risk associated with diversification. That this happened despite such dominance from China is no small feat.
- Barring major US tariffs on both countries’ exports, Vietnam and India’s mobile phone assembly boom, a key driver of that diversification, seems poised to continue. This will provide a solid foundation to kick off laptop production capacity going forward.
- While these emerging production hubs still rely heavily on Chinese components, a range of countries like Malaysia and Singapore are also emerging as specialized component producers and offering relocated business with sourcing alternatives.
Solar PV sector
- In the solar industry, China’s role is dominant and still increasing along most of the supply chain. Sizeable Chinese state support and a massive market have given Chinese solar firms a price and technical advantage that gets harder and harder to challenge over time.
- Yet policy action—namely US tariffs and UFLPA polysilicon restrictions—has created a clear and drastic splintering of final assembly activity between Southeast Asian and Chinese production.
- Much of that relocation is still built off Chinese inputs and capital, but deeper supply chains are also developing in ASEAN to serve US-bound production and avoid further US restrictions. This will support continued diversification of US solar PV sourcing and supply chains away China.
- The US will likely remain an exception. More likely than not, China will remain the main source of solar PV imports for the foreseeable future in other major markets like the EU due to the price and technical competitiveness of Chinese solar PV and the absence of credible local alternatives or restrictive policies.
Automotive sector
- Building off a massive internal market and first mover advantage in EVs, China—a net car importer as recently as 2022—has become a major manufacturer and exporter of auto parts and finished vehicles in the last three years.
- China’s emergence as an auto hub calls into question historical industry patterns, including the appeal of supply chain regionalization. China’s subsidies, price and technical advantage, and overcapacity in parts of the industry keep Chinese vehicles and components cost-competitive despite shipping costs, localization advantages, and trade barriers.
- The sector, often a major contributor to local employment, is poised for disruption. Policy moves in Europe and especially the US aim to maintain and strengthen regionalized (if not domestic) supply chains, as a means to preserve local employment and boost domestic industries.
- Mexico and Central and Eastern Europe, which have already grown as core links in global auto supply chain over the past 20 years, have the most potential (e.g. existing skills and production capacity) to pick up export shares from China. But US tariffs, if imposed, and pressure on Mexico to review its rules of origin and scrutinize Chinese inputs and investment could act as a brake. The US’s ability to regain ground in global auto manufacturing will hinge on IRA policy preservation or repeal.
Short-term outlook
Within two weeks of his return to the White House, US President Donald Trump reignited global trade tensions by threatening of 25%tariffs on most US imports from Mexico and Canada, and imposing tariffs of 10% on US imports from China. Trump also promised tariff action against the European Union, among many other threats formulated against main US trade partners. It is still unclear whether these tariffs will remain in place or rather be used as chips in a broader set of bilateral negotiations. In any case, Trump’s second mandate marks a new inflection point in the restructuring of international supply chains.
As our baseline for the next 12-18 months, we expect the following:
- Much of the range of policy grievances laid out in the White House’s America First Trade Policy Memo (AFTPM) take clear aim at China. This leads us to believe that the US administration could well impose additional tariffs on China on or after April 1. We would also expect Washington to impose tariffs on Europe, and possibly on select Asian countries that display significant trade surpluses with the US (think Vietnam, or India). Some of these tariffs might be lifted, if and when bilateral deals are reached, but some might also stay on, especially where they are meant to correct structural trade imbalances between the US and its trade partners. We expect some level of added China tariffs to stick, as a US-China trade deal appears less credible today than it was six years ago.
- Ultimately, the most important driver of change in global supply chains will be the gap between China tariffs and tariffs on the rest of the world. A small China-emerging market tariff gap would disincentivize shifting supply chains out of China. Low universal tariffs would probably do little to reshape global production networks. High universal tariffs would prompt relocation to the US in select higher-tech industries, but stifle diversification to other destinations and spur high inflation in the US. In contrast, highly differentiated tariffs on China compared to other emerging markets (e.g. 60% vs 10%) would fast-forward current diversification trends and create incentives to rebuild deep supply chains in Asia, Europe, and Latin America.
- Increased scrutiny of China-sourced inputs and the role of Chinese firms (wherever located) in US-bound production will be a key trend to watch, as such actions could slow the pace of diversification. These concerns are clearly laid out in the AFTPM, but it remains unclear what concrete measures will follow. Possible action includes component tariffs, a revision of US rules of origin, and ramped-up pressure on third country governments to create their own CFIUS-like regimes. Full bans on certain China-made or -designed inputs, under Commerce’s broad-ranging ICTS powers, have the potential to drastically splinter of global supply chains. Given these rules were created under the first Trump administration, we expect more cases to unfold in coming months and years.
- US tariffs will divert China exports from the US to the European Union and major emerging markets. Worried about local jobs and industries, Brussels and other capitals will likely seek to insulate themselves through their own set of broad-based trade defense measures. Their efforts, however, will run up against low Chinese prices and a depreciating yuan, a desire (especially in Brussels) to maintain WTO compliance, and local economic hardship that will make it harder to provide financial incentives for diversification. As a result, unless European and third market tariff levels approach US ones, or other non-tariff trade defenses are imposed, these economies are likely to see their dependence on Chinese imports increase rather than decrease in the short run.
- Manufacturing in China will remain attractive. China will continue to support exports as a lever of growth. In the absence of sufficient structural efforts to support consumption, wages are unlikely to rise substantially. China will probably respond to US tariffs by letting the yuan depreciate, further increasing the attractiveness of China-made products and inputs. The question will be the extent of the resulting depreciations in other EM currencies to maintain these markets’ relative appeal.
- Against that backdrop, targeted sectoral policies and measures will continue to re-shape supply chains. Among our four focus sectors, autos will be most affected by (especially US) policies meant to decouple China from global supply chains. The effectiveness of these policies will hinge on the degree of alignment between the US and its main economic partners.
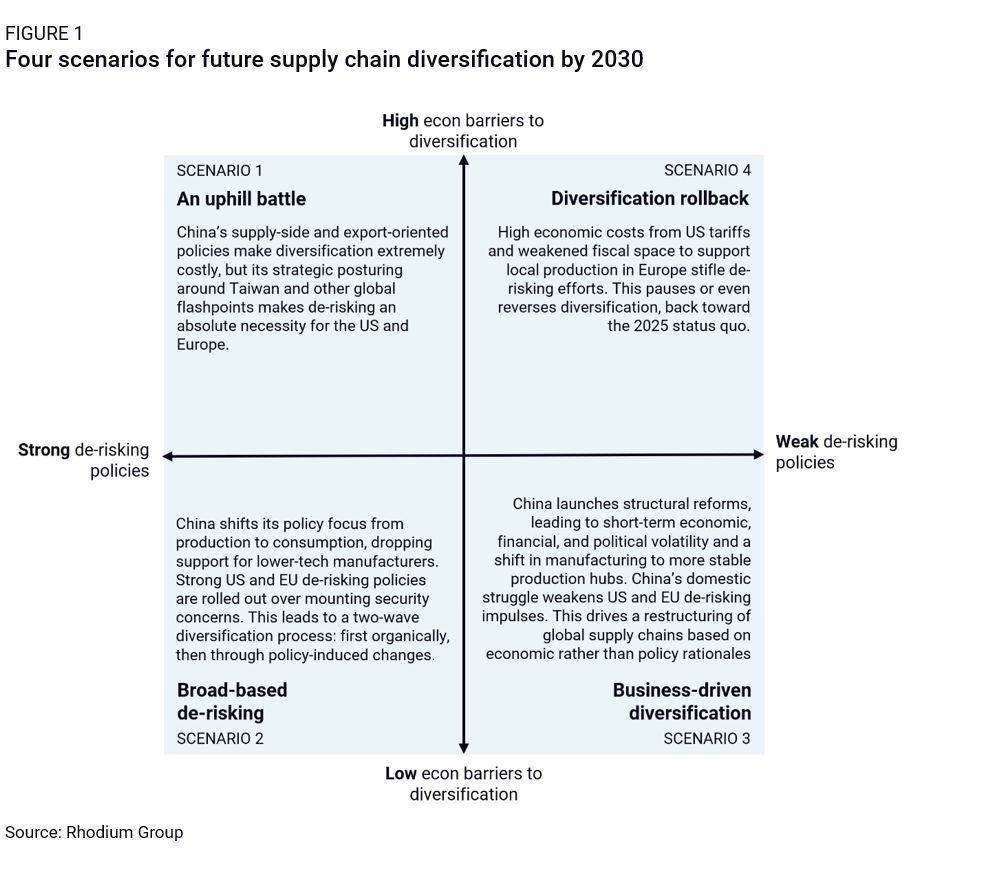
Long-term outlook
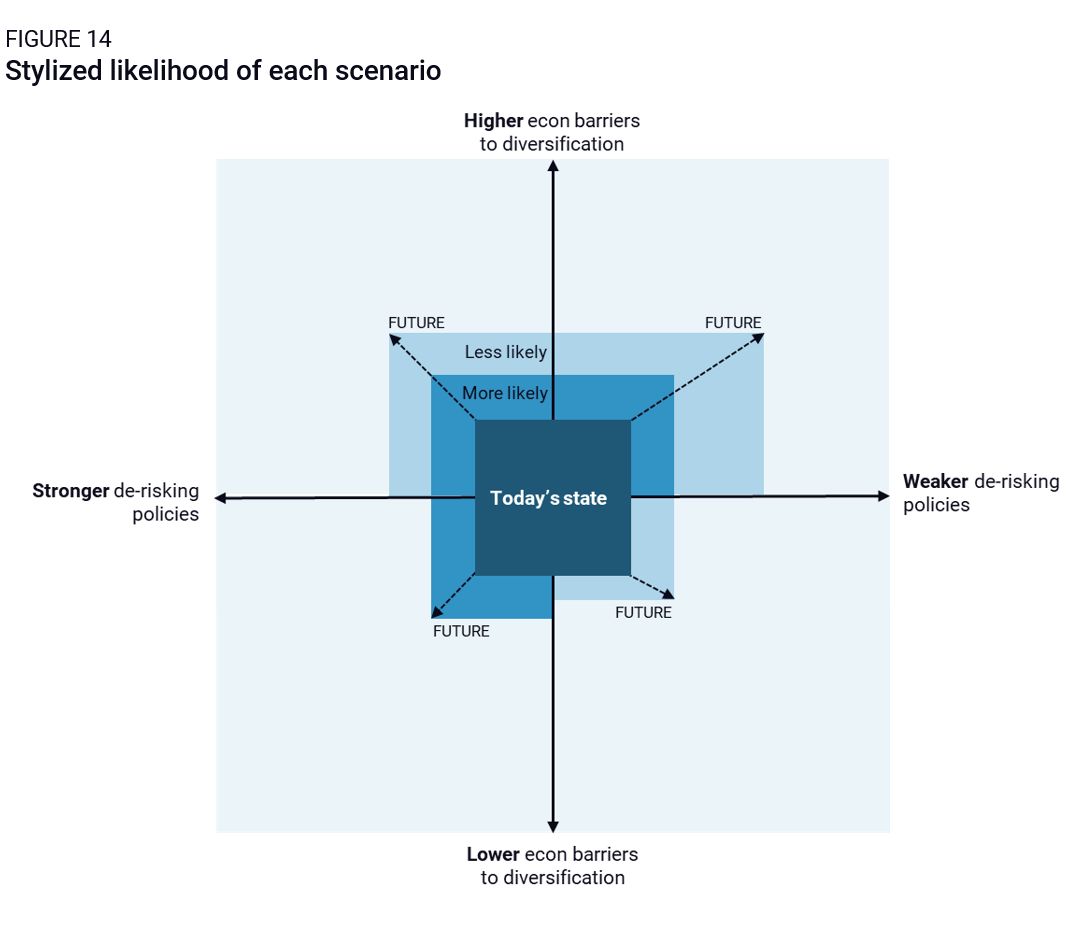
Beyond the 12–18-month mark, the picture becomes (even) more uncertain. We crafted four potential futures for supply chain relocation to 2030 (Figure 1), built off its two main drivers: policy and geopolitical pressures to diversify, and economic barriers to diversification. Each of these scenarios comes with unique sectoral and global implications, described in Chapter 3. These scenarios help highlight the wide diversity of potential outcomes for global supply chains. Ultimately, however, things will likely fall somewhere between these extremes. Yet none is implausible, and movement back and forth between them should be expected over time.
Globalization today: Four industries in focus
This section reviews recent diversification trends in four industries, with a focus on the past six years since the US imposed its first set of Sections 301 and 232 tariffs on China in 2018. We selected these four focus industries—apparel, consumer electronics, solar PVs, and automotive—based on their weight in global trade and their diversity. They involve a range of lower and higher tech goods, as well as varied levels of strategic relevance to major global economies like the US, China, and the EU. For each, we ask what country dominated production over the past decade, whether alternative productions hubs have emerged since 2018, and what most recent data tells us of likely future trends. We look at finished products, but also at various steps of the supply chain—from raw materials to intermediate inputs to semi-finished goods—to help us answer the question of whether diversification, if underway, remains shallow or is deepening over time.
Apparel
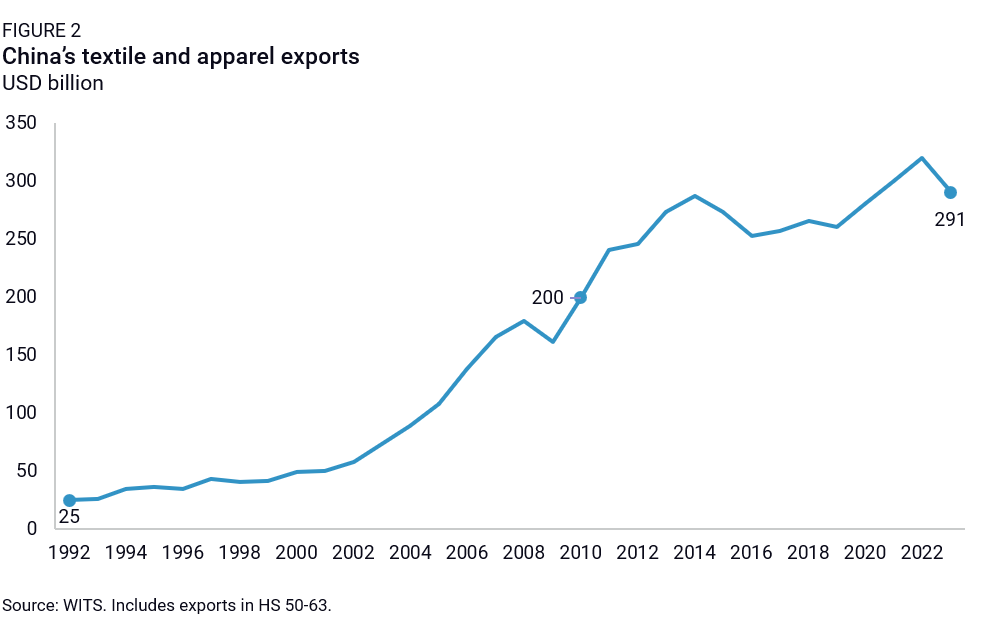
The apparel sector has long been a privileged gateway for less advanced economies’ integration into global value chains, especially via labor-intensive downstream segments that allowed nations to take advantage of their cost-competitiveness. China’s own emergence on the global manufacturing stage often recalls made-in-China apparel flowing en masse to global markets, especially from the early 2000s. China’s textile and apparel exports grew eight-fold from under $25 billion in 1992 to nearly $200 billion by 2010, when China’s contribution to global apparel trade rose to 35%, equivalent to the next 10 countries’ exports combined (Figure 2). By 2016, the country produced as much apparel for local consumption as it did for exports, pointing to domestic production capacity of yet greater scale.
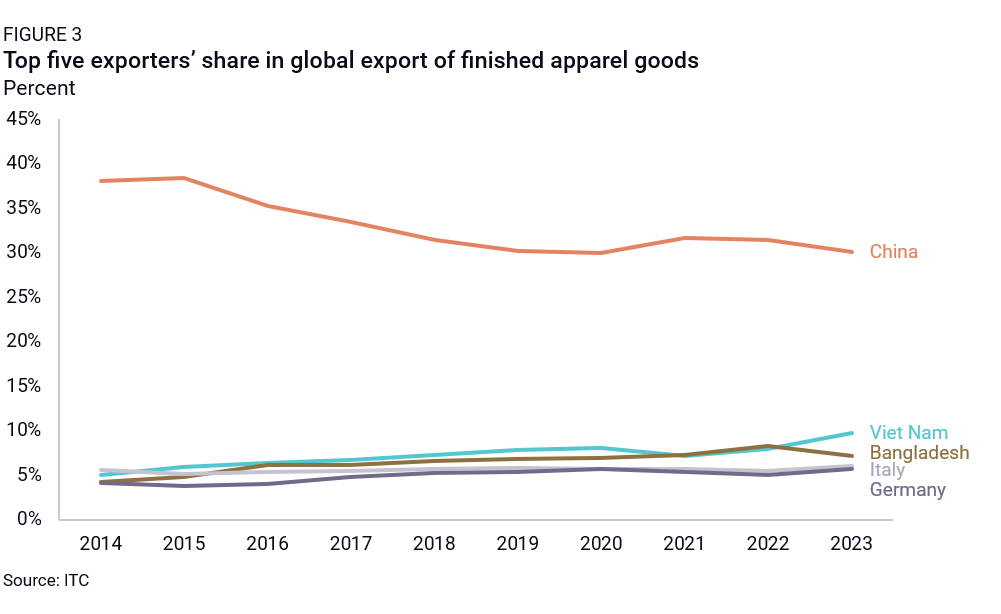
Since then, income levels and manufacturing costs have increased significantly in China, with wages in the textiles sector increasing 242% from 2003 to 2013. It is no surprise then to see signs of manufacturing diversification into countries with comparatively cost-competitive and abundant workforces like Vietnam, Bangladesh, India, Cambodia, and Turkey (Figure 3). Vietnam’s share of global apparel exports almost doubled from 5% in 2014 to 9.8% in 2023. Bangladesh’s picked up from 4.2% in 2014 to over 7.1% in 2023. Most surprising though is China’s resilience as an apparel hub despite rising costs and US policy measures, including tariffs (though limited to 7.5% for most apparel products) and regulatory action regarding China’s cotton and textile producing hub of Xinjiang (UFLPA).
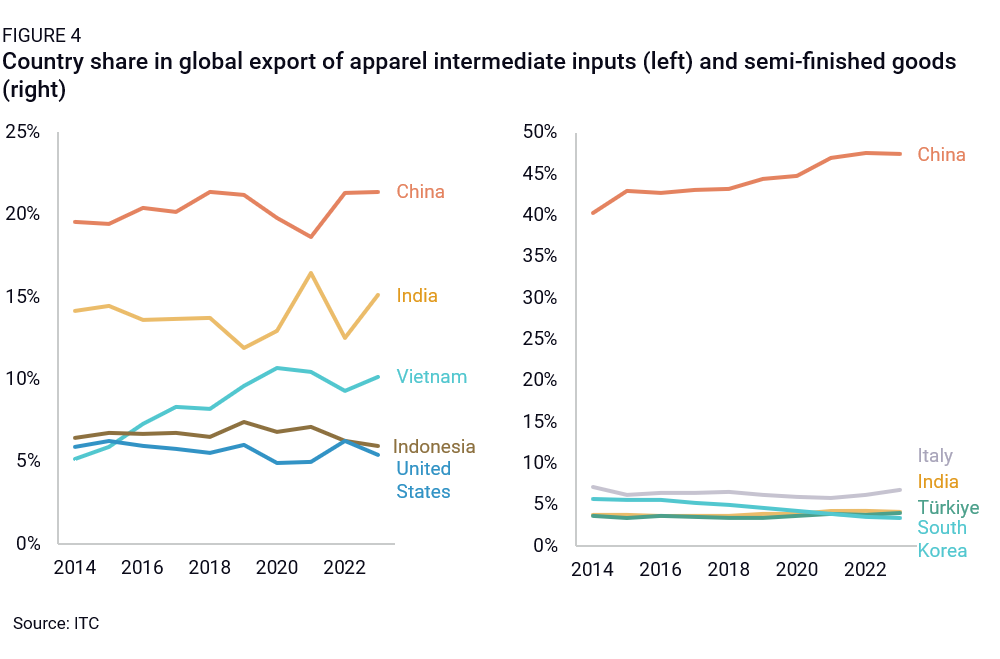
By 2023, the country still largely dominated global exports of apparel, down from 38% global export market share in 2014, but still making up close to a third of global apparel exports. China also topped the list of global exporters for intermediate goods—including staple fibers of polyester and viscose, cotton and polyester yarn, and carded or combed wool—and semi-finished products—like knitted or crochet fabric, cotton fabric, and parts of footwear (Figure 4). These trade figures likely underestimate China’s role as a supplier of apparel inputs, as some of its apparel value chains are fully domestic: China often transforms cotton into fabric into t-shirts on-shore, not crossing borders until the finished product stage.
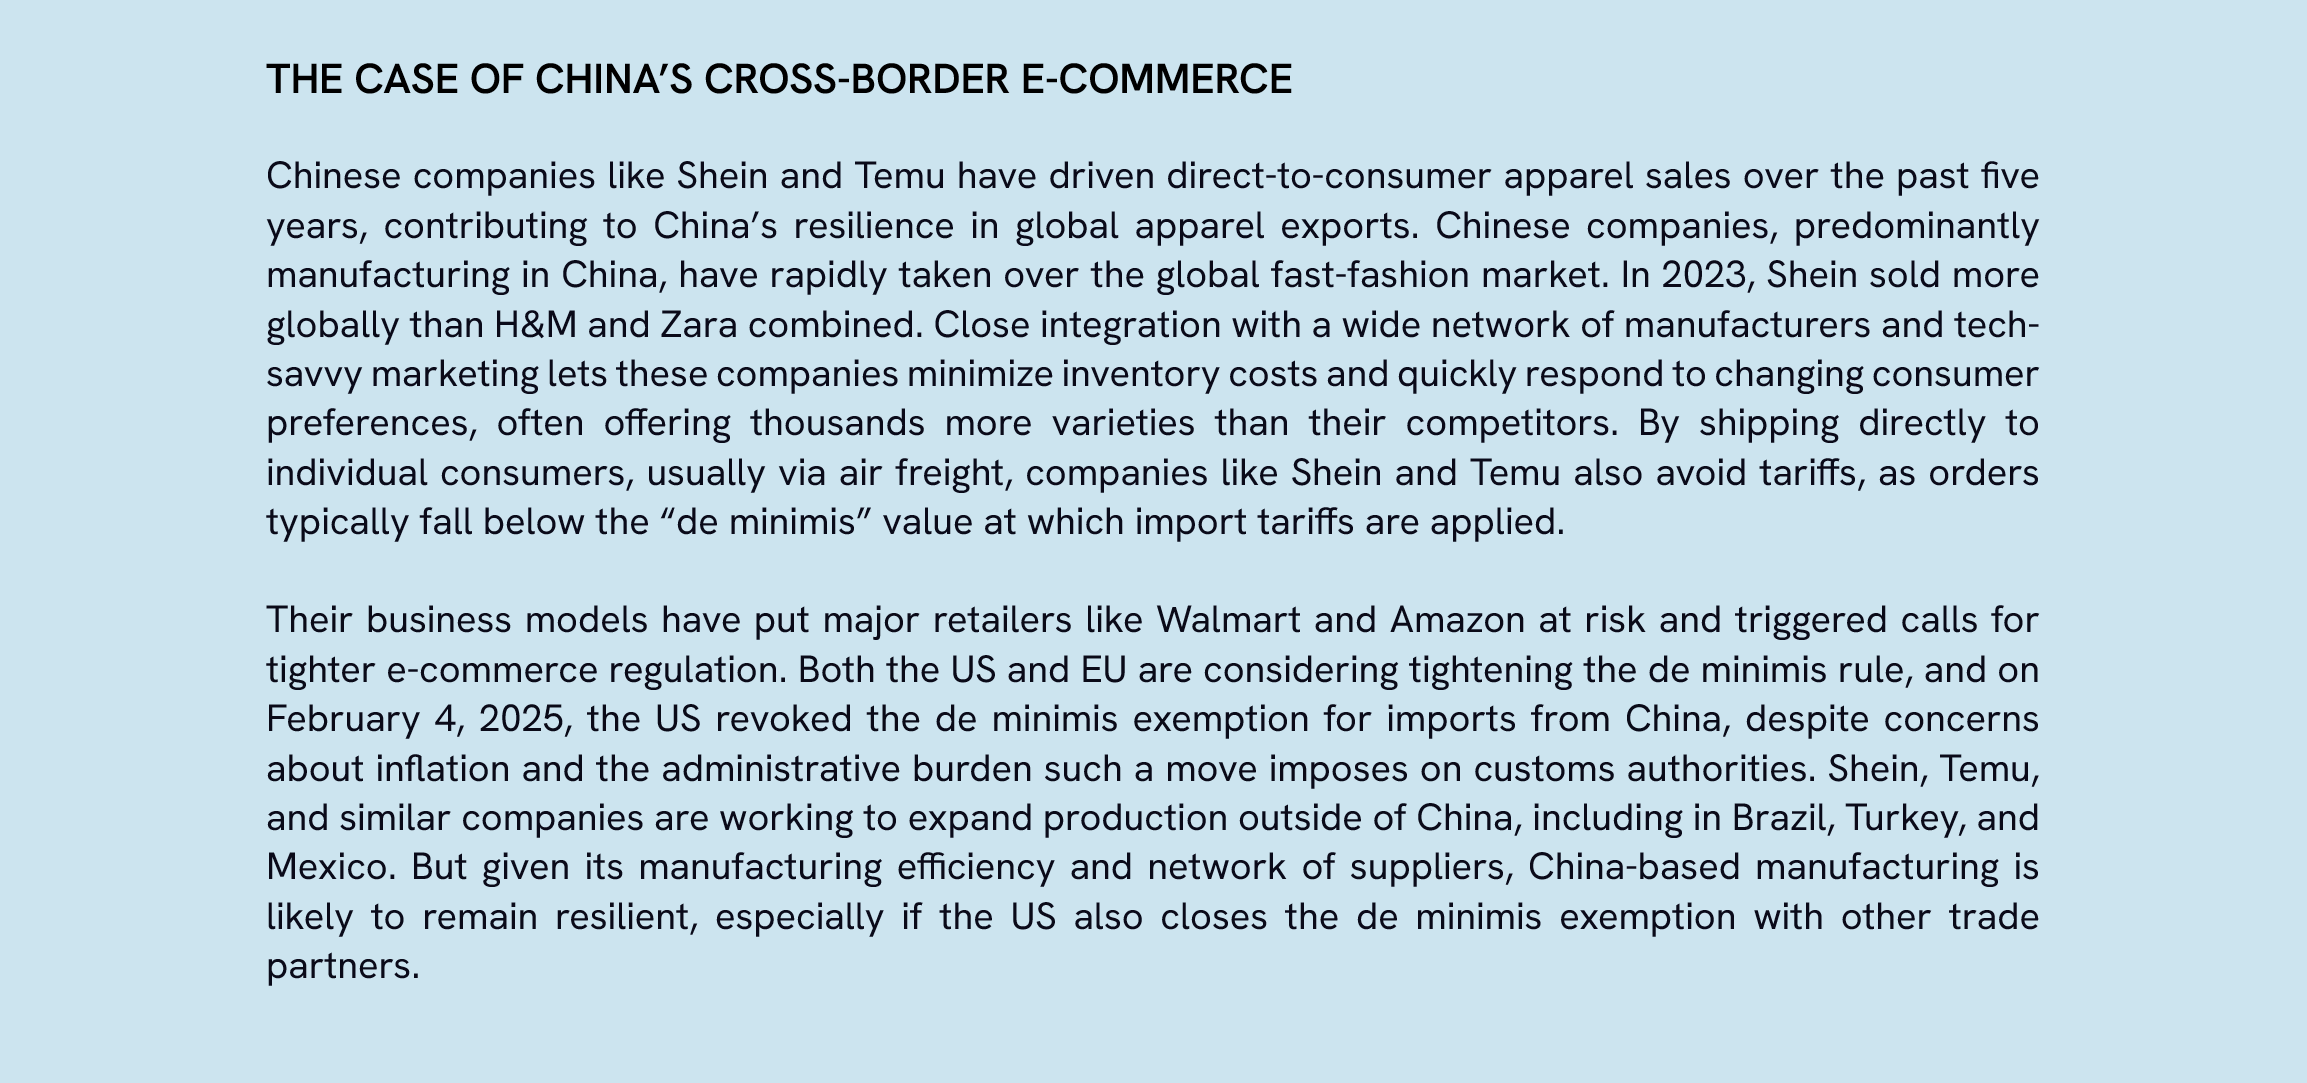
In short, we observe less diversification in apparel than expected given the low value-add, low-skill nature of much of the sector. Part of the explanation is structural Higher production costs in China are often offset by greater production efficiency and a better skilled workforce. Smaller manufacturing hubs like Cambodia have seen labor costs rise fast as production capacity expanded. Relative business stability also plays a role: Bangladesh’s export share dropped in 2023 due to inconsistent power supply and a shortage of US dollars to import raw materials. Importantly too, China is still making gains in higher value segments of the apparel sectors (e.g. advanced fibers and performance fabrics), typically dominated by Germany, Italy, and the US. Part of the explanation is also conjunctural. COVID-19 upended the long-term drop in China’s share of global apparel exports in 2020-2021, as Chinese firms ramped up export-oriented production capacity to address massive global demand for textile, including masks and other PPE. Since then, global demand dropped, leaving excess capacity and high levels of inventories in China, which further undermines the case for ramping up production outside China. Finally, China’s booming cross-border apparel e-commerce industry is putting a floor under its contribution to global apparel exports (see below).
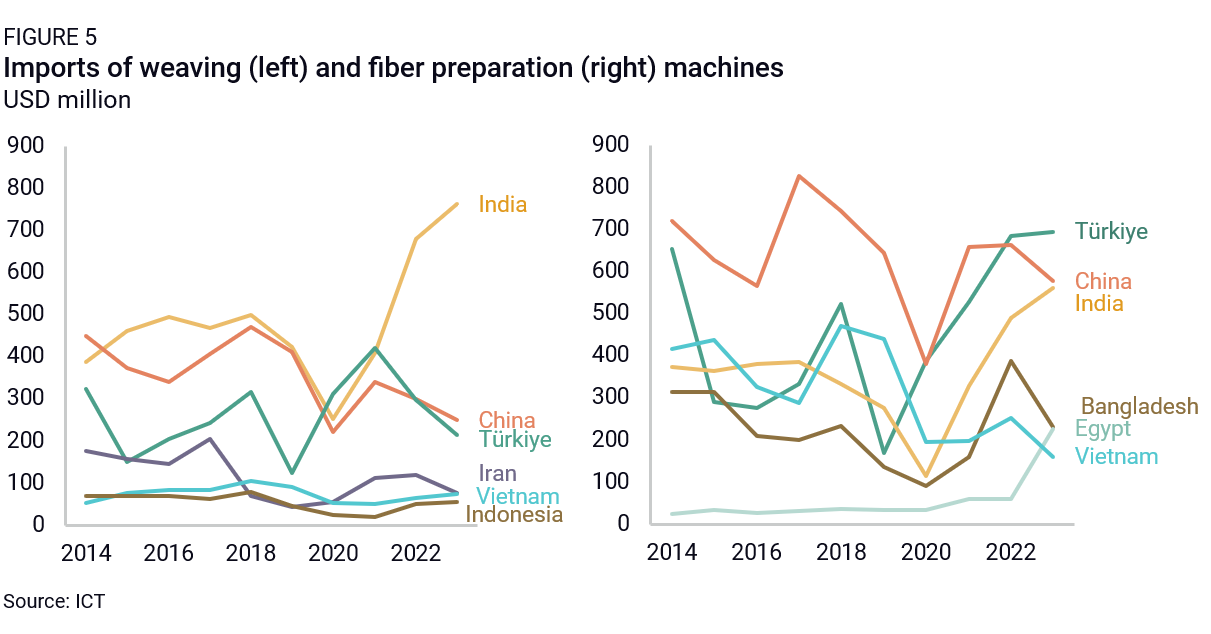
By 2023, diversification into alternative hubs such as Vietnam, Bangladesh, India, Cambodia, and Turkey was still relatively shallow. China was still a major supplier of textile inputs to all alternative hubs. This is because downstream segments are less capital- and skill-intensive than upstream segments, and hence can move more easily. US tariffs also first and foremost drew assembly activities out of China and into Vietnam, Bangladesh, and India. Among alternative hubs, India stood as a bit of an exception, with sizeable cotton and petrochemicals industries feeding local and global demand. This might be changing. India, Turkey, and Vietnam all registered significant imports of weaving and fiber preparation machines in recent years, which could indicate more upstream apparel segments being set up there (Figure 5).
BASELINE OUTLOOK
Going forward, it is likely that textile supply chains will continue their relocation to select ASEAN and South Asian countries, as well as the MENA region. This move will continue to be driven by rising per capita GDP and income levels in China: FDI data shows China dwindling as an investment destination and a range of alternative recipient countries picking up increasing shares of global apparel investment. Our tracking of Chinese outbound FDI, which offers a partial picture of these trends, indicates significant interest in Egypt, Vietnam, Cambodia, and Bangladesh. Supply chain patterns will also be affected by ongoing US policy action—including persistent (or increased) tariffs on China-made apparel and textile inputs and scrutiny of China’s human rights violations.
If the US tariff gap between China and alternative hubs remains limited, relocation will remain slow, given pools of cost-efficient labor in certain Chinese provinces, the continued efficiency of China-based production, Chinese policies to maintain a firm grip on global manufacturing production, and cost and operational barriers in third markets. The EU and other major global apparel markets are also unlikely to follow in US policy footsteps and adopt tariffs on China-origin apparel, given its low strategic and employment significance for these economies. This means China-made goods will continue to serve these final global markets.
IMPACT ON GLOBAL TRADE
Increased US tariffs and greater human rights scrutiny under the Trump administration could splinter trade volumes into two main trading channels. First, an Asia-to-US channel that would see most current non-China-based apparel production redirected to serve US demand, with potential for production capacity expansion over time. This would continue previous trends of US diversification away from China in apparel: China’s share of US apparel imports dropped from 40% in 2017 to 26% in 2023, while Vietnam, Bangladesh, Indonesia, and India’s collective share rose from 30% to 38%. This channel would likely still be supported by significant China-to-Asia trade in apparel inputs in the medium run, until alternative production hubs build up input production capacity—if ever. Second is a China for rest of world channel that would see most of China’s remaining production capacity focused on serving non-US markets—especially Europe. European hubs will probably continue to develop, too—especially around Turkey and Egypt—but it is less clear whether they would also start serving the US market. That would depend mostly on whether the level of US tariffs justify redirecting MENA-to-Europe flows to the US.
Consumer electronics
Consumer electronics is an intrinsically global sector built on highly fragmented, complex supply chains that historically shifted based on differences in production skills and labor costs.1 Starting in the 1970s, Taiwan and South Korea picked up downstream electronics segments demanding cost-effective and semi-skilled labor in large quantities, while upstream segments stayed with more advanced economies. Over time, these nations moved upstream and started themselves outsourcing final assembly to third markets like China. The expectation was that China, too, would offshore final assembly as it moved up the value chain.
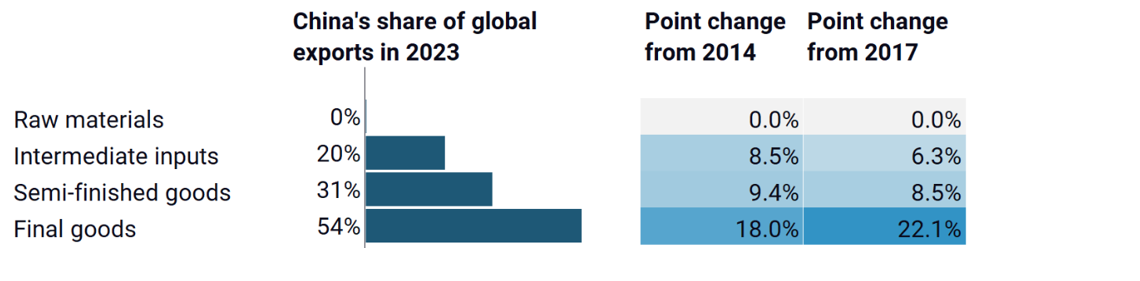
However, as in other sectors, China has put this dynamic into question with its ease and efficiency of manufacturing and low inventory, capital, freight, energy, and real estate costs. Despite manufacturing wages in China being more than double those in Vietnam, India, and other alternative manufacturing locations, laptop, tablet, and smartphone supply chains remain concentrated in China. For more than 15 years, China’s exports of finished consumer electronics products have exceeded all other countries combined, with only a slight drop in recent years In 2023, China represented over 65% of laptop and tablet exports and 47% of smartphone exports by value. While those numbers are down slightly from 69% and 50% in 2017, respectively, China is still the dominant production hub for consumer electronics globally.
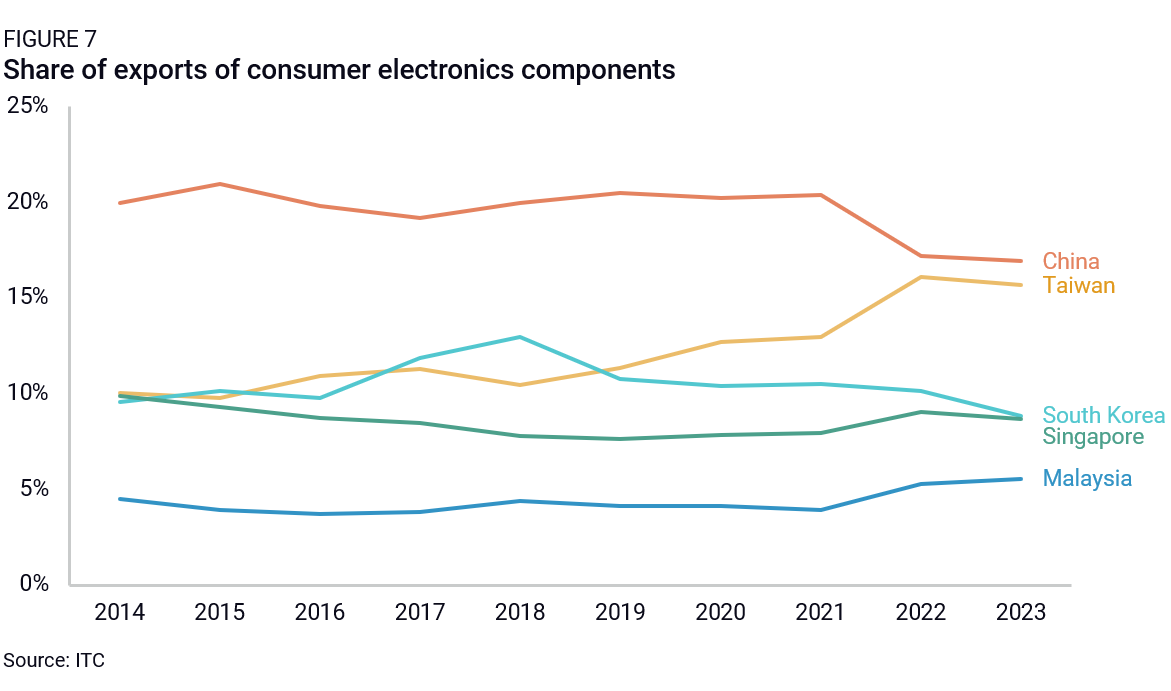
China also leads the global production and export of electronics components. In 2023, China accounted for nearly a fifth of global exports of intermediate inputs like tempered safety glass (used in the production of smartphones and laptops) and transistors. China is also a key player in the manufacture and export of electronic components, like memory chips, printed circuit boards (PCBs), and storage units. Though in 2017, it held 19.2% of global exports, strong growth in Taiwan’s semiconductor exports and recent weakness in the memory chip market has brought China’s share to a still-respectable 16.9% in 2023. Even more than for finished products, these figures grossly underestimate China’s role as a producer of electronic inputs and components, as many don’t cross the border and are directly integrated into made-in-China laptops, tablets, and smartphones.
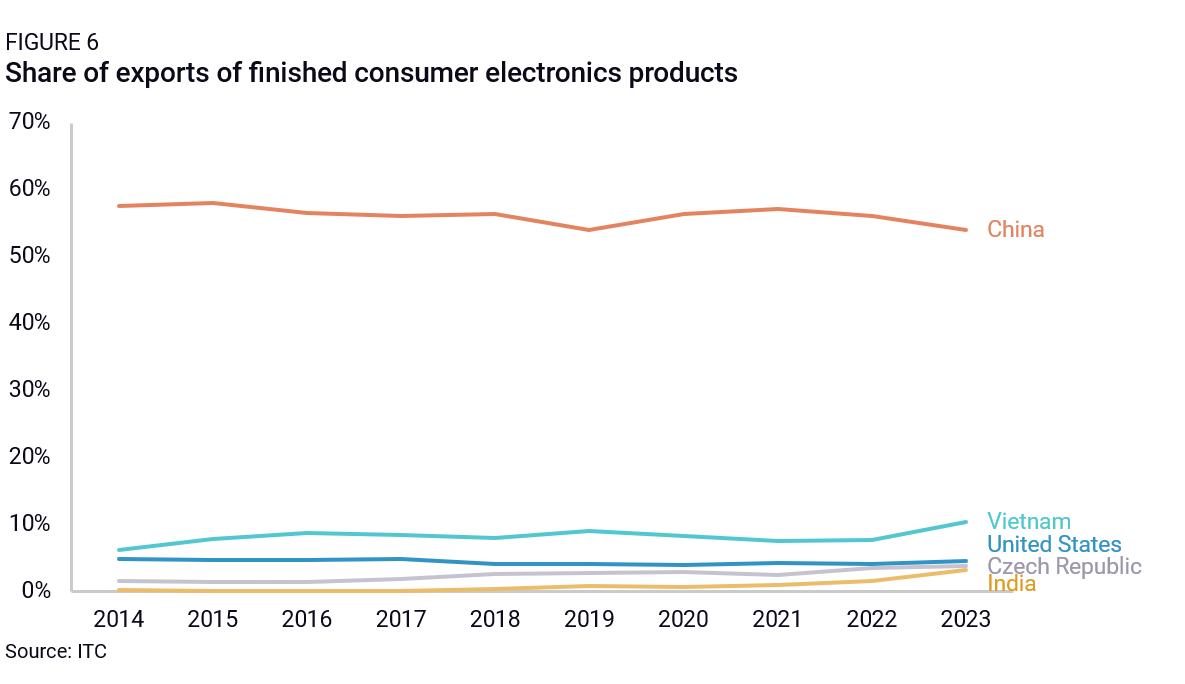
At the margins, though, Vietnam and India have picked up export market share. India and Vietnam’s relatively cost-efficient and high-skilled labor pools drew in companies looking to hedge against geopolitical and supply chain risks during the COVID-19 pandemic and US-China trade war, even though large portions of China’s consumer electronics exports were exempted from US tariffs. Both India and Vietnam have also rolled out abundant policy incentives to attract FDI in the sector. As a result, Vietnam’s share of global consumer electronics exports increased from 8.3% in 2017 to 10.4% in 2023. India’s also increased from 0.1% to 3.2% in the same period, largely driven by smartphone exports.
This uptick is more significant than meets the eye, especially given China’s utter dominance in the sector. It followed significant investments in smartphone manufacturing from the likes of Apple and Samsung in both countries, as well as Chinese firms relocating final assembly to Southeast Asia to serve customers moving to Vietnam and manufacture for the North American market. India, which offers a cash incentive of 4-6% of incremental sales to smartphone manufacturers, has seen an impressive 100-fold increase in smartphone exports the past six years, from $137 million in 2017 to over $14 billion in 2023. The Czech Republic, Foxconn’s gateway to the EU since 2000, also picked up export share with nearly 4% of consumer electronics exports in 2023, up from 1.8% in 2017.
As in apparel, diversification in final consumer electronics assembly has been supported by substantial increases in imports. Vietnam has become a top buyer of semi-finished goods like integrated circuits, PCBs, and LCD and OLED screens, and intermediate inputs like tempered glass and lenses. India and the Czech Republic have relied heavily on imports of semi-finished goods for their own electronics industries. Much of it has come from China, which explains the continued increase in its export share for intermediate inputs, up a whole four percentage points since 2017. Yet sources of imports have been more diverse than expected. Vietnam’s intermediate input and component needs have been primarily met by South Korea (at 28%, partly the result of Samsung’s large presence in Vietnam), with China second (25%) and Japan third (17%). India and the Czech Republic relied heavily on China for intermediate inputs (for 34% and 54% of their imports, respectively), but also on Taiwan, South Korea, and Malaysia.
Certain southeast Asian countries are emerging as alternative production hubs for some specific electronic components. Taiwan and South Korea have significant semiconductor production capacity and have maintained or grown their global market share as component exporters (the growing gap between Taiwan and South Korea stems from the latter’s key role in a weakening global memory chip market). Countries like Malaysia and Singapore are also leveraging high-skilled local workforces and MNCs’ desire to reduce their use of made in China components to grow their local component industries. In 2023, Malaysia accounted for 5.6% of global consumer electronic components exports, up from 3.8% in 2017, on the back of its strong semiconductor assembly, testing, and packaging sector. Singapore, for its part, is growing its share of global components exports again (2019-2024) after five years of decline (2014-2019)—the AI boom and concerns about geopolitical risk boosted semiconductor production in and exports from the country, though some transshipment activity might be involved. Finally, Thailand is seeing significant inward FDI in the manufacturing of PCBs and related components, like copper clad laminate, which the country has imported in growing quantities since 2017 for its booming auto industry and consumer electronics manufacturers.
BASELINE OUTLOOK
FDI data indicate that countries like Vietnam and India could play an even greater role in the consumer electronics supply chain going forward. According to its official statistics, Vietnam experienced a boom in manufacturing FDI, up 40% in 2023, including transactions in the manufacturing of intermediate electronics inputs and components like PCBs, connectors, wiring harnesses, transformers, and smartphone cameras. Often co-located with Samsung and Apple manufacturing facilities, these investments signal further potential for and commitment to Vietnam’s smartphone export capacity. They could also allow for improvements in manufacturing efficiency, like those seen in China, around more integrated production hubs with high external economies of scale (Vietnam is unique so far in that regard). India has also become home to several new manufacturing facilities for Apple and Samsung phones and related components made by companies like Foxconn, Pegatron, and Corning. FDI in India’s computer hardware and software sector has been declining in recent years—it was around $8 billion in 2023, down from $34 billion in 2021—but may rebound slightly with Dell, HP, Lenovo, and 24 other computer manufacturers approved to receive benefits under India’s production-linked incentive program.
Vietnam and India could also build on their success in smartphones to expand into laptops, tablets, and other computers. In 2024, Samsung began manufacturing laptops at a facility in India originally dedicated to smartphone manufacturing. Vietnam has already become one of the top alt-China laptop manufacturing destinations, with exports up nearly 150% since 2017 to $7.1 billion in 2023, behind only the US ($7.5 billion) and China ($99.4 billion). Indonesia and Brazil could also host future industry diversification, given reports that Apple and Samsung are shifting manufacturing there.
Ramped-up US tariffs on China coupled with industrial policies in Southeast Asia could accelerate diversification. The first US-China trade war only marginally affected consumer electronics trade, as many companies successfully lobbied for exemptions. But the new round of tariffs announced on January 31 is, so far, much broader. If consumer electronics remain within scope (that is, no exemptions are granted this time), the ready availability of alternative manufacturing capacity in various Asian nations and proactive policies to attract electronics FDI could accelerate supply chain shifts to countries like India, Vietnam, Thailand or Indonesia. In August 2023, HP and Google announced they would manufacture Chromebooks in India, in response to the Indian government’s production-linked incentive program and pressure to reduce laptop imports. Local content requirements in Indonesia reportedly pushed Apple to commit to investing $1 billion in local manufacturing of smartphone components and other technologies.
However, this shift will hinge on two more factors: the level of tariffs imposed by the US on trade partners beyond China (e.g. will the US administration also impose tariffs on Vietnam or India?), and the degree of US permissiveness for (hard to reduce) China content in electronics imports from ASEAN. Policies affecting other downstream sectors from electronics components, like automotives, could also impact upstream supply chains and create further incentives to diversify away from China.
IMPACT ON GLOBAL TRADE
If President Trump keeps China tariffs at significantly higher levels than those imposed on other US trade partners, then we are likely to see a major surge in consumer electronics exports from Asia (ex-China) to the US in 2025 and beyond. At this stage, Vietnam and India are best positioned to be the final port of departure for US-bound consumer electronics (mobile phones especially, but increasingly laptops too), given existing capabilities. Booming production in both countries should feed increased pan-Asian trade (with China, but increasingly with Malaysia, Taiwan, and South Korea). This shift will however hinge on US willingness to welcome increased levels of imports from alternative partners, rather than force a more significant reshoring to the US—a much costlier and more drawn-out process.
The EU will probably not shift away nearly as drastically from China-made consumer electronics, as EU de-risking policies remain softer and focused on other sectors. As Chinese consumer electronics become cheaper on the back of the yuan’s depreciation and reduced access to the US market, it is even possible that EU electronics imports from ASEAN or possibly the Czech Republic get displaced with China-origin goods.
Solar panels
In the solar panel industry, heavy state support, economies of scale, and quick efficiency and technological gains provided China with a significant cost advantage that is by now almost impossible for other manufacturing hubs to challenge. Combined with rampant overcapacity in the industry, these factors have driven down prices of China-made solar panels to about half that of solar panels produced in the US or Europe, and two-thirds of those produced in India.
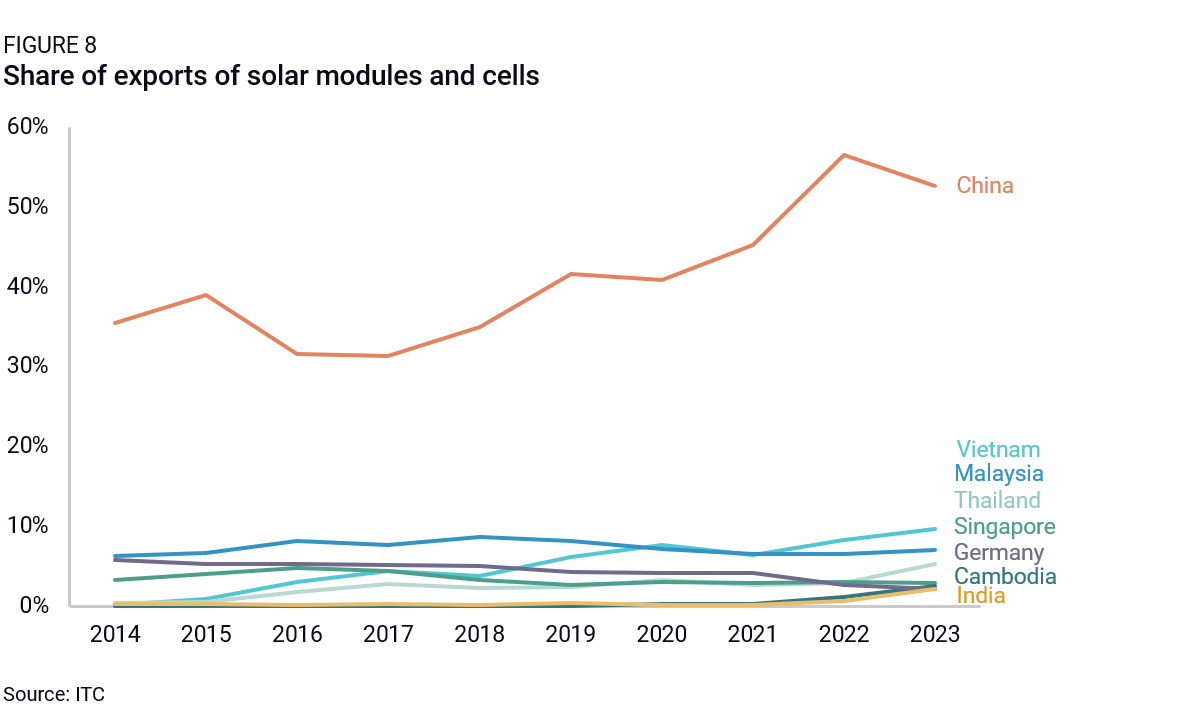
Unsurprisingly, China dominated global production and exports of solar cells and modules in 2023. Its export share stands at 53.5%, up quickly from 35.5% ten years prior, and its share of global production is around 80%. Prices for Chinese solar panels are also falling, which means that export figures understate China’s global market share. In the EU, China’s biggest market for solar panels, the value of imported solar panels decreased by 12% in 2023 from 2022 while their quantity increased by 5%. US tariffs on China-made solar modules have also driven Chinese producers to outsource final steps of the supply chain to Thailand, Malaysia, Vietnam, and Cambodia, meaning China’s contribution to global solar cells and modules exports is likely underestimated.
China is also a global leader in intermediate and semi-finished goods for solar PVs, and its global export market share is still increasing. This includes glass sheets (China accounted for 45% of global exports in 2023, up from 28% in 2014), metal frames (30%, up from 23% in 2014), and chemicals used in solar panel manufacturing (22%, up from 10% ten years ago). China also leads in polysilicon but has seen its global export market share come down 2 percentage points since 2014, as German, Norwegian, and Malaysian exports picked up. This shouldn’t necessarily be seen as a sign of supply chain diversification, however. China’s declining share likely reflects increasing amounts of solar modules and cells being produced in China, using China-made polysilicon feedstock, as well as increasing amounts of foreign made feedstock shipped to China to support fast growth in volumes produced.
Defensive trade measures, namely US AD/CVD on Chinese solar panels, have allowed Thailand, Malaysia, Vietnam, and Cambodia to pick up some final assembly, geared almost entirely toward the US market. Together, these countries now make up around 20% of global module exports—and a whopping 70% of US imports. All of them rely on significant Chinese value add (as well as investment), though alternative supply sources for intermediate and semi-finished goods are also emerging in Southeast Asia.
Malaysia is now one of the top global exporters of polysilicon, representing 8.3% of global exports in 2023, up from only 0.5% in 2014. A recent surge in announced FDI in the country’s solar supply chain could solidify its position as a production hub for intermediate inputs and semi-finished components like polysilicon, silicon ingots, and wafers (OCI’s $1.5 billion expansion of its polysilicon plant; LONGi’s $385 million monocrystalline silicon wafer, cell, and module plant), along with solar cells and modules themselves (in 2021, Risen Energy’s announced a $10.1 billion solar cell and module manufacturing plant in the country).
Vietnam is another rising hub, and its growing ingot and wafer manufacturing is one of the main markets for Malaysian polysilicon. From 2020 to 2023, Vietnam’s imports of polysilicon feedstock have skyrocketed from less than 1% of global imports to 13%. Companies like China’s Jinko Solar and Ningbo Powerway Group are actively expanding module, polysilicon, ingot, and wafer manufacturing in Vietnam.
Chinese firms have similarly invested in Thailand over the past decade to respond to US duties. In recent years, Thailand has also seen an uptick in FDI from Western companies, like Canadian Solar’s wafer manufacturing plant and Midsummer’s and Saab’s thin-film solar cell factory. Continued FDI in 2023 and 2024 signals these countries will remain important alternative solar hubs going forward.
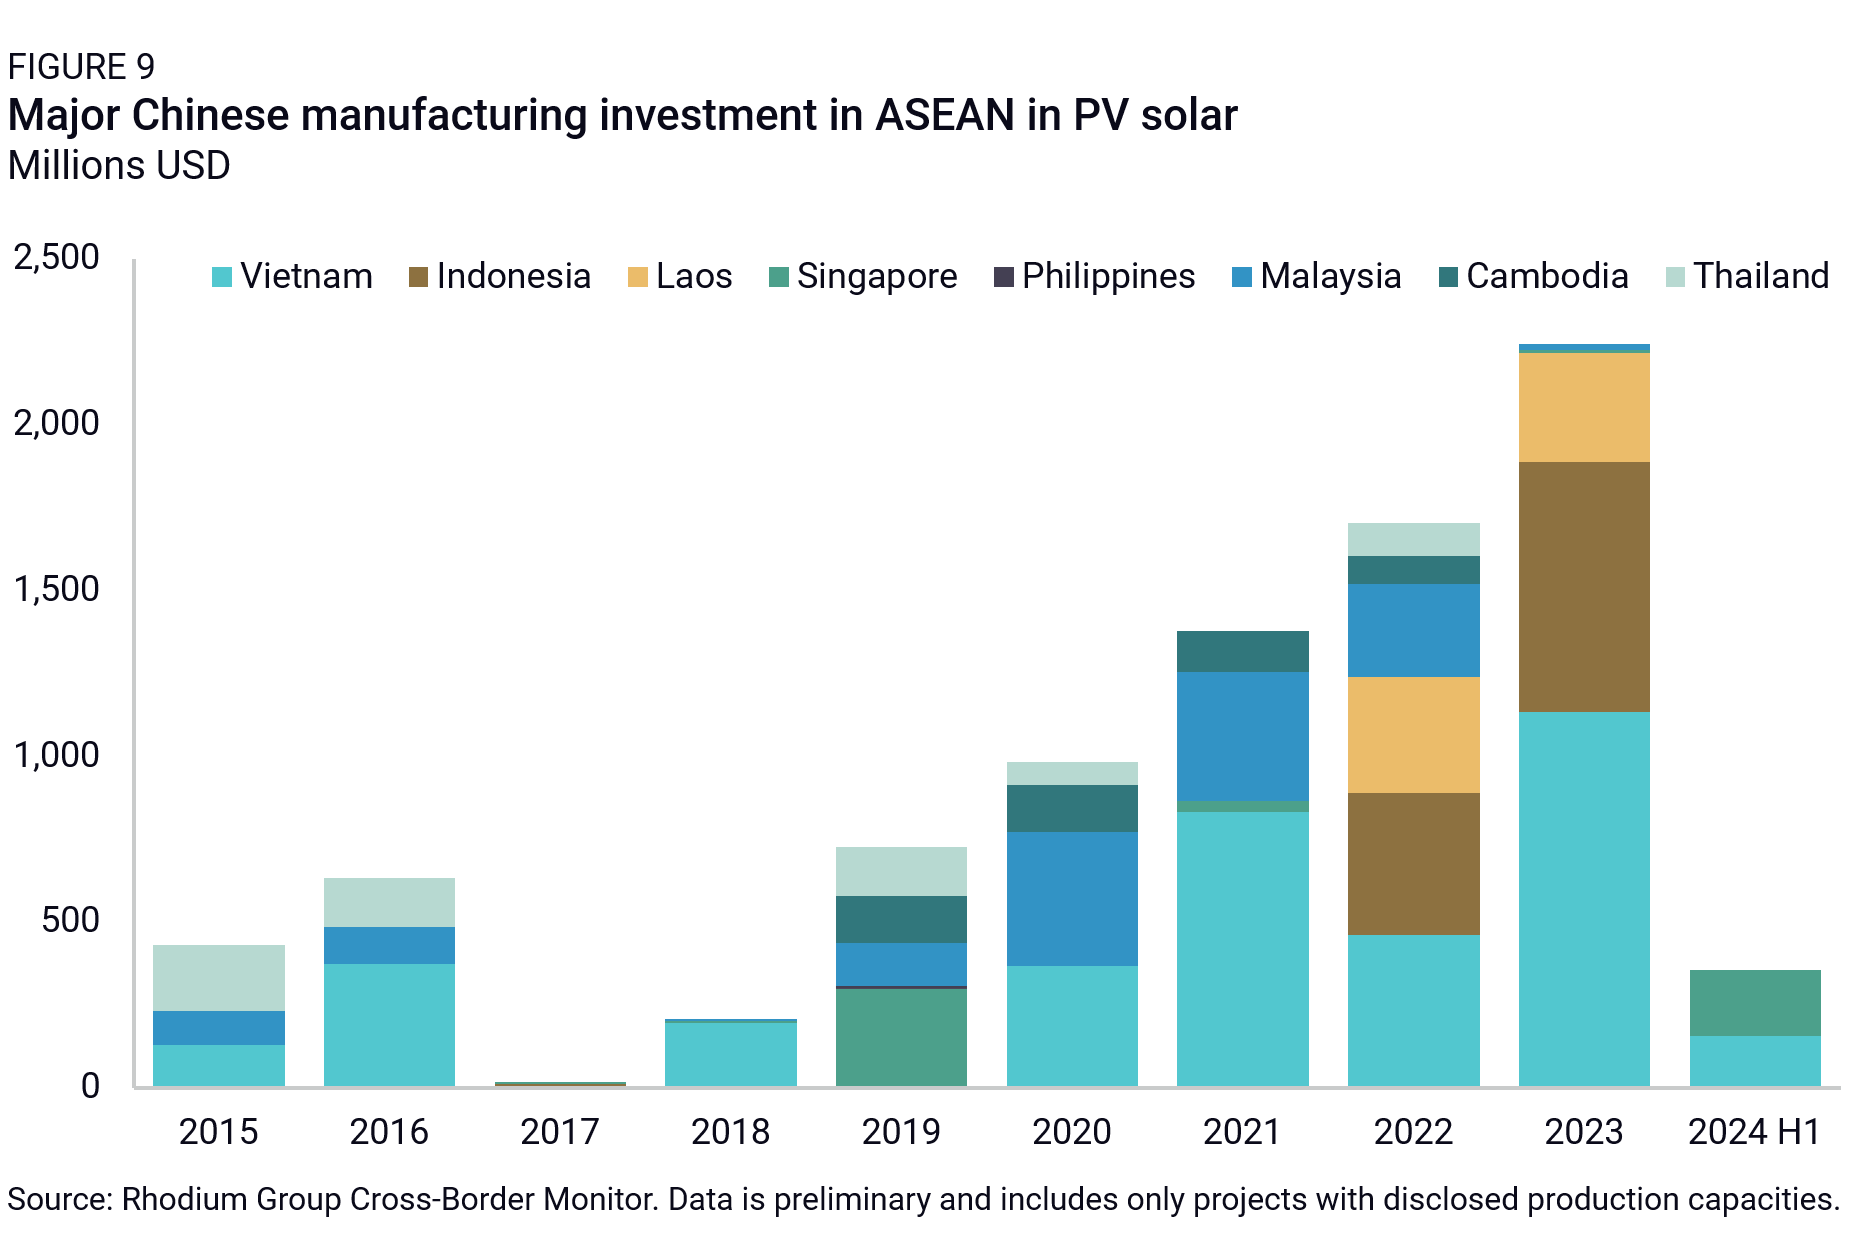
In recent years, Chinese FDI—which underpins much of the recent diversification of solar PV supply chains into ASEAN—started shifting to Indonesia, Cambodia, and Laos (Figure 9), likely as a pre-emptive move to avoid rising US trade barriers against certain solar PV exports from Malaysia, Thailand, and Vietnam. While local demand might be able to offset future geopolitical tensions in Indonesia, the activity in Cambodia and Laos could be short lived if they also become a target of US anti-circumvention measures—a strong possibility.
Beyond ASEAN, India and Turkey could also become bigger players in solar panel manufacturing and exports in coming years. In 2023, they were the top importers of solar cells not yet assembled into modules, with 27% and 19% of global imports, respectively. Both countries have imposed tariffs and other barriers on finished solar panel imports, while simultaneously offering incentives to prop up local manufacturing. Most of this is still concentrated on final assembly for the local market. But India’s exports are on the rise—up 250% in 2022 and 211% in 2023, mostly to the US market—indicating booming production capacity that could end up drawing greater investment in upstream segments of the supply chain. Looking ahead, Turkish solar companies are also looking to expand into the US market, hoping to fill the gap left by Chinese manufacturers.
BASELINE OUTLOOK
Despite these trends, we still expect China to remain the top producer and exporter of solar panels in the medium to long run. Even though China’s solar PV sector is poised for consolidation and some price rationalization, its dominant market position and significant price and technical advantage will remain. It will take years for third countries to reach equivalent economies of scale and price levels, especially if these production hubs seek to limit their reliance on Chinese inputs to assuage US concerns.
Besides, it is unlikely that other major end markets will impose restrictions on China-made solar panels like the US. Because its solar industry was decimated more than a decade ago by the rise of China’s solar manufacturers, the EU has few incentives to launch major new investigations into Chinese solar panel imports—contrary to wind and EVs, where the potential economic and employment damage from low-priced Chinese products is much greater. Neither do Australia and many Latin American, Middle Eastern, and African countries. In these locations, China’s price advantage will ensure Chinese firms maintain their dominant foothold.
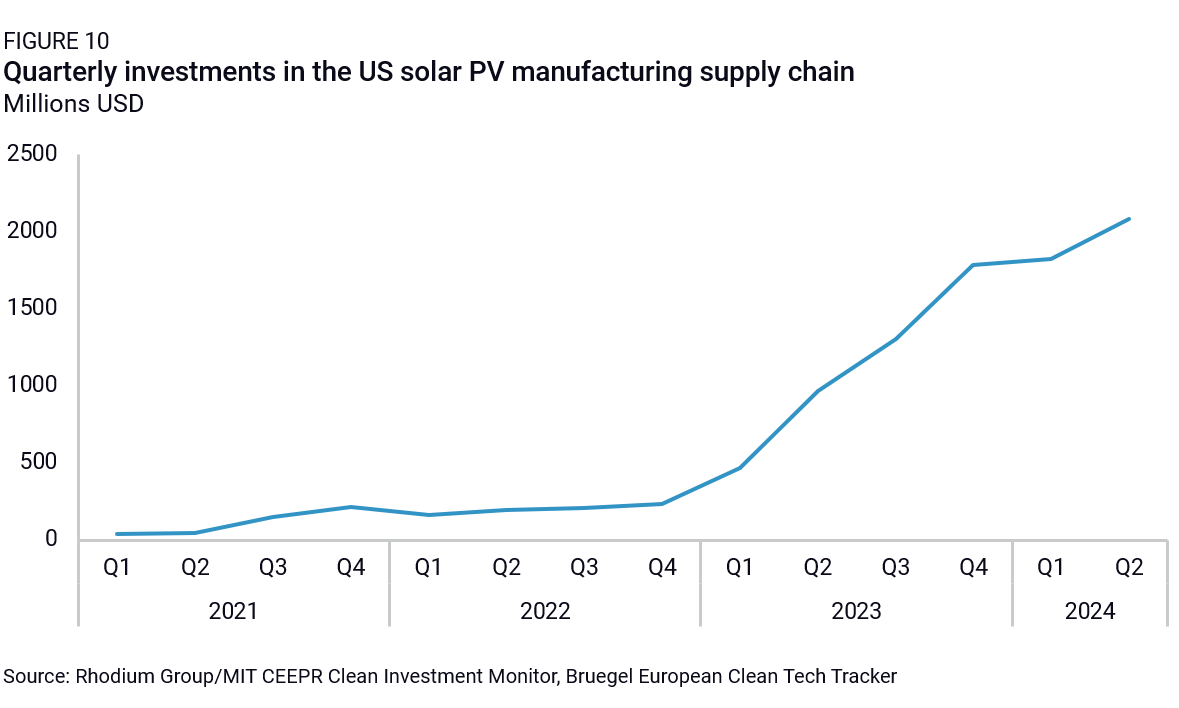
However, if the new Trump administration maintains some of the IRA’s manufacturing incentives—which have mostly gone to Trump-leaning states—the US could emerge as a major solar producer. Since the IRA was announced, US imports of polysilicon, metal frames, and antireflective coating have gone up 28%, 17%, and 16%, respectively, indicating fast growth in US local production capacity. FDI in the US solar PV supply chain has also shot up since 2022 (Figure 10). Continued growth in the US solar industry, coupled with persistent scrutiny of China-origin inputs, could further boost production of solar components and intermediate products outside of China.
IMPACT ON GLOBAL TRADE
China will continue to be a major producer and exporter of solar panels and their parts, with healthy growth in shipment volume to emerging markets like Brazil, Pakistan, and Saudi Arabia. The EU is likely to remain a key market for Chinese exports given the lack of European-made alternatives and because cheap Chinese solar panels can support decarbonization. For the US, however, a separate supply chain for solar exports will likely develop, much of it originating from Southeast Asia and India, and still relying in part on intermediate inputs and semi-finished goods from China. Whether US-based production picks up speed, and hence greater amounts of downstream supply chains shift to the US, will depend on Trump’s climate policies, especially decisions made to preserve or scrap IRA manufacturing incentives for the solar industry.
Automotives
Over the past 15 years, auto supply chains have relocated and built up in China on a massive scale. This has been driven by fast-paced demand growth in China, where auto sales now exceed those of the US and EU combined, and significant policy incentives for local vehicle manufacturing. The trend has been amplified by China’s self-sufficiency policies, which actively supported replacing imported inputs with locally produced ones. As a result, China’s share of global production has increased in almost all categories of the auto supply chain over the past decade, with stark effects on trade. China is quickly reducing imports of both vehicles and parts as local capacity builds up. In recent years, it has also started exporting significant amounts of intermediate inputs and finished vehicles.
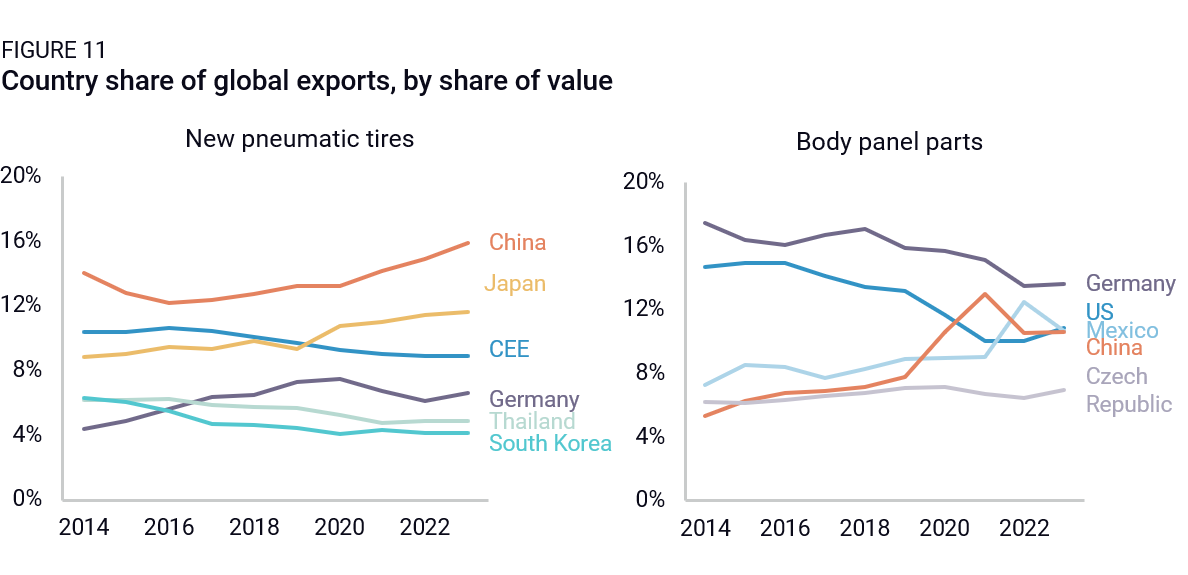
China now dominates global exports of tires and brakes and their parts. It has also emerged as a major producer of body panels and their parts. While it does not yet count as a major exporter of internal combustion engines (ICE), it has become a major producer of them for domestic consumption and is now the second largest exporter of ICE parts, fast closing the gap with Germany. Most striking, it has become a major exporter of passenger vehicles—now third globally in value terms, but first in volume terms. China exported 4.14 million passenger cars in 2023, edging out Japan (4.0 million) and Germany.
As in other sectors, trade data underestimates China’s role in global auto supply chains, as significant production (both inputs and vehicles) is consumed directly in China. For example, China is by far the global leader in passenger vehicle production, producing roughly four times as many cars as the second-place US. Trade data also does not distinguish between foreign-invested and Chinese-invested production—in fact, a significant amount of auto supply chains in China are still foreign-owned and -run, including by German, Japanese, and US companies.
China’s emergence as an auto supply chain giant has been supercharged by two factors. First, Russia’s war against Ukraine opened an almost unchallenged 1.5-million-unit market overnight for China’s vehicle and auto part makers. Second, China has a first mover advantage in the EV sector—both for battery and vehicles—on the back of abundant state support for EV adoption and production. Combined with significant economies of scale, vertical integration, and fast-pace technological advances, this conferred Chinese firms a stark price and technical advantage over other global players.
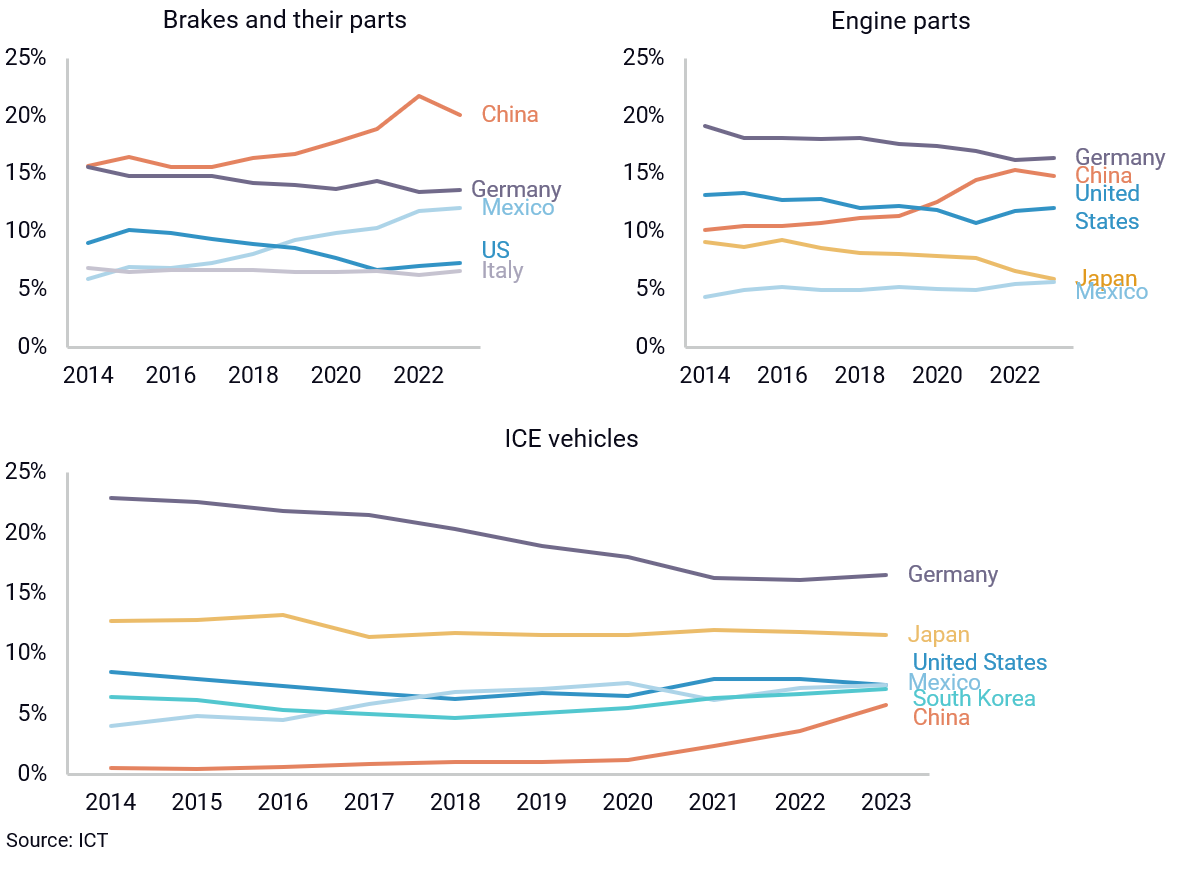
In fact, China’s dominance in the EV supply chain is even more pronounced than in other auto segments. China tops production and export of intermediate inputs due to its dominance over critical mineral processing. Since 2020, China’s exports of intermediate inputs have more than doubled, mainly off the back of export growth in lithium oxide and hydroxide, up 1,042% since 2020. It mainly exports these materials to South Korea and Japan, highlighting dependence on China for intermediate inputs. China is also the lead producer and exporter of lithium-ion batteries, with 52% of global exports in 2023. China’s position as a lead market for EVs has also given its domestic manufacturers a strong springboard to become the biggest exporter of EV passenger vehicles, jumping ahead of Germany and Japan in this newest technology, as well as some raw material production and processing. Unchallenged Chinese price competitiveness in the sector, overcapacity in both inputs and vehicles, and a lack of credible alternative for various components means China will remain dominant in the EV supply chain in the medium run.
China’s emergence as an automotive manufacturer has challenged historical patterns of regionalization in auto supply chains. For the past two decades, close-by relocation had been the best practice for a number of reasons: high standardization requirements and specifications (e.g. emissions rules, which side the driver is on, tires for different climates), high transport cost of some components, the need for close interaction between OEMs and their suppliers, and deep local consumer preferences. Given its importance in local employment, high trade barriers have also fostered a concentration of supply chains in deeply integrated regions.
These factors contributed to the build-up of two major regional automotive hubs in Europe and North America. Over the past three decades, Mexico picked up market shares as an exporter of vehicles, but especially so as a supplier of auto parts (from body panels to brake parts), largely for the US market. Countries in Central and Eastern Europe also quickly gained ground within EU supply chains centered around Germany. For example, the Czech Republic became a major supplier of body panel parts, Poland became a core supplier of brakes and their parts, and Hungary and Romania emerged as tire manufacturing hubs.
China has, however, become a global auto parts (and even vehicle) exporter, on the back of cost and technical efficiency. While China’s rise hasn’t yet led to a decline in CEE and Mexico’s share of global exports for auto parts, it has come with a clear and systematic decrease in the role of traditional auto exporting hubs—especially Germany, Japan, and the US.
Still, there are a few exceptions. Japan and South Korea remain resilient hubs for battery inputs, with 5.7% and 10.7% of intermediate input exports in 2023, respectively, and are largely invested in global battery production hubs (Poland and Hungary, especially). However, they are losing ground to Chinese battery makers, with Japanese and South Korean shares of global battery exports sharply down from 16.7% and 16.3% in 2014 to 2.9% and 6.1% in 2023, respectively. To some degree, all global EV and battery production hubs remain dependent on China-made inputs.
A US battery manufacturing hub is also picking up in the wake of the IRA, with significant investment from Japanese and Korean battery makers, though with a continued reliance on a range of Chinese inputs. US-made batteries are primarily used in US automotive production that is mostly sold at home, with related exports steadily declining since 2016. This US-centric EV production has sidelined Mexico, which has not yet had the opportunity to develop as an electric hub. Whether this emerging EV production hub develops further will hinge on future US support for the sector, which is likely to shift under the new US administration and undermine progress to date.
BASELINE OUTLOOK
We expect China will continue to reduce its imports of auto parts and finished vehicles and seek to export more of its domestic production. If China maintains its vehicle export trajectory, supply chains will likely further concentrate in China for both ICE and EV parts and vehicles. However, that prospect is clouded by strong defensive action from traditional and emerging auto hubs.
By now, the US, Europe, and Japan have taken measures to restrict imports of Chinese vehicles—especially electric vehicles—to their markets. The US has slapped tariffs of 100% on imports of China-made EVs, tied IRA tax credit to China-free battery supply chains, and plans to impose a sales ban on vehicles made by Chinese companies or vehicles integrating certain Chinese hardware or software. The EU concluded its own anti-subsidy investigation by imposing duties of up to 38% on China-made EVs. Japan and France are rolling out EV tax credits linked to resilience and environmental criteria that make it very hard for China-made vehicles to benefit from local EV adoption support.
It is unlikely that the new Trump administration will soften its stance on Chinese vehicle imports. EV tax credits might get rolled back, taking away a major barrier to using China content in battery supply chains, but the more drastic ICTS rules on China-made connected vehicles and technologies are likely to remain in place. These will continue to act as a de facto ban on Chinese vehicle sales in the US and encourage the creation of US-specific auto supply chains globally with only limited Chinese content (also incentivized by the rise in US tariffs on Chinese exports).
Where these supply chains settle depends on US policies toward other trade partners. If IRA incentives disappear and EU OEMs start to favor exporting out of Europe, then Mexico, Canada, or Europe are possibilities. But if Trump imposes high tariffs on auto parts and vehicles made in Mexico, Canada, and (ultimately) Europe, then these chains could end up reshoring directly to the US. Recent FDI patterns point to a clear effort to relocate some production directly in North America, with several major brake makers (Bosch, Continental, Brembo, and HL Mando) and tire companies (Enso, Michelin, Bridgestone, Pirelli, and Nexen) announcing new or expanded manufacturing in Mexico, the US, and to a lesser extent, Canada.
Europe will be the swing player. Theoretically, higher EU trade barriers could lead Chinese firms to invest directly into Europe, onshoring their vehicle production and some of their supply chains. In practice, though, lower European duties make some level of exports viable, local production costs in the EU remain high, and diplomatic tensions act as a brake on FDI. The main variable to watch will be Europe’s willingness to follow in the US’s footsteps with much more biting national security-based restrictions on Chinese vehicles and related technologies. Should Europe decide to take that path—under constraint from the US or out of concern for its local auto industry—global auto supply chains will likely reshuffle significantly. This could lead to a bifurcated industry, with an in-China-for-China supply chain on the one hand, and an ex-China supply chain on the other.
IMPACT ON GLOBAL TRADE
US policies will continue to block China-to-US vehicle trade and hamper growth in China-to-US auto parts trade. It will also increase incentives for Chinese firms to grow trade through production in third markets, especially Mexico. Yet growth in China-to-Mexico auto trade will hinge on US tariff policy, as well as the new administration’s tolerance (or lack thereof) for Chinese content in Mexico-origin imports. Mexico might also be pressed to raise its own trade and investment barriers under a US-Mexico trade deal.
Chinese battery cells will likely maintain a limited role in the US EV market given trade barriers and regulatory measures like the IRA, which benefits competitors. While watering down IRA rules under Trump could benefit Chinese producers, existing investments by Korean and Japanese battery makers will likely remain the first choice for most US-based OEMs.
Europe’s current duties on China-made EVs will slow the growth of China’s EV exports to Europe, but China-to-Europe vehicle trade will continue to grow, albeit slowly. If Brussels imposes stricter barriers on China-made vehicles, however, supply chains could start regionalizing further on the back of existing capacity and Chinese FDI. In the current configuration, we don’t expect Europe to limit imports of China-origin batteries and battery inputs like anodes and cathodes—especially as local players like Northvolt run into trouble. Hence, we expect Chinese exports of auto components and inputs to Europe will keep growing. Weak European auto demand could push those down, while a drop in European auto output, displaced by China-based production due to cost-competitiveness, would boost them.
We expect that China-to-EM auto exports will grow quickly, albeit with split of direct exports and local production depending on localization requirements. This growth will be boosted by a low base, overcapacity in China, and the price differential between Chinese vehicles and those made in third markets.
Forecasting globalization: Four scenarios
To game out how global manufacturing supply chains might evolve in the next five years, and what role China might play in them, we lay out four scenarios across two main axes that represent the two main drivers and arrestors of supply chain diversification (Figure 13):
- De-risking policy intensity and alignment between the US and EU. We ask whether the US and the EU are rolling out intense de-risking policies and whether they are moving broadly in the same direction (intentionally or otherwise). We assume that momentum to produce or source outside of China will be highest if policy incentives are strong, and where US and EU alignment on de-risking is high.
- The efficiency and cost appeal of manufacturing in China versus alternative production hubs. We ask whether manufacturing in China is significantly cheaper or more efficient than in third countries, or whether China’s comparative advantage is deteriorating. We assume key drivers of competitiveness include labor costs, manufacturing and logistical efficiency, foreign exchange rates, and the level of state support for manufacturing.
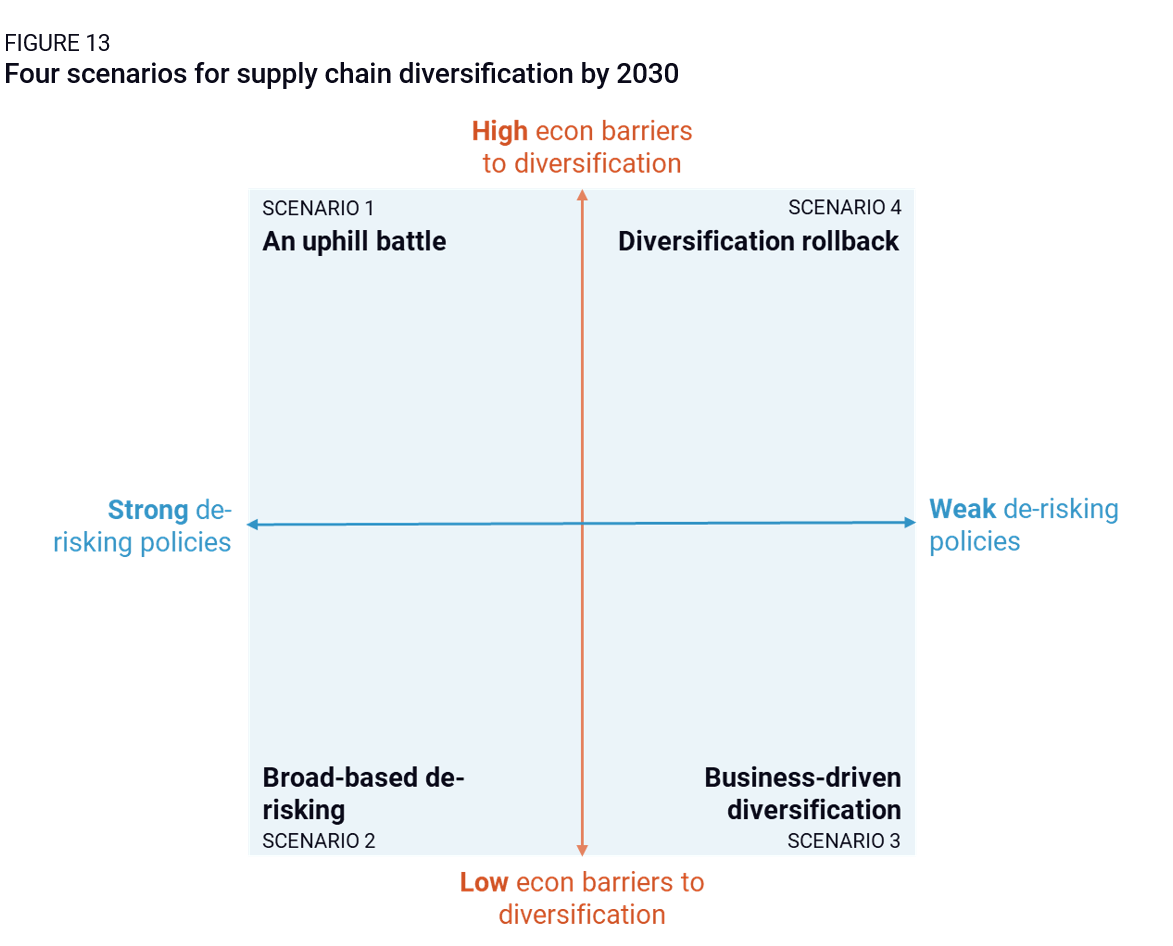
The four resulting scenarios are, by design, simplified and exaggerated. Reality will likely stand somewhere between these four extremes. However, they provide a useful analytical framework to map out pathways between and toward these four extremes, and signposts of movement in any of these four directions.
We situate today’s state of the world somewhere around the intersections of both axes. Producing in China still offers significant cost and output efficiency, but Beijing has yet to take more drastic measures to keep manufacturing in China (e.g. by letting the yuan depreciate significantly). Manufacturing in various third markets is still attractive, too. Wages are rising on the back of production relocation, but they are still competitive, and various third market governments are still offering generous relocation incentives. Most alternative production hubs, however, continue to lack China’s productive and logistical efficiency. Finally, strong US de-risking policies have shaken up global supply chains but are still focused only on a few specific industries (semiconductors, green technologies, and autos). Meanwhile, the EU has not rolled out nearly equivalent policies, despite calls for greater de-risking.
Scenario 1: An uphill battle
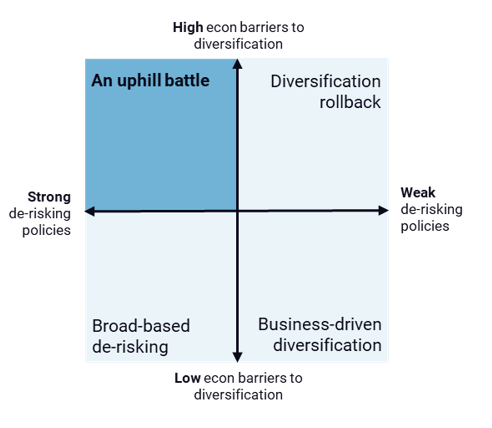
High economic barriers to diversification
In this scenario, China sticks to its supply-centered economic model, muddling through with stagnant growth but creating high barriers to de-risking. Beijing doubles down on manufacturing and exports, including through abundant state support and export facilitation. Labor costs remain low as Beijing avoids implementing necessary reforms to prop up household incomes. Chinese policies and their global spillovers lead the US and the EU to raise tariffs and other trade barriers, which in turn trigger a decision from Beijing to let the yuan depreciate.
Strong de-risking policies
Meanwhile, diplomatic tensions escalate quickly on the back of US tech controls, China’s persistent alignment with Russia, Iran, and the DPRK, and a broad use of trade defense measures by the US and the EU. This volatile mix leads China, the US, and Europe into a spiral of tit-for-tat measures. China implements strict export controls—increasing to full export bans—on a growing range of critical materials and other inputs. Increasing US-EU alignment on China, enabled by rising EU member state concerns over the employment cost of China’s export- and manufacturing-led model, drives Beijing into a corner and pushes it to escalate security crises (in Taiwan and/or the South China Sea). These flare-ups embolden the US and Europe to launch a range of strong de-risking policies, focused on sectors with highest strategic exposure to China.
Implications
Under this scenario, security-driven concerns lead US and EU leaders to fast-track de-risking efforts in most sensitive supply chains, namely critical infrastructure (e.g. telecommunications and energy equipment), sectors where China has threatened or acted to withhold critical inputs (e.g. green tech and critical minerals), and where concerns over sabotage or operational disruptions are highest (e.g. medtech and pharma). The economic cost of diversification and concerns in the US and Europe about inflation means policy efforts end up being concentrated rather than broad-based.
Diversification happens through reshoring rather than friendshoring, for two reasons. First, China’s continued support to its manufacturing sector means that emerging markets are struggling to emerge as credible, competitive manufacturing or sourcing alternatives. Second, the security imperative driving de-risking policies in this scenario means the US and EU prioritize domestic supply chains over foreign ones. However, where reshoring is impossible, for example for some critical minerals, the EU and US display openness to some level of friendshoring.
The drive to create “China-free” sectors causes a push for “deep” diversification that leads to the reshoring of entire supply chains. It also means that US and EU policies proactively limit the room for Chinese firms, inputs, and tech in de-risked supply chains.
US and EU security imperatives drive strong de-risking policies with short timelines and ambitious targets, including high tariffs, local content requirements, selective import bans, and substantial industrial policy funding. Yet economic conditions in China mean that alternative production hubs have not yet developed and need to be built from scratch. The pace of diversification is also slowed by Chinese countermeasures (e.g. export controls on critical raw materials), which render the re-creation of certain supply chains (green tech especially) particularly challenging.
Of our four case study sectors, auto and solar PVs see most momentum for diversification, but the pace of solar sector reshoring is much slower given China’s outsized role in associated supply chains (and upstream segments are stickiest). Textile and consumer electronics continue to see Chinese manufacturing and export dominance for final and intermediate goods, but Vietnamese and Indian production hubs for electronics benefit from preferential sourcing from the EU and the US.
PROSPECTS FOR GLOBAL TRADE
In this scenario, global trade slumps. The EU and US face mounting employment and inflation pressures, in part due to China’s economic policies. Defensive trade barriers and critical supply chain reshuffling also end up destroying demand in both economies. These factors lead to a contraction in goods trade, though more marked in value terms than volumes, as Chinese firms seek to dispose of their products through exports at any cost. Growth prospects for emerging economies are reduced because China remains dominant in industries where a Western decoupling strategy is not crowding it out.
The reorganization of supply chains supports world trade in the phase of building new manufacturing capacity, insofar as manufacturing investment is import-intensive (machine tools, equipment). However, the shortening of value chains for strategic goods (with a focus on re-shoring where possible) weighs on trade growth in the longer run. European demand is increasingly served by Central and Eastern European supply chains, as well as close manufacturing hubs in the MENA region. US demand is increasingly served by North American, and to a lesser degree, South American production.
Scenario 2: Broad-based de-risking
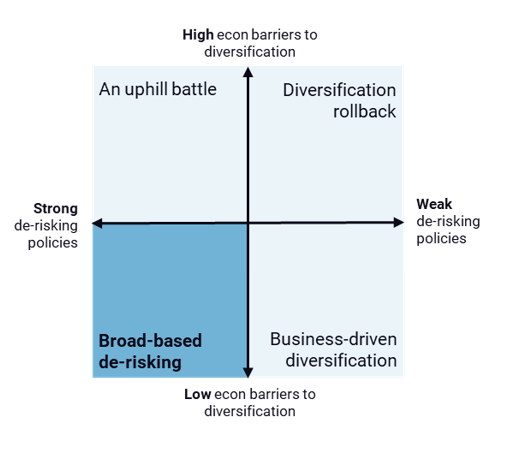
LOW economic barriers to diversification
In this scenario, Chinese policymakers shift their focus from manufacturing to consumption, acknowledging the limits of previous investment- and supply-centered policies. The move falls short of structural reforms and instead involves a redirection of China’s significant stimulus package to support household consumption.
Amid mounting fiscal constraints, Chinese leaders also move to streamline tech support policies and refocus state resources on just a few critical manufacturing industries (semiconductors, high-end ICT, green tech, and healthcare). In these areas, China maintains or expands its technological edge and retains control over critical inputs. In others, progress plateaus from 2025 levels. Leaders abandon their goal of keeping China’s manufacturing share of GDP constant and start rolling back support for lower-value add, lower-tech production.
In contrast, economic conditions are ripe for supply chain relocation in various emerging markets. As the yuan strengthens on the back of consumer stimulus, and China rolls back support policies for low-to-mid-tech manufacturing, significant manufacturing investment starts shifting to emerging markets. Booming FDI creates incentives to build up logistics and production infrastructure in these countries, further pushing out their production frontier, unlocking untapped labor reserves, and preventing costs from rising too fast.
Strong de-risking policies
China’s more focused industrial policy drives significant and fast-paced innovation outcomes in several high-tech sectors (including leading edge semiconductors), making it less dependent on Taiwan’s manufacturing capacity. This lowers the potential costs of an escalation in the Taiwan strait (but prompts the US to further tighten its export controls). China’s consumer-based growth rebound, decreased dependency on exports, and self-sufficiency successes also lead it to become more assertive in its external relations and more willing to escalate security crises, including to fend off tightened tech controls. As the prospect of a security crisis involving China becomes more tangible, the EU and US ramp up de-risking policies in concert.
In this scenario, the EU and US align their China policies because a short-lived US-EU trade war imposed only limited economic damage on both parties yet strengthened both sides’ leaders. These conditions allow European Commission President Ursula Von der Leyen, in particular, to follow a tough-on-China policy with member state support. Similarly, a short-lived cycle of threats and imposition of ultimately manageable tariffs on various US trade partners have left emerging market exports price-competitive.
Implications
In this scenario, diversification happens in two waves. The first wave involves “organic” diversification in lower-tech, lower value-add goods, prompted by China’s economic rebalancing, rollback of support policies to “legacy” sectors, and currency strength. Emerging markets absorb new production in large volumes. Relocation is also enabled by Chinese firms relocating outside of China, and spans both final assembly activity and upstream production where the cost differential between China and third markets justify a change of manufacturing location (within our case study sectors, this would include apparel assembly, some electronic products, and lower-value-add textile and auto parts).
A second wave of diversification ensues from intense US and EU de-risking policies, triggered by repeat security crises in the Taiwan strait. In this second wave, diversification momentum expands to the few sectors that still display high and persistent China exposure (ICT/telecommunication, semiconductors, green tech and pharma). While China’s dominance of some of these supply chains plays to slow de-risking, economic barriers are lower than in Scenario 1, meaning that relocation happens both faster and to a greater extent.
In this scenario, production relocates to third markets rather than the US and the EU for two reasons. First, Asia, Latin America, and CEE remain comparatively more attractive “alt China” destinations. Second, the US is more lenient toward emerging markets, because bilateral deals are reached that allow the administration to roll back tariffs out of inflation concerns, and/or because supporters of a de-risking of supply chains away from China gain the upper hand over members of the administrations who prioritize bringing manufacturing jobs back to the US.
PROSPECTS FOR Global TRADE
In this two-stage scenario, the outlook for world trade is positive, both in value and volume. Industries with lower value-add feeds shift out of China, increasing trade volumes between the US and Europe and new industrial hubs in ASEAN, South Asia, and Latin America. In the short term, diversification also relies heavily on Chinese inputs, boosting intra-Asia and China-Latin America volumes (these flows then dwindle over time, as new manufacturing hubs absorb more upstream manufacturing capacity).
In the second stage of this scenario, China-world trade drops, as the EU and the US push for more drastic de-risking policies. Given the strategic nature of supply chains at stake, regionalization is the favored outcome for many target industries. Yet this scenario also assumes greater Chinese openness to imports across a range of industries, positive prospects for major emerging markets that create greater domestic demand, and relatively low inflationary pressures in the US and Europe. As such, the global outlook for trade and logistics is broadly favorable.
Scenario 3: Business-driven diversification
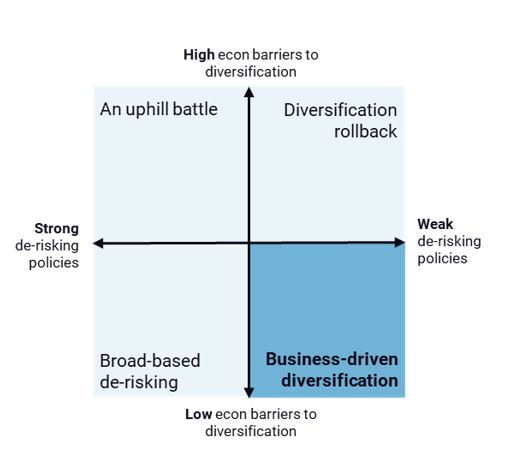
LOW economic barriers to diversification
In this scenario, China’s leadership initiates comprehensive reforms to rebalance its economy. While these reforms are ultimately effective in tackling the longstanding, structural issues in China’s economy, they generate significant short-term volatility and uncertainty that hits the efficiency and reliability of China’s manufacturing sector. Efforts to resolve local debt issues, tackle China’s fiscal imbalances, rationalize the state sector, and reform the country’s financial system unleash a cycle of bankruptcies, layoffs, and spending cuts, including a drastic repeal of industrial subsidies and reduction in social benefits. These actions, in turn, trigger major production disruptions—strikes, factory closures, rising prices, and currency volatility. In comparison, major emerging markets and European and North American production hubs offer stabler conditions for manufacturing and sourcing.
Weak de-risking policies
Domestic uncertainties shift China’s focus inward, tempering its security posture, including on Taiwan and the South China Sea. It also leads Beijing to roll back some of its support for Russia as Chinese leaders seek to maintain positive, stable relations with key trade partners throughout painful domestic adjustments.
The US and EU respond positively to China’s reform agenda. European and US concerns over China’s unfair economic practices, aggressive foreign policy, and technological self-sufficiency efforts begin to subside as China’s reform efforts unfold and the country experiences greater instability. As state support dries up, China’s tech firms struggle, prompting the US to withhold further escalation in tech controls. This, in turn, slows down the US-China tit-for-tat cycle. As prices in China rise again and export growth slows, EU firms in strategic sectors, or in industries so far dominated by Chinese firms, regain a competitive footing on their home market, assuaging EU concerns over deindustrialization.
Implications
In this scenario, the US and EU progressively back away from strong de-risking policies, but a broad diversification of supply chains still progresses organically. Global prices are no longer artificially deflated by Chinese state support and production overcapacity, boosting the competitiveness of third countries’ manufacturing sector. Both reshoring and friendshoring happen, but this time strictly based on economic rationale. High-volume, lower-tech goods migrate quickly to emerging markets (including apparel, consumer electronics and solar PV), while parts of global supply chains for more advanced sectors (like autos) start reshoring to the EU and the US.
Despite an absence of strong de-risking policies, economic uncertainty in China leads production to relocate faster than in Scenario 2. Emerging and advanced economies alike are open to Chinese intermediate inputs and products from Chinese firms, which further speeds up production capacity buildout in alternative locations.
In this scenario, diversification happens across a broad range of sectors, as production disruptions in China drive relocation even in sectors where the country had swallowed entire supply chains (e.g. batteries). The depth of supply chain restructuring varies across sectors, depending on the economic rationale—but it is boosted by the fact that emerging markets, in a relatively strong economic position vis-à-vis China, demand technology transfers and local content requirements from Chinese investors.
PROSPECTS FOR Global TRADE
In this scenario, instability in China’s economy dampens global growth and trade prospects, at least in the short term. Both imports to and exports from China are affected by increased volatility in China’s economy and financial woes among China’s exporters. The rise of new industrial hubs globally acts as a growth relay for world trade, and cushions some of the effect of the slowdown in Chinese exports on world trade volumes—but not all. This scenario is also associated with a boom in regional trade, as Chinese industry becomes less cost competitive and geographical and trade integration factors start playing a larger role in manufacturing relocations.
Scenario 4: Diversification rollback
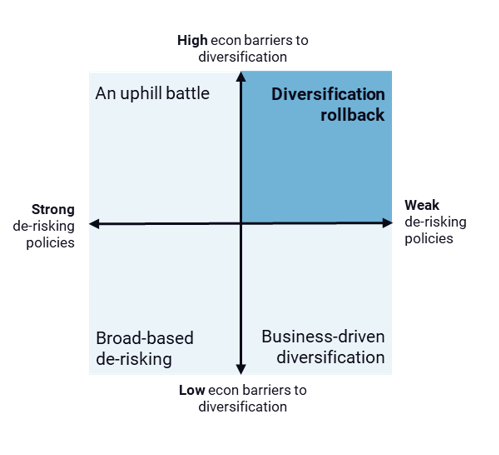
High economic barriers to diversification
In this scenario, China maintains its current economic model, doubling down on supply-side support for manufacturing and exports rather than boosting domestic demand. It also allows substantial currency depreciation to offset some of the effects of the US’s initial round of across-the-board tariffs and other trade defense measures. These actions, combined with maximalist US trade measures against other emerging markets, mean that production in China remains more cost-efficient than in other destinations.
Weak de-risking policies
In this scenario, the new US administration initially pursued, but then reversed, a maximalist trade policy that triggered record inflation but no meaningful reshoring of supply chains. The administration’s emphasis on reducing trade deficits and using tariffs to tackle peripheral issues like immigration led it to roll out significant across-the-board restrictions on China and major partners including the EU, Vietnam, Mexico, and India. The administration also imposed restrictions on imports of goods made by Chinese firms in third countries and on goods from third countries containing high levels of Chinese value-add. Finally, in a drive to offset domestic tax cuts and streamline government spending, the administration repealed consumer and manufacturing subsidies under programs like the IRA. These measures end up generating record inflation, destroying US demand, dampening FDI and fueling unemployment—ultimately feeding public discontent.
Faced with domestic instability on the economic and political fronts, the US administration decides to roll back most of its trade policies. The reversal is framed positively, as a grand bargain with China that would see a repeal of tariffs and loosening of tech controls in exchange for major concessions from the part of Beijing, including more efforts to combat fentanyl trade, a further opening of its financial and procurement sectors to US firms, and more. A US-China deal diminishes security tensions in the short run, including concerns of China withholding critical inputs to the US.
Meanwhile, the EU, reeling from a costly trade war with the US, lacks political capital and economic resources to implement de-risking policies. US tariffs on China redirected significant volumes of Chinese exports to the EU, harming European industry and jobs. Unable to spur local or third market alternatives, Europe increased its dependence on China for a range of strategic goods, including green technologies, further hampering de-risking impulses.
IMPLICATIONS
In this scenario, the depth and scope of diversification is very limited—and even reverses in some sectors. A maximalist US trade agenda that includes high tariffs on key diversification partners prevents emerging markets from developing as alternative production hubs. Companies that moved part of their production or sourcing to emerging markets like Mexico or Vietnam are not only faced with US levies on imports of final goods made in both countries, but also on imports that contain Chinese intermediate inputs or involve Chinese suppliers established in these countries.
As US measures impose excessive costs on diversifying MNCs, China remains a highly attractive manufacturing location despite record high across-the-board tariffs. Rising trade tensions with the US impact emerging markets’ economic and political stability, putting substantial local production and employment at risk, further degrading their ability to compete with China’s prices and production efficiency. This maximalist trade stance compels some companies to reshore production to the US, but these reshoring moves are stunted by the US’s inflationary spike and repeal of manufacturing subsidies. In this scenario, only a few sectors with low price elasticity and where the US already has some production capacity are able to reshore additional production. In most cases, however, the result is pure demand and supply destruction: US consumers buy less, and global firms produce in lower volumes. With the lack of any strong de-risking policies from the EU, and the US gradually entering in a grand bargain with China, many supply chains return to the 2025 status quo (including those under review in this report).
PROSPECTS FOR GLOBAL TRADE
In this scenario, where the US consumer is weakened by trade policy and inflation, and Europe’s economy is shattered by Chinese overcapacity spillovers, world trade loses two of its most powerful trade growth engines. These macroeconomic difficulties, coupled with an initially all-out trade war, hamper both US-China trade flows and the development of new industrial centers and associated trade flows. Chinese exports remain underpinned by state support and hence turn toward Europe—plagued by weak demand, however—and emerging markets, which serve as an imperfect and limited relay of growth. Yet both volumes and value come down over time.
Appendix: Methodological notes and definitions
In this report, we analyze the state of supply chain diversification in four sectors: apparel, consumer electronics, solar panels, and automotive. We selected these industries because of their varying manufacturing and technological complexity and strategic relevance. For each, we look at China’s share of global exports across four steps of the supply chain (Table 2).
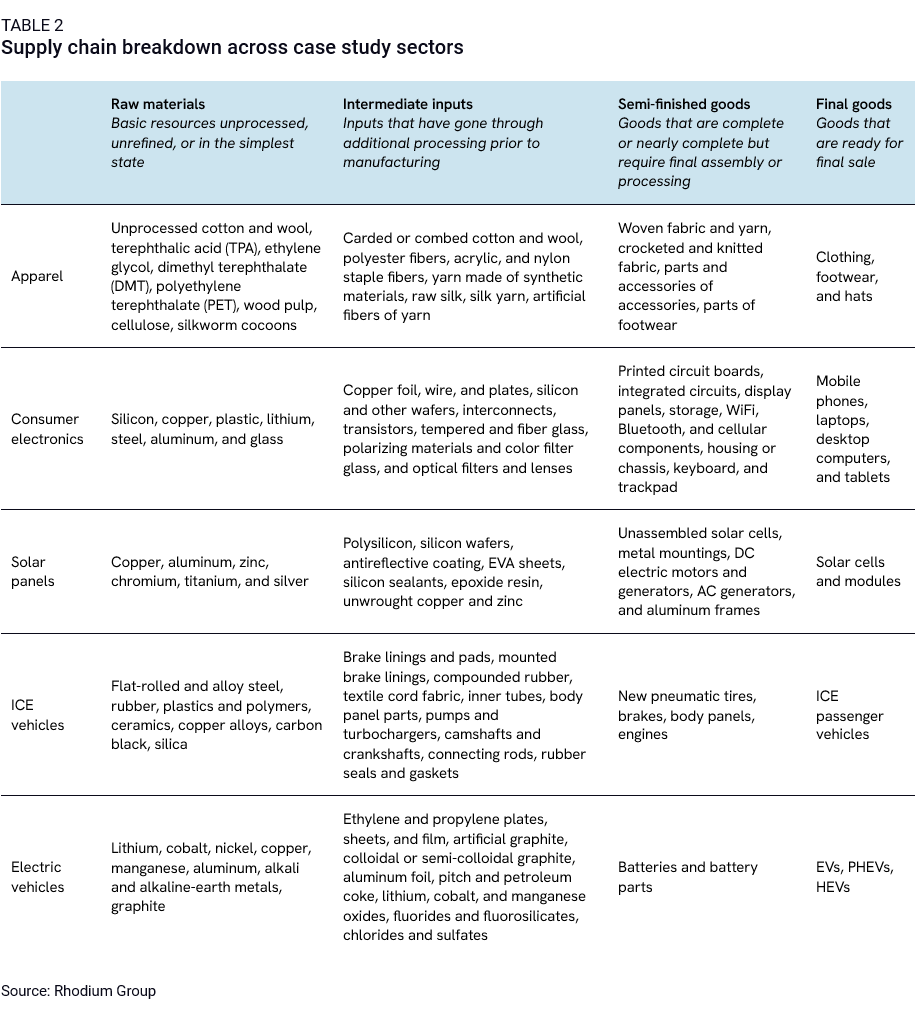
We calculate China’s share of global exports at each supply chain step by aggregating the export of relevant products at the 6-digit HS code level, the most detailed trade data available across countries. Still, many 6-digit HS codes are not industry-specific. As a result, our analysis includes some products that are used in other sectors, particularly further upstream. For example, in apparel, we include polyethylene terephthalate (PET), a widely used material that is the main input to polyester, in our analysis of the raw material supply chain. When possible, though, we supplemented our aggregate analysis with deeper dives into industry-specific products. For the automotive sector, for example, we narrowed our analysis of intermediate inputs and semi-finished goods to select automotive components including body panels, brakes, tires, and internal combustion engines, as well as lithium-ion batteries and their inputs.
The data presented in this report is a good approximation of China’s position in the apparel, consumer electronics, solar panels, and automotive supply chains. But it can only be taken as a proxy. For one, as mentioned above, some products in our analysis are used across sectors. Our data besides likely understates transshipped goods trade and hence China’s role in select global supply chains. If a cell phone made in China is shipped through the Netherlands prior to heading to the broader EU market, it may show up twice in the global export data, once from China and again from the Netherlands (“Rotterdam effect”). A solar panel shipped from China through Thailand to the US may similarly be counted twice, as exporters seek to circumvent US duties on Chinese solar panels, inflating the denominator of our equation—the value of global exports—and making China’s share of global solar panel exports seem lower than it is. Our analysis of global trade in value terms, rather than volume, further understates China’s dominance in sectors where it has a distinct price advantage, like EVs. Trade data is finally only part of the picture when it comes to understanding global supply chains. Some supply chains, like China’s production of cotton-based apparel, may be fully localized, meaning the raw materials, intermediate inputs, and semi-finished goods never cross a border and thus do not show up in trade data until they are exported as a final good. To provide a more comprehensive picture of the state of supply chain diversification, we complement our trade data analysis with a look at FDI trends, company statements, and news reporting.
Acknowledgements
The authors would like to thank Simon Ray and Isabelle Thizy for their careful review and helpful comments on the draft. The authors would also like to thank Rhodium Group’s Ian Hutchinson, Jaspreet Sohal, Logan Wright, Reva Goujon, Gregor Sebastian, and Ben Reynolds for their review and contributions.
Footnotes
Consumer electronics for the purpose of this section include laptops, desktop computers, smartphones, and tablets—as well as key inputs and components. See the methodological appendix for more detail of each category.