Road to Recovery? Tracking the Impact of COVID-19 on the World’s Major Economies
To support efforts to track the impacts of COVID-19 in real time, we're tracking the key drivers of emissions for the world's largest emitters: the United States, the European Union, China, and India.
2020 has been an unusual year by any measure. The unprecedented scope and scale of the COVID-19 pandemic and its economic aftershocks have meant that no country or sector of the economy has escaped unscathed. Over the past nine months, we have seen levels of volatility unlike anything in recent history as industries, governments, and consumers have struggled to anticipate just how the virus—and our response to it—will unfold. This uncertainty extends to the potential impact on greenhouse gas (GHG) emissions as we grapple to understand the impacts to major emitting sectors of the economy—like industrial production, transportation, and electric power—and look for ways to rebuild that accelerate decarbonization. The climate and clean energy community has the data we need to understand annual variation in GHG emissions, but navigating the rapidly evolving landscape of the COVID-19 crisis requires more frequent, up-to-date data.
To support efforts to track the impacts of COVID-19 in real time, Rhodium is launching a set of dashboards to track and visualize the key drivers of emissions for the world’s largest emitters: the United States, the European Union, China, and India. Together these economies account for two-thirds of the world’s economic activity and generate over 50% of global GHG emissions. How they respond to the pandemic and economic fallout will be critical to global decarbonization efforts. The ClimateDeck COVID tracker dashboards provide the most up-to-date monthly metrics from industry, electric power, and transportation and highlight key insights into the pace and direction of recovery. In this note, we highlight a selection of data from our dashboards to give context and describe significant trends we’ve observed as the pandemic and its economic repercussions have unfolded.
Industry
Industry is the single largest source of GHG emissions across the four major economies, accounting for 37% of their combined emissions.[1] Following the start of the COVID-19 crisis, each of the four economies experienced the sharpest decline in industrial activity about a month after enacting lockdowns, as factories adhered to lockdown restrictions, supply chains faltered, and global demand plummeted. In China, where the industrial sector accounts for nearly half of all emissions, industrial production fell by 13.5% in February, year-on-year (Figure 1). India, the EU, and the US, where the most stringent lockdowns occurred in mid-March, registered even sharper declines at their low point in April—37%, 28%, and 16%, respectively.
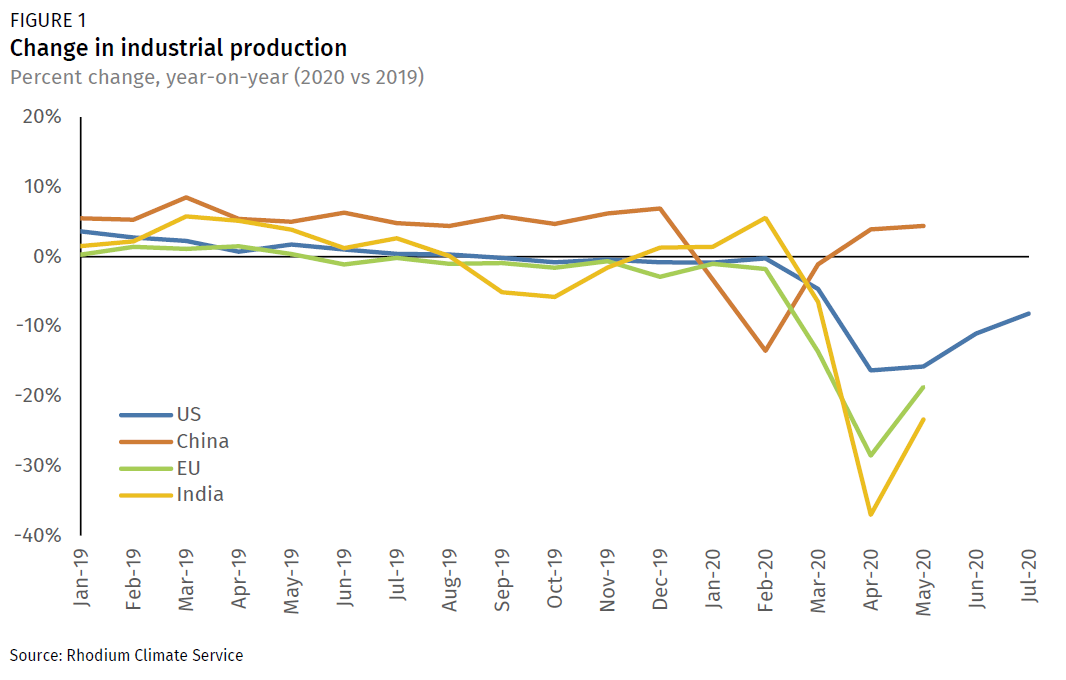
As economies begin to reopen, industry has shown signs of fairly rapid recovery. Progress in China has been particularly swift, driven by state support for infrastructure investments and loans for small businesses. Industrial production bounced back to near 2019 levels a month after its February plunge. By April, industrial output outpaced 2019 levels, making China the only major economy to see growth this year. Despite some recent signs of recovery, the industrial sectors in the US, EU, and India are still in negative territory, with year-on-year declines of 8%, 19%, and 23%, respectively, for the most recent month of available data (Figure 1).
Within the industrial sector, some sub-sectors have fared better than others. For example, cement has shown a more robust recovery than iron and steel to date (Figure 2). At the peak of the lockdowns, cement production fell by 14% in the US and 25% in China year-on-year, while the EU and India saw even steeper declines of 40% and 85%, respectively. Since then, cement production has shown signs of recovery in all four economies as construction resumes, albeit at different paces. In China, cement production was up 10% year-on-year in May, spurred by an increase in China’s infrastructure investment. In the EU, US, and India, cement production in May showed more modest but still substantial gains, bouncing back to 5%, 6%, and 22% year-on-year declines, respectively.
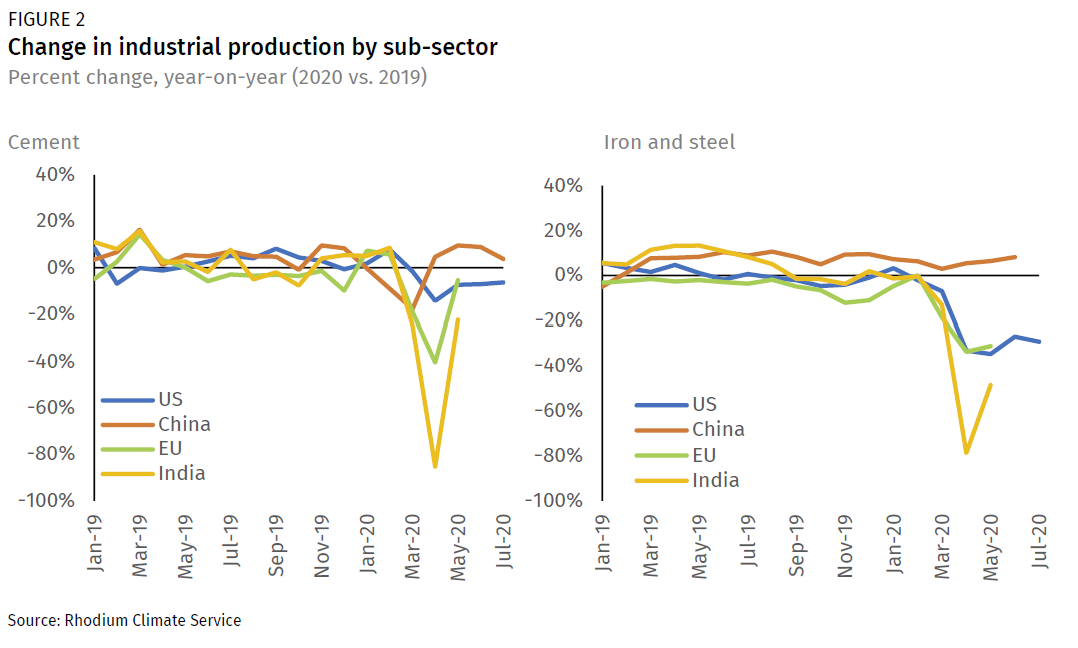
Iron and steel production has not recovered as quickly as cement, however. Like cement, construction-led demand for iron and steel has recovered. But unlike cement, iron and steel relies on demand from a diverse set of industries that remain sluggish, including auto manufacturing and mechanical equipment production. In the US, iron and steel production dropped to a low of 35% below 2019 levels in May, and has remained relatively flat through July (Figure 2). The picture is much the same in the EU. In India, the world’s second-largest steel producer, strict lockdowns triggered a steep drop in output, with production plunging by 79% in April year-on-year. Output began to bounce back in May, however, buoyed by demand from China. Chinese iron and steel never took a meaningful hit in 2020, maintaining production at levels that exceed 2019 production throughout 2020.
Electric power
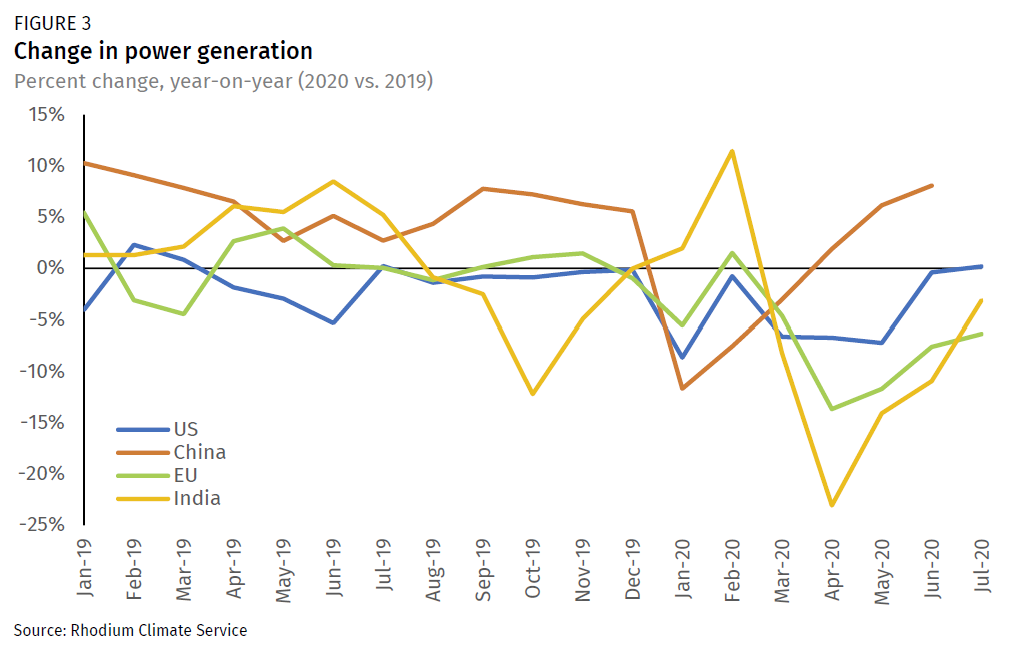
For all four economies, power generation is rapidly returning to 2019 levels (Figure 3). During the peak of the lockdowns, commercial and industrial power demand fell as restaurants, office buildings, and factories were shuttered. China’s power generation decreased by 11.6% in January. In the EU and India, the sharpest year-on-year drop in power generation was in April, by 13% and 23%, respectively. In the US, power generation started 2020 with a 5.2% reduction in January due to an abnormally warm winter, rebounding in February before tumbling again as states issued lockdown orders in an effort to contain the fast-moving pandemic. US electricity generation hit its low in May (7.5% year-on-year decline), when the majority of states had been under stay-at-home orders for over a month.
As lockdown measures have eased and economies have begun to reopen, power generation has bounced back. China’s electricity production rebounded in March and the following months, rising 8% in June above the same month last year. By July of this year, the US had fully recovered to power generation levels of 2019, while India and the EU were at 3% and 6% below last year’s levels, respectively. This recovery in electricity production was mostly driven by the recovery in the industrial sector, the primary source of energy consumption in China, India, the US, and the second largest in the EU.
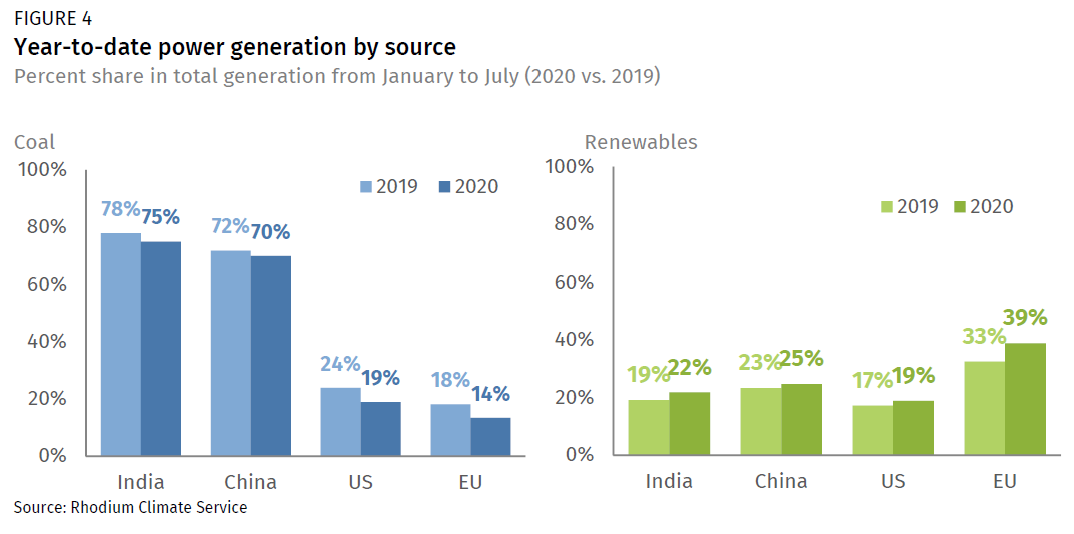
Across all four economies, weakened power demand has put pressure on coal-fired generation and boosted the share of generation from renewable sources (Figure 4). In the US and the EU, cheap natural gas has further exacerbated the competitive pressure on coal. As the fallout from the pandemic cut energy demand in the EU, renewable generation made up a larger share of total generation than fossil fuels for the first time in history. History was also made in the US when coal generation fell below wind and solar in the late spring. While US coal generation has been recovering in recent months, its year-to-date market share remains 5 percentage points below 2019 levels. In India, coal generation fell from 78% in 2019 to 75% in 2020 on a year-to-date basis. Meanwhile, generation from renewables increased from 19% to 22%, due to a decline in total electricity demand during the lockdown, India’s policy push for solar infrastructure, and record-low solar costs. In China, coal generation’s share dropped 3 percentage points year-to-date due to the reduction in industrial electricity demand, while renewable generation increased by 2 points, attributable to the mandates to increase renewable shares in 9 provinces.
Transportation
At the onset of the COVID-19 pandemic, governments across the world restricted non-essential travel and international flights to limit transmission of the virus. As a result, COVID-19’s most dramatic immediate effect on energy markets was in the transportation sector. But domestic travel restrictions have been the first to lift in most regions. As a result, recent data show a fast recovery for road and rail transportation, although air travel has continued to stall.
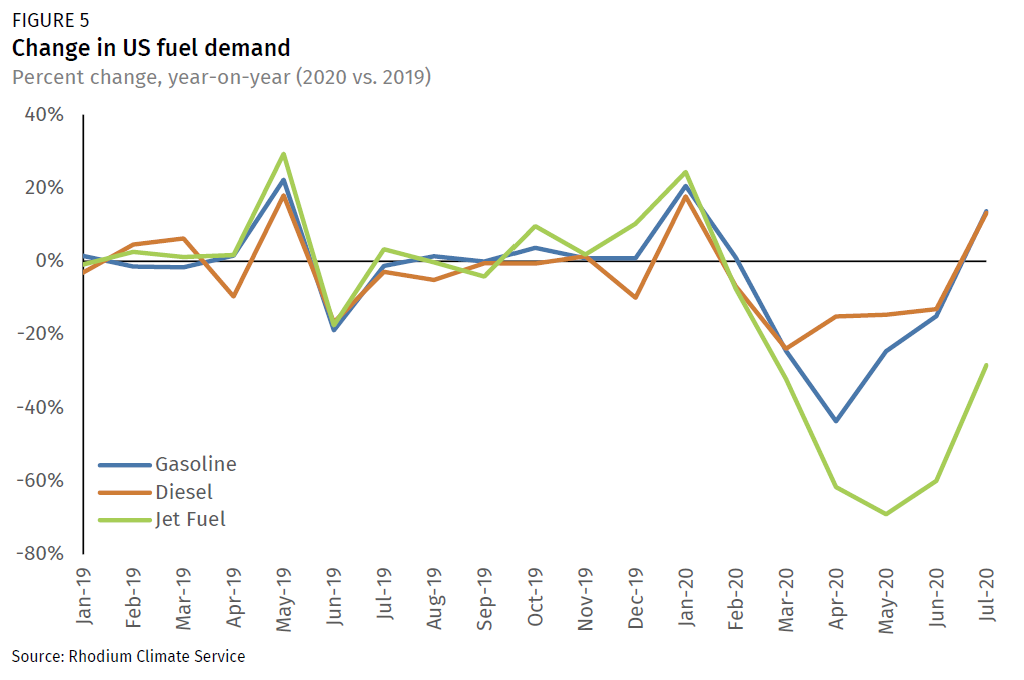
In the US, for example, estimates of the amount of on-road travel (measured by vehicle-miles-traveled or VMT) dropped 40% in April (year-on-year), but recovered substantially through May, settling at 13% below 2019 levels in June. More recent VMT data is not available, but in July, gasoline demand rebounded to 14% above 2019 levels (year-on-year), indicating the summer driving season may have pushed VMT back up to pre-pandemic levels. Jet fuel demand is also recovering but not yet fully—after falling to 60% below 2019 levels in May, it recovered to 28% below 2019 levels as of July (Figure 5).
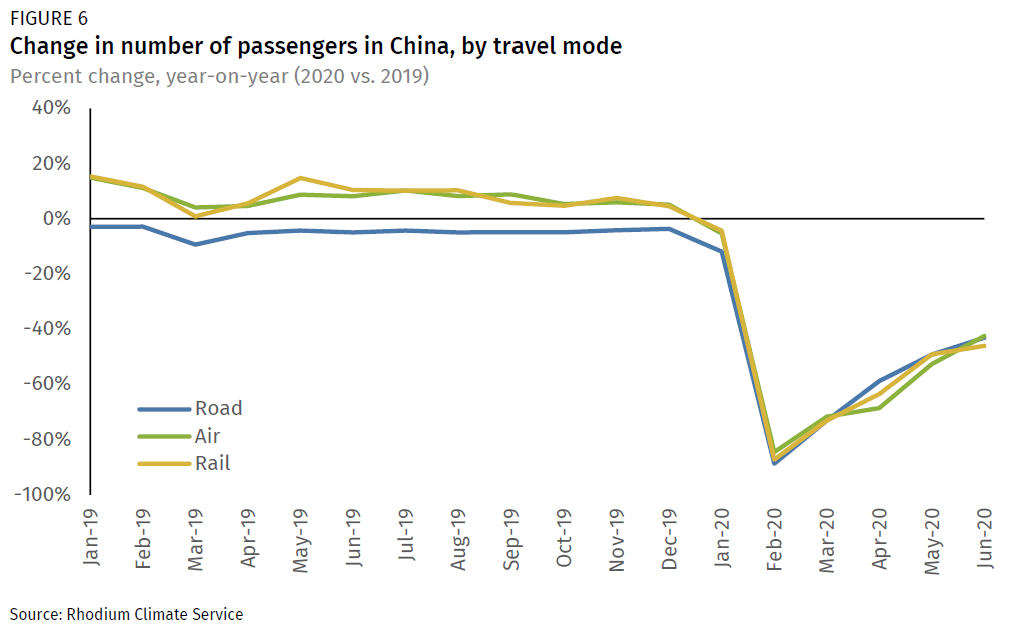
Monthly fuel consumption data for 2020 is not yet publicly available for the other three economies, but other data provides insight into the pace of recovery in transportation demand. For example, in China, the number of passengers traveling by road, rail, and air fell in unison—and steeply—in the month of February (89%, 85%, 87%, year-on year, respectively). At the end of February, China began reopening businesses. In March, the government resumed issuing visas for international travelers, and by June government offices were in full operation. Travel has recovered at the same pace, although the number of passengers remained below the numbers observed last year as of June.
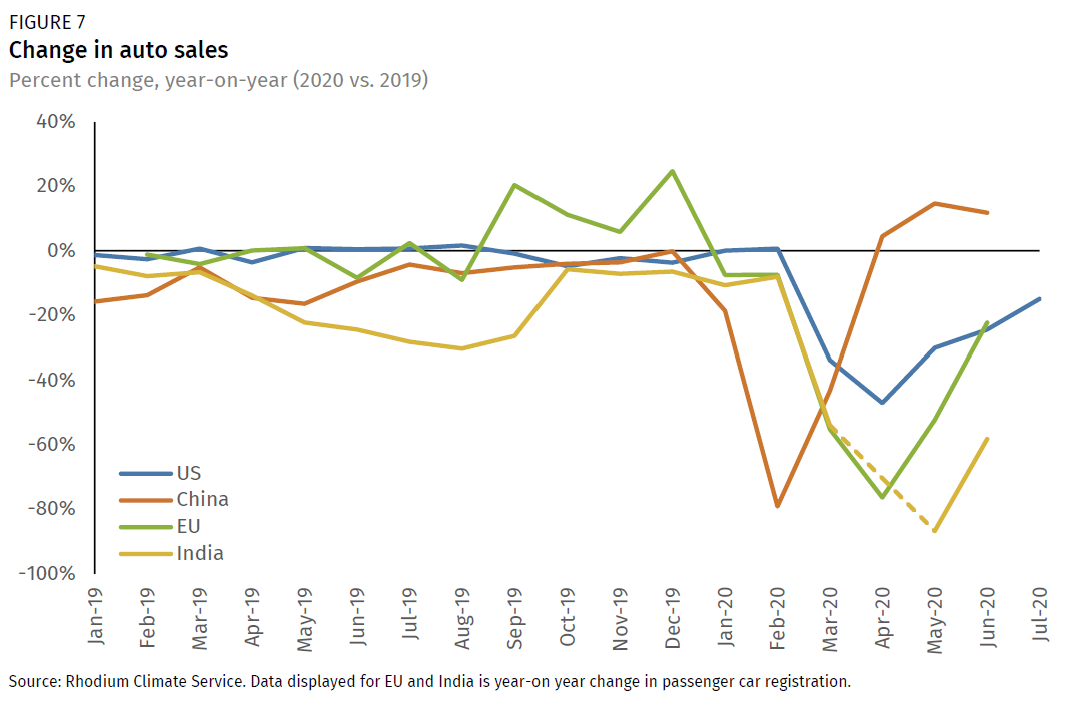
As driving demand picks up, so has demand for new cars. In the initial stages of the lockdowns, car sales were severely impacted as dealerships were forced to close or limit operations, people stayed at home, and demand from business and rental car companies plummeted. In February, China reported that automobile sales were 79% below 2019 levels (Figure 7). By July, automobile sales had risen 12% above 2019 levels, driven by a combination of pent-up demand, incentives and subsidies by local governments, heavy discounting (especially during China’s Labor Day holidays in May), and a rise in first-time car buyers looking to avoid public transit due to fears around the spread of the virus. In the US, automobile sales dropped 47% in April on a year-on-year basis, the biggest plunge in sales since the Great Recession and the automaker bankruptcies of 2009. Struggling automakers lured buyers back to dealerships with generous financial incentives, contributing to a pronounced increase in sales from May to July, but sales still remained 15% below 2019 levels.
In India and the EU, vehicle registrations are ramping up after a steep decline during the months of lockdown. Timely car sales data in both countries is not available on a monthly basis, but registrations based on reporting by major automakers serve as a good proxy. In the EU, passenger car registrations were down 76% year-on-year in April, rising to a 22% year-on-year decline by June. No data was reported in April for India, but passenger car registrations were down 87% year-on-year in May. Indian car registrations began to recover in June, but remained 58% below levels observed at the same time last year.
Rhodium’s COVID-19 response trackers
By tracking COVID-19’s impact on key drivers of emissions in the world’s major economies, we gain insight into the pace and direction of recovery, and into ways to rebuild that could accelerate decarbonization. Over the coming months, Rhodium will continue to track these key drivers of emissions, as well as green stimulus spending in the four major economies.
[1] As of 2017, the most recent year for which we have aggregate emissions data for all four economies.