Deconstructing the Virus Impact: How China’s Recovery Will Unfold
Rhodium’s China Activity Tracker (R-CAT) sheds light on how the economy paused and how it will restart by tracking production volumes across the industrial spectrum and in key industries.
Data from China offer a glimpse of the economic damage caused by COVID-19: a broad contraction in the first two months of the year ranging from industrial output (-13.5% y/y) to fixed asset investment (-24.5%) and retail sales (-20.5%). This picture offers a sense of the magnitude of the impact, but doesn’t tell us much about the sequence of economic outcomes for China from depressed consumption and stalled output.
Rhodium’s China Activity Tracker (R-CAT) sheds light on how the economy paused and how it will restart by tracking production volumes across the industrial spectrum and in key industries. The R-CAT reveals that property-related output and the production of intermediate inputs to manufacturing were less negatively impacted than compared with consumer goods output, the hardest hit in our sample. Looking ahead, however, the property sector presents the greatest downside risk this year, and policymakers have little to no room for the same expansive fiscal and monetary policy that saved the day in 2009.
The Need for a Better Indicator
In this new reality, the key questions are how much China’s GDP will slow, how long this slowdown will last and how policymakers will respond. Many have now chimed in, with even state-linked voices speaking openly about downside expectations—CICC for one slashed its 2020 GDP growth projection to 2.6% from 6.1%. After the initial cover-up of the virus outbreak in China, a series of dire economic reports have triggered speculation that Beijing is embracing a new era of greater data transparency, but we are skeptical. Alternative indicators to the official data are useful to gauge the true state of economic activity, distinct from official messaging.
A look beneath the headline data offers a more nuanced view of the relative impact of the virus outbreak on segments of China’s economy. Our preferred measure of the changing pace of industrial activity growth, the Rhodium China Activity Tracker (R-CAT), still takes official NBS data as its base, but samples raw output volumes rather than values (where data smoothing tends to occur) and weights them based on our judgement of economic significance and preference for more volatile data. Raw output volumes reflect far more cyclicality than headline GDP would indicate, offering a picture of activity more in line with China’s major economic swings. The R-CAT applies bigger weights to more volatile and economically important components and indexes a weighted average of 103 different output indicators after seasonal adjustment. Based on China’s input-output table, we derive six industry sub-indicators depending on how each product is used in the economy.
While we don’t claim that the R-CAT offers a definitive reading of industrial activity, it is constructed based on the same survey data NBS relies upon to calculate industrial value added, which feeds into secondary industry GDP. These underlying data show a far higher degree of cyclicality than headline data, highlighting the important turning points in China’s activity and growth over the past decade.
Heavy Industry Outperforms Light Industry
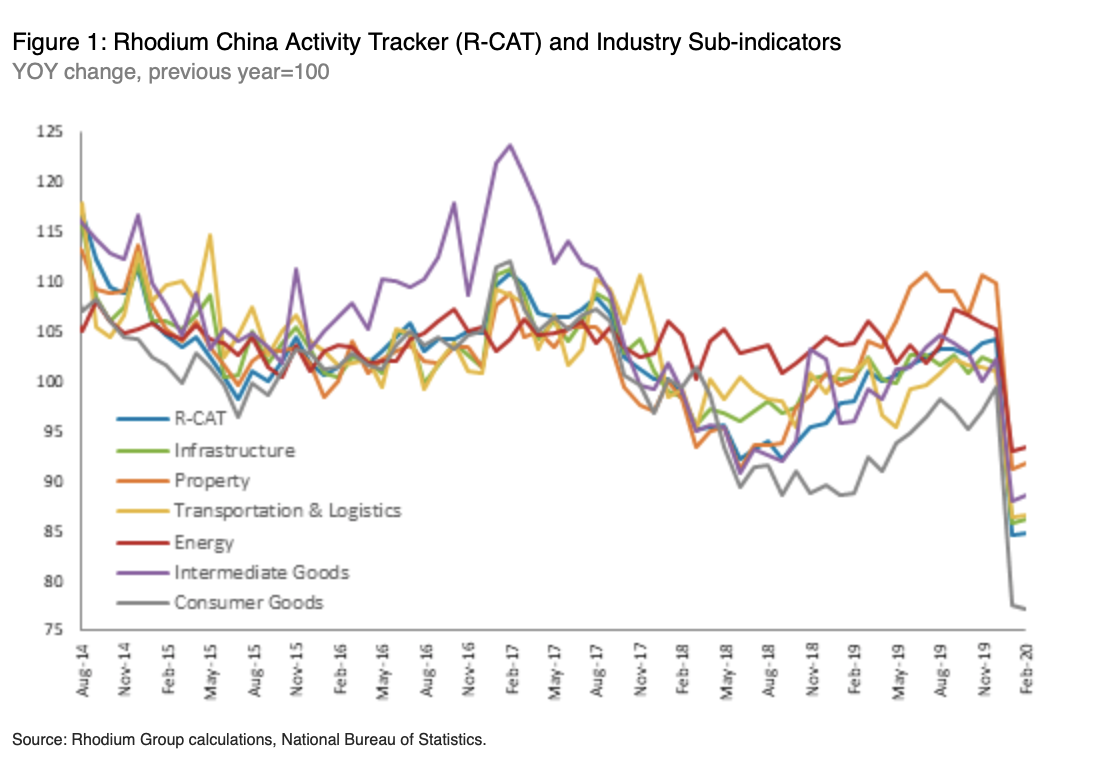
In aggregate, the R-CAT tracks the magnitude of contraction indicated by headline data in the first two months of the year. In February, the R-CAT recorded a 15% drop in industrial output volumes compared with last year, seasonally adjusted for the moving Chinese New Year holiday. This is the lowest reading since 2010, the earliest date for which we have data. The biggest previous drop over the past decade was –8.8% y/y in June 2018 during China’s deleveraging campaign.
More revealing is what the R-CAT industry sub-indicators tell us about relative impacts across different segments of the economy. The clear takeaway is that heavy industrial segments have been relatively less affected than light manufacturing so far. This suggests Beijing prioritizes maintaining economic activity where possible in the short term and preventing a sharper collapse in areas that present the biggest systemic risks.
Figure 1 shows intermediate goods production declined by the smallest margin across our sample (6.5%), suggesting Beijing has been able to prevent a far deeper contraction in industries where there are dominant SOEs to pick up the slack. These are among the heaviest industrial components in our sample, covering raw materials, plastics and rubber, building materials, and metal products. The presence of SOEs in these industries also increases the likelihood of data smoothing to make things look less bad. A few components helped avoid a sharper contraction. Crude oil output (non-seasonally adjusted) continued to rise, by 4% y/y in both January and February, keeping the intermediate goods indicator afloat. However, crude output is not as strong an indicator of China’s overall domestic demand for energy given its reliance on imported oil.
Both infrastructure and transportation & logistics contracted by 13-14% y/y in 2020 to date. Falling refined oil output due to depressed activity in China and global oil market distress was among the biggest downside contributors to both indicators, while infrastructure was also weighed down by cement, steel products and equipment and machinery. Transportation was effectively shut down nationwide during the quarantine, so a deeper decline in that indicator would not be surprising, but strong growth in locomotive output kept it from falling further.
Consumer goods output took the biggest hit (-22.5%). The extension of the Chinese New Year holiday and the virus-related national lockdown likely drove the sharp fall in both consumer demand and consumer goods manufacturing. With many laborers, particularly migrant workers, unable to return to work, higher-end light manufacturing appears to have collapsed relatively more than low-end manufacturing heavy industrial activity. Looking at the granular level of consumer goods components, the biggest contributors to the downturn were food and beverage staples, traditional Chinese medicine, passenger cars, household appliances, and electronics. Importantly, though, consumer goods output was already lagging other industrial activities primarily due to a faltering auto sector and weak property investment.
Property-Linked Output Least Impacted—For Now
The property indicator showed the smallest decline (-8.5%) among the main R-CAT industries. The property index is built from a variety of construction materials inputs. At a granular level the components that distinguish it from other heavy industry indicators are the absence of oil and refined products and the inclusion of nonferrous metals, both of which contributed to its outperformance compared to infrastructure, where there is some overlap in construction materials. Crude steel output also increased, reflecting the fact that blast furnaces are expensive to shut down, and boosting the property indicator.
Though property-linked output was relatively less affected, data on transactions were severely negative, indicating that the property sector is the key downside risk to the outlook this year as developers face limitations on financing, and struggle with debt sustainability, and property demand deteriorates. New construction starts fell 25.9% as migrant construction workers were kept off construction sites. Developers also shuttered showrooms, pushing sales of finished homes down 32.7%. In response, property developers have started slashing prices.
The risk now is that the expectation of further price cuts amid a long-awaited correction in the property market will prompt buyers to wait on the sidelines for prices to bottom out. A decline in the property sector would further impair industrial production in steel, cement, plastic, glass, and aluminum—weighing down any potential recovery after the immediate effects of the outbreak and containment policies in China are past.
Outlook: Sequencing the Recovery
China has suffered through the immediate economic impact of COVID-19 and is now working toward recovery. Some initial signs are positive—the end of strict isolation measures means that people are mostly back to work and many aspects of economic life can resume, even if overall activity remains at a lower level. Yet ongoing headwinds suggest differential recovery rates across industries. Infrastructure and transportation & logistics are more likely to pick up first given state support, financing conditions, and lower exposure to exports. Consumer goods manufacturing will be weighed down by migration restrictions and weaker external demand for exports. Property remains the key downside risk as developers are unable to fund activity and investment demand is weak.
Restrictions on migration, particularly with regard to migrant workers, are the key constraint on manufacturing and construction activity. Ministry of Transport data suggest the majority of migrant workers have returned to work, but ongoing local restrictions, fewer job opportunities, and quarantine measures will limit a short-term activity rebound. Consistent with the outperformance of heavier industry R-CAT components, state-owned firms will likely play a role in supporting activity. SOEs primarily hire locally and are less affected by population flows. Regions and industries less reliant on private business and with more mobile workforces will likely return to full production ahead of coastal provinces where private businesses are dominant. However, as shown by recent turmoil at the Hubei border following the lifting of travel restrictions, the path to resuming activity will be neither linear nor without disruption.
Even if movement restrictions are relaxed and manufacturing activity stabilizes, external demand is weakening quickly, with deteriorating economic conditions in the US and EU as they struggle with virus lockdowns. Global supply chains will see further disruption, complicating a pickup in higher-end manufacturing activity in China. The upside for domestic firms, particularly major commodity importing SOEs, is that falling commodity prices will help offset the shock to domestic activity. Putting these pieces together, we assume (1) state-led industries will outperform private industries at least until people flows return to normal, and (2) industrial activity less exposed to falling external demand will outperform export-driven activity.
The R-CAT industries most likely to produce a recovery in near-term output are infrastructure and transportation & logistics. Infrastructure is better positioned to take up the mantle of construction activity than property given that it is less exposed to exports and receives more state support. In transportation & logistics, as activity resumes nationwide, flows of goods and people across the country will restart. Moreover, the State Council’s March 25 meeting on global supply chains encouraged logistics mergers to minimize disruptions, reinforcing prospects for state support in that industry. Downside risks to a resumption of activity in transportation & logistics are further weakness in the auto sector and a more severe impact on supply chains. Property remains the key downside risk, as investment demand collapses, prices remain under pressure, and developers grapple with severe financial stress. Outside the industrial sector, household consumption and services will likely bounce back first as they are not dependent on the movement of workers. However, this does not mean consumer goods output in the R-CAT will lead the recovery; it will likely remain weak given headwinds to manufacturing and exports.