Electric Trucks and the Future of Chinese Oil Demand
We estimate China's total electric vehicle fleet is already displacing over 1 million barrels per day in implied oil demand. That level is likely to rise by around 600,000 barrels per day over the next year.
Analysts have been discussing “peak oil” for decades. We’re hardly equipped to wade into that debate ourselves, even as Chinese demand will be a critical variable in future global oil demand. But the ongoing electrification of China’s vehicle fleet, especially in trucking, suggests long-term headwinds to diesel and gasoline demand. We estimate the total electric vehicle fleet is already displacing over 1 million barrels per day in implied oil demand—equivalent to roughly the daily oil production of Oman. That level is likely to rise by around 600,000 barrels per day over the next 12 months.
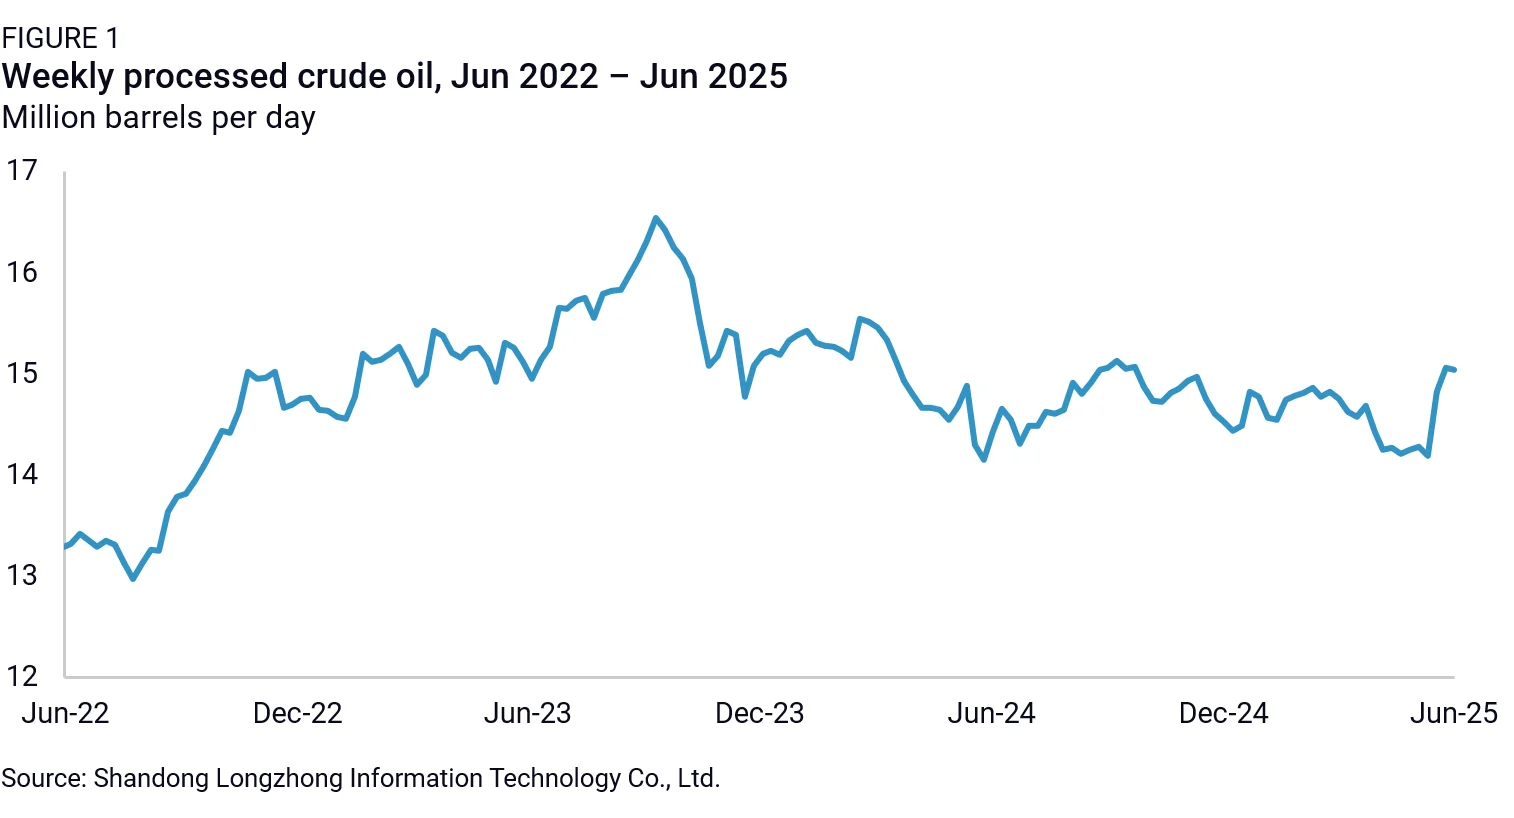
Total output from China’s extensive refining capacity is down 1% year on year in April and 0.4% so far this year. However, diesel and gasoline production are declining by even larger margins. According to its National Bureau of Statistics, China processed 14.2 million barrels of crude oil per day in April. That same month, diesel and gasoline production declined 10% year on year, and the drop continued into May before recovering in June, according to high-frequency production data. Both major and independent refiners are reducing diesel and gasoline output.
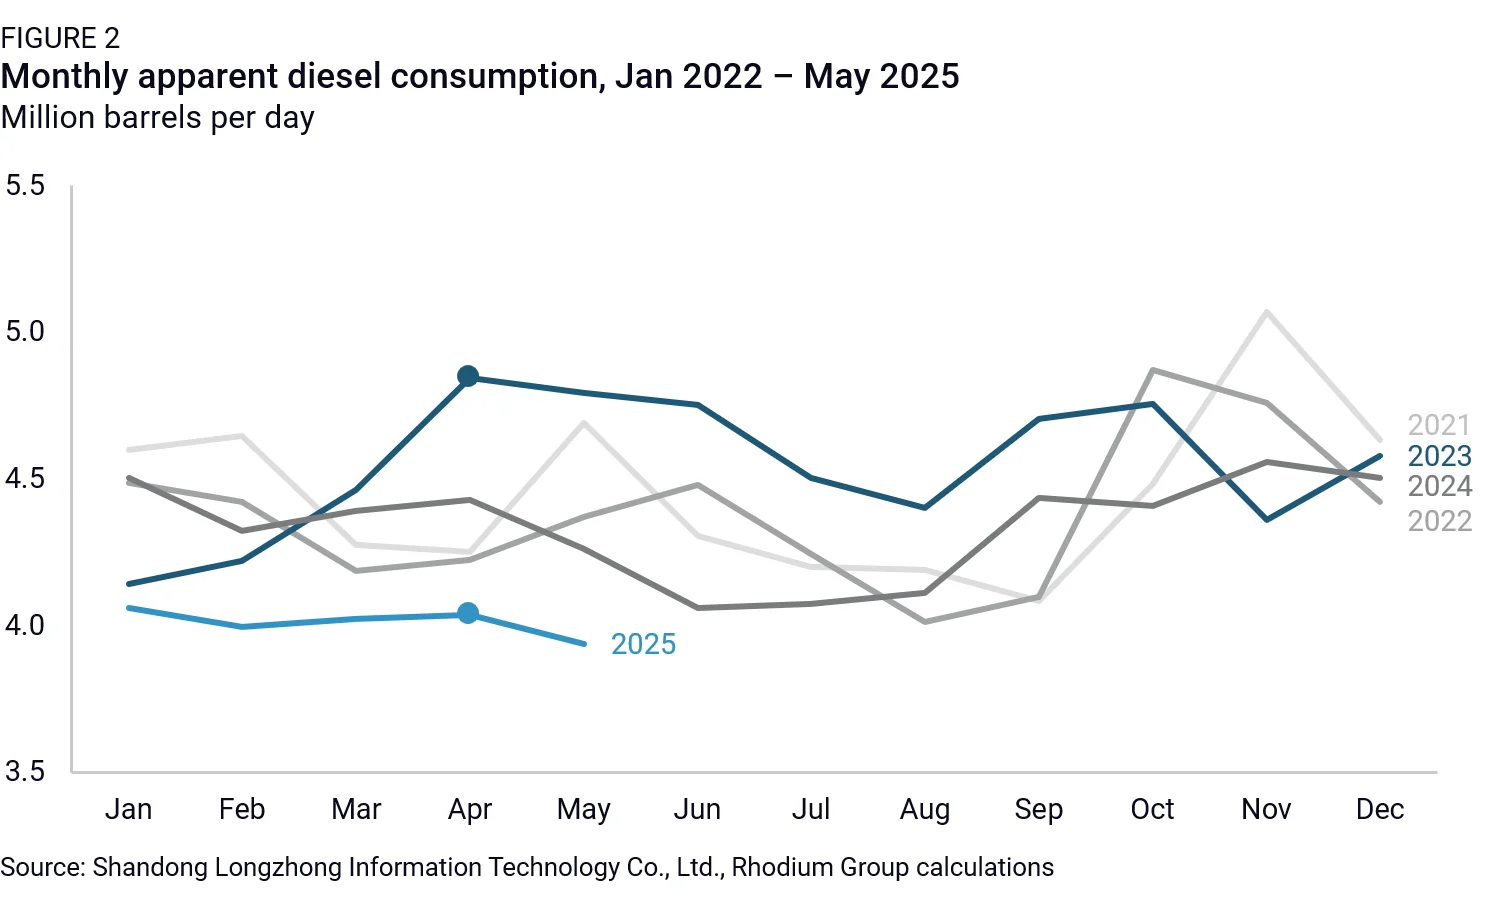
Since the peak in diesel refinery runs in April 2023, downstream diesel demand has continued to decline. Apparent diesel consumption fell from 4.7 million barrels per day in April 2023 to 4.0 million barrels per day in April 2025 (Figure 2).
There are three explanations for the decline in diesel consumption: the slowdown in real estate construction, the expansion of liquid natural gas (LNG) trucking, and the electrification of transportation. China’s structural decline in construction is well understood, as is the anticipated hit to diesel demand. But even as real estate construction activity stabilizes at lower levels and infrastructure construction picks up to some extent, diesel demand has still continued its decline. This leaves us to consider the other variables: increased LNG trucking and electrification of transport in China.
For LNG trucking, changes in demand have been driven by the relative price of LNG to diesel. In 2022, as natural gas prices rose following the Russian invasion of Ukraine, demand for LNG-fueled trucks plummeted. The Institute for Energy Economics and Financial Analysis has shown how the relative price of diesel and LNG shape which kind of vehicles are sold on a multiyear and monthly basis. As the total operating cost of electric trucks falls below diesel and LNG, electrification has accelerated.
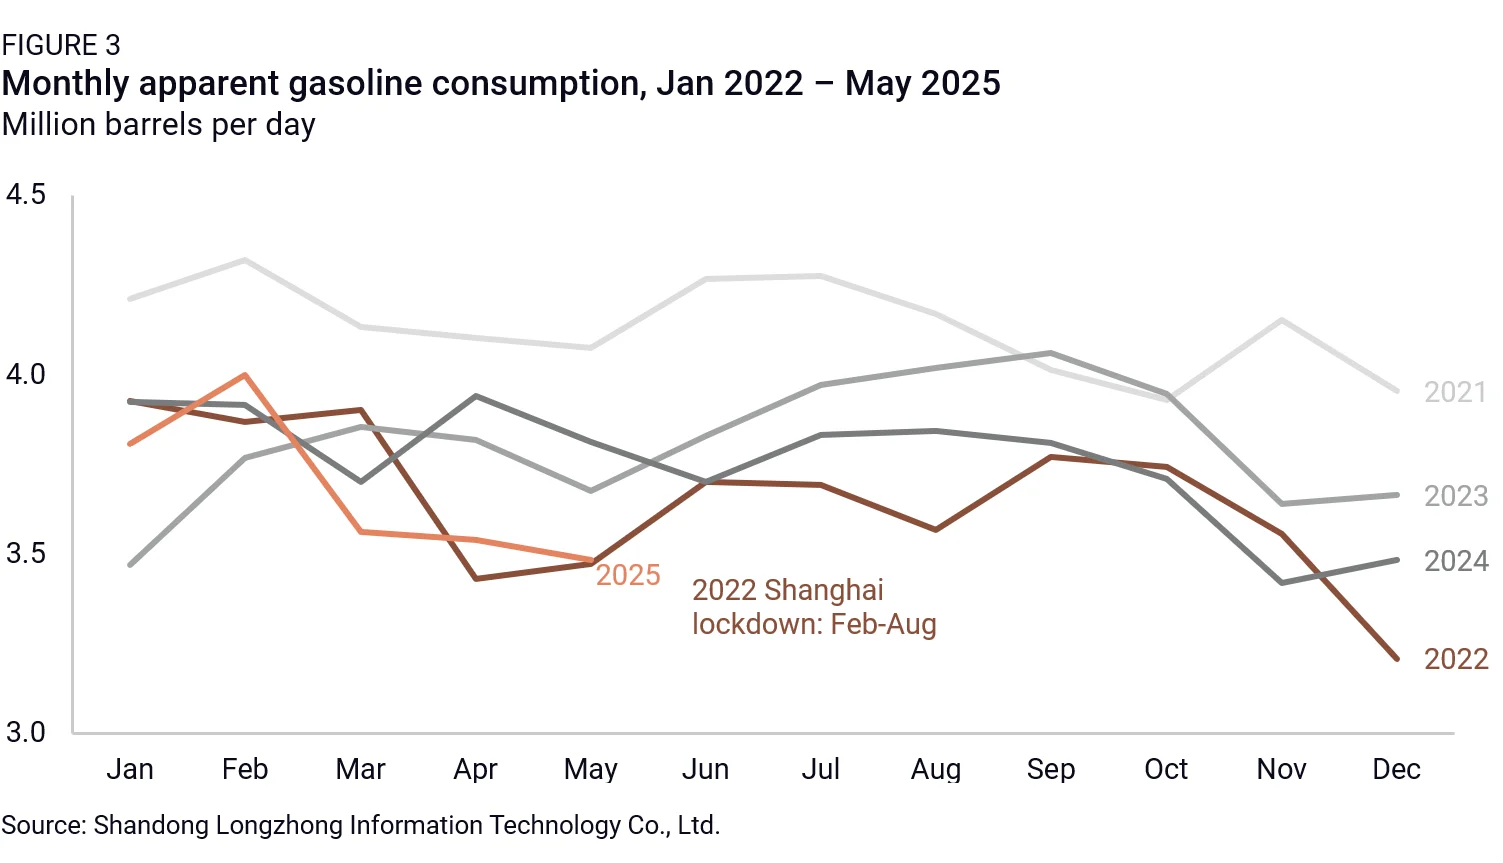
China is now pivoting away from transportation fuels to power-based energy across all modes of transport. Chinese companies are also exporting the electrification of transportation to the rest of the world, which has meaningful implications for oil markets. BYD is targeting 800,000 overseas passenger car sales this year, in a global auto market of 75 to 80 million vehicles. Domestically, China’s new energy vehicle (NEV) sales are expected to top 12 million units, which has impacted China’s gasoline demand (Figure 3). Gasoline demand in May 2025 has fallen to roughly the same level as May of 2022, when Shanghai was almost entirely locked down under zero-COVID.
Even with widespread recognition of China’s expanding NEV sales, the pace and scale of China’s electrification is likely still underappreciated, especially when it comes to trucking. A rapid expansion of China’s electric truck fleet would seriously hamper diesel demand and contribute to growing exports of refined products.
Electrification of trucking
Following in the footsteps of its passenger vehicle market, China’s heavy transport is increasingly being electrified. In 2020, 69% of light duty truck sales were diesel. By April 2025, diesel’s share of annual sales had fallen below 50%. Over the same period, annual light duty electric truck sales rose from 1% to 15%. In 2024 alone, China sold 256,000 light duty battery electric trucks, a 25% increase year on year. Light duty electric truck sales were the first to take off, but sales growth is now growing across all truck categories. Other formats, such as hybrids, plug-in hybrids and gasoline, have also reduced demand for light duty diesel trucks.
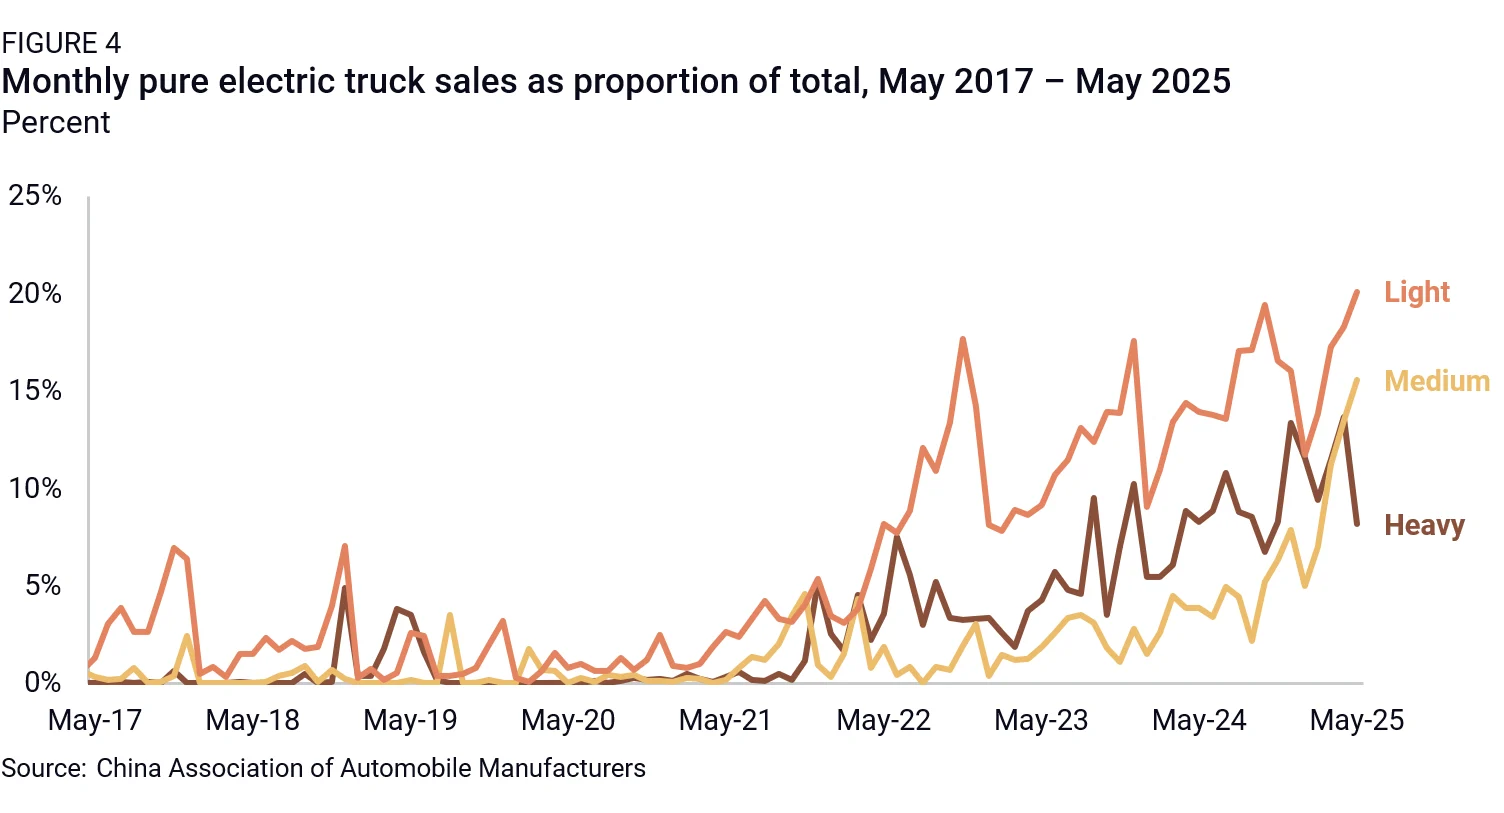
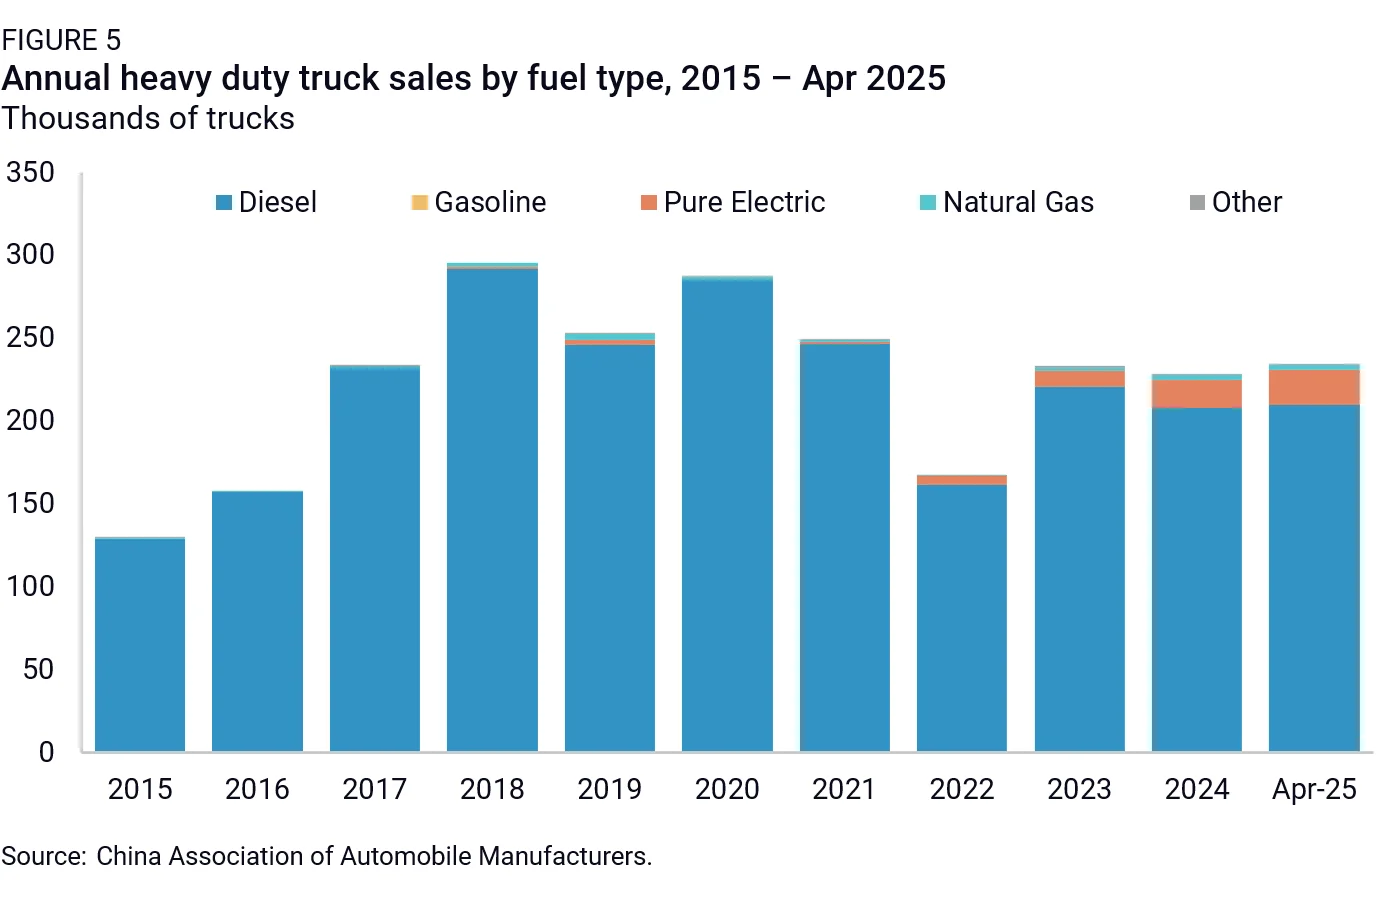
Over the last few years, a similar trend is emerging in heavy duty trucks. Unlike the light duty segment, heavy duty trucks have traditionally relied almost entirely on diesel fuel: In 2020, 99% of China’s heavy duty truck sales were diesels. But as of April 2025, 20,000 units were being sold annually, representing 8.9% of annual heavy duty truck sales. While this is a smaller share than in light trucks, it still represents sizeable progress on electrification, especially considering the logistical hurdles to running heavy duty trucks on battery power.
First, a standard EV power cable would require an impractical amount of time to charge a heavy duty truck. Low-power charging leads to longer charging times, and the more time a truck spends charging, the less time it can be on the road. Increasingly, the solution to lengthy charging times is swapping batteries rather than waiting for them to charge. According to the International Council on Clean Transportation, truck sales with battery swap capabilities increased by 94% in 2024.
Second, heavy duty trucks have heavy duty power requirements. High-power charging requires a greater draw from the grid. For grid operators, large intermittent surges in power demand create challenges to maintaining grid balance. Unlike high power charging, swap stations can assist in balancing the grid when power demand is low and contribute to the grid when power demand is high.
To put the power challenge into perspective, heavy duty truck batteries can have up to 20 times the capacity of a standard electric vehicle battery. SANY now offers a truck with a 1,165 kWh battery. For context, the average power consumption of a household in China is 8.24 kWh per day, meaning the amount of power used to charge one SANY heavy duty truck battery is roughly equal to the daily power consumption of 140 households.
There is still an important potential brake on this growth though: infrastructure buildout. Given the energy and logistics needs of electric heavy duty trucks, this transition can only expand if it’s accompanied by a network of high-power charging and battery swap stations. Some companies are already working on this new infrastructure. CATL forecasts 50% of sales of heavy duty trucks will be electric by 2028. To make that plausible, CATL is collaborating with other firms to build out a charging network that would enable their ambitious target.
Estimating demand destruction from electrification
The growing fleet of electric vehicles is increasingly impacting China’s oil demand, but it is difficult to say specifically how much: Estimating oil demand destruction from electrification is inherently a fraught exercise. Visualizing market sales trends is easy, but estimating their impact on oil markets is difficult.
Some variables in the equation are relatively simple. When buyers swap out ICE vehicles for an EV, they generally purchase a comparable vehicle. Buyers are unlikely to switch from a golf cart to a tank, or vice versa, so estimating the size and changing composition of the fleet is straightforward.
The challenge of using sales data to measure the impact on oil markets lies in not knowing the daily usage of each vehicle. The distance driven and the type of driving (highway versus urban) for each individual vehicle is different, making estimates of aggregate driving activity impossible to quantify with real specificity. However, sketching out the potential impact on oil demand using a range of these assumptions does offer insights into the growing impact of electrification on individual segments of the oil market, specifically gasoline and diesel.
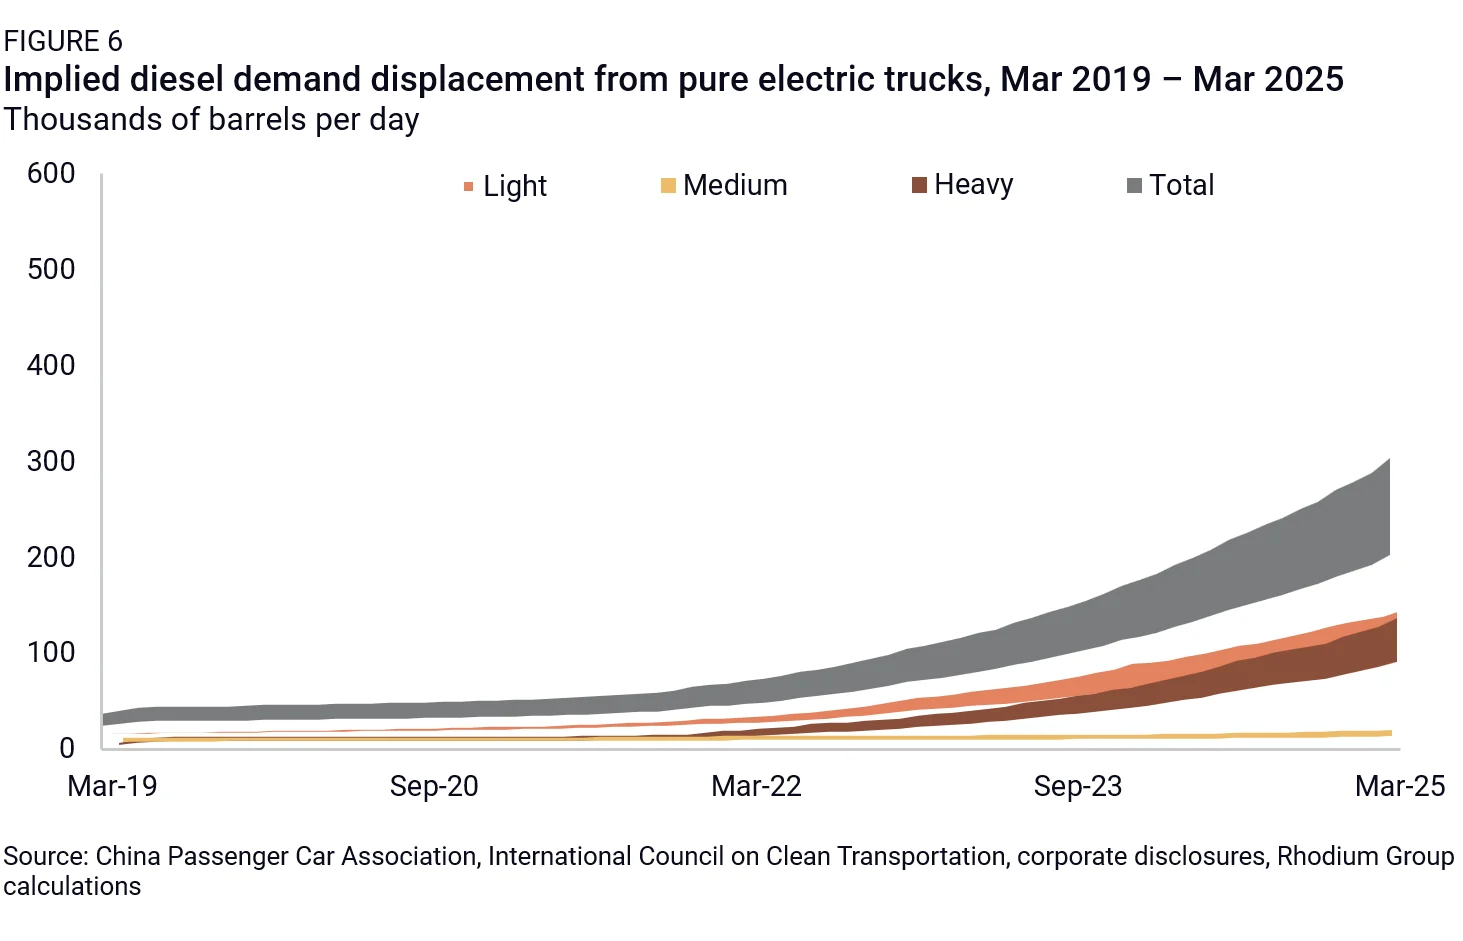
Because the trucking industry relies heavily on diesel fuel, sales data can provide baseline insights into how the rapid movement toward electrification is already impacting diesel demand. To estimate the diesel demand associated with electric trucks, there are two important assumptions: the daily distance traveled by each category of trucks and the load factor of each type of truck. Combining these two assumptions gives an estimate of the diesel equivalent demand.
- Diesel equivalent demand = cumulative truck sales x distance traveled x fuel efficiency
- Barrels per day = number of vehicles x kilometers x (kilometers/liters) x (liters/barrel)
For distance driven, light trucks generally travel shorter distances with higher fuel efficiency, and heavy trucks are used for longer distances with lower fuel efficiency. In general, heavy trucks move goods from manufacturers, ports, or depots to sites where goods are used. Light trucks are used for a variety of tasks, including all-day deliveries to daily commutes.
The Chinese government regulates the fuel efficiency of trucks, which provides a degree of confidence surrounding the fuel efficiency of each vehicle class. However, exact matches between fuel efficiency standards and China Association of Automobile Manufacturers (CAAM) data are not consistent. In principle, heavy vehicles, especially when carrying full loads, are far less fuel efficient. While there is higher confidence in the overall fuel efficiency of the category of vehicles, there is far less confidence in the daily distance driven.
- Assumption 1: Fuel efficiency: light 0.1-0.15 l/km, medium 0.15-0.25 l/km, heavy 0.25-0.4 l/km
- Assumption 2: Daily distance traveled: light 50 kilometers, medium 100 kilometers, heavy 350 kilometers
There is little evidence that the assumed distance traveled reflects actual daily usage or the environment in which they are used (urban versus highway). To account for some of this discrepancy, a range of 20% was added to both sides of the calculated light, medium, and heavy duty vehicle equivalent consumption to account for variance in the range and fuel efficiency of individual parts of the fleet. A dramatic increase in electric heavy duty truck sales would cause far more significant diesel demand destruction because moving heavy materials is far more energy intensive.
In contrast to sales data, electric vehicle power consumption offers a more direct proxy for the combined gasoline and diesel impacts because it captures actual energy usage. Another way of visualizing the impact of the shift from oil-based to power-based transport is data on aggregate electric charging activity.
The specifications of each electric vehicle contain its expected range and the size of the battery. A higher energy-density battery would hold more power, measured in kWh. The range would then be determined by other factors related to the vehicle specifications such as internal energy efficiencies, aerodynamics, and weight, as heavier vehicles are less energy efficient.
- ((Daily charging estimate * power efficiency) / fuel efficiency) / liters per barrel = total barrels
- ((Kilowatt hours * kilometers per kilowatt hour) / kilometers per liter) / liters per barrel = total barrels
The results of these calculations are summarized in Table 1 below. The central square (1.11 million barrels per day) reflects the central estimate of the range provided, based on daily charging demand in May 2025 of 383 million kWh. According to China’s National Energy Administration, last year’s charging totaled 110 billion kWh, or 301 million kWh per day. On an annualized basis, China’s vehicle charging would require over 12 nuclear power facilities operating exclusively to power the electric vehicle fleet.
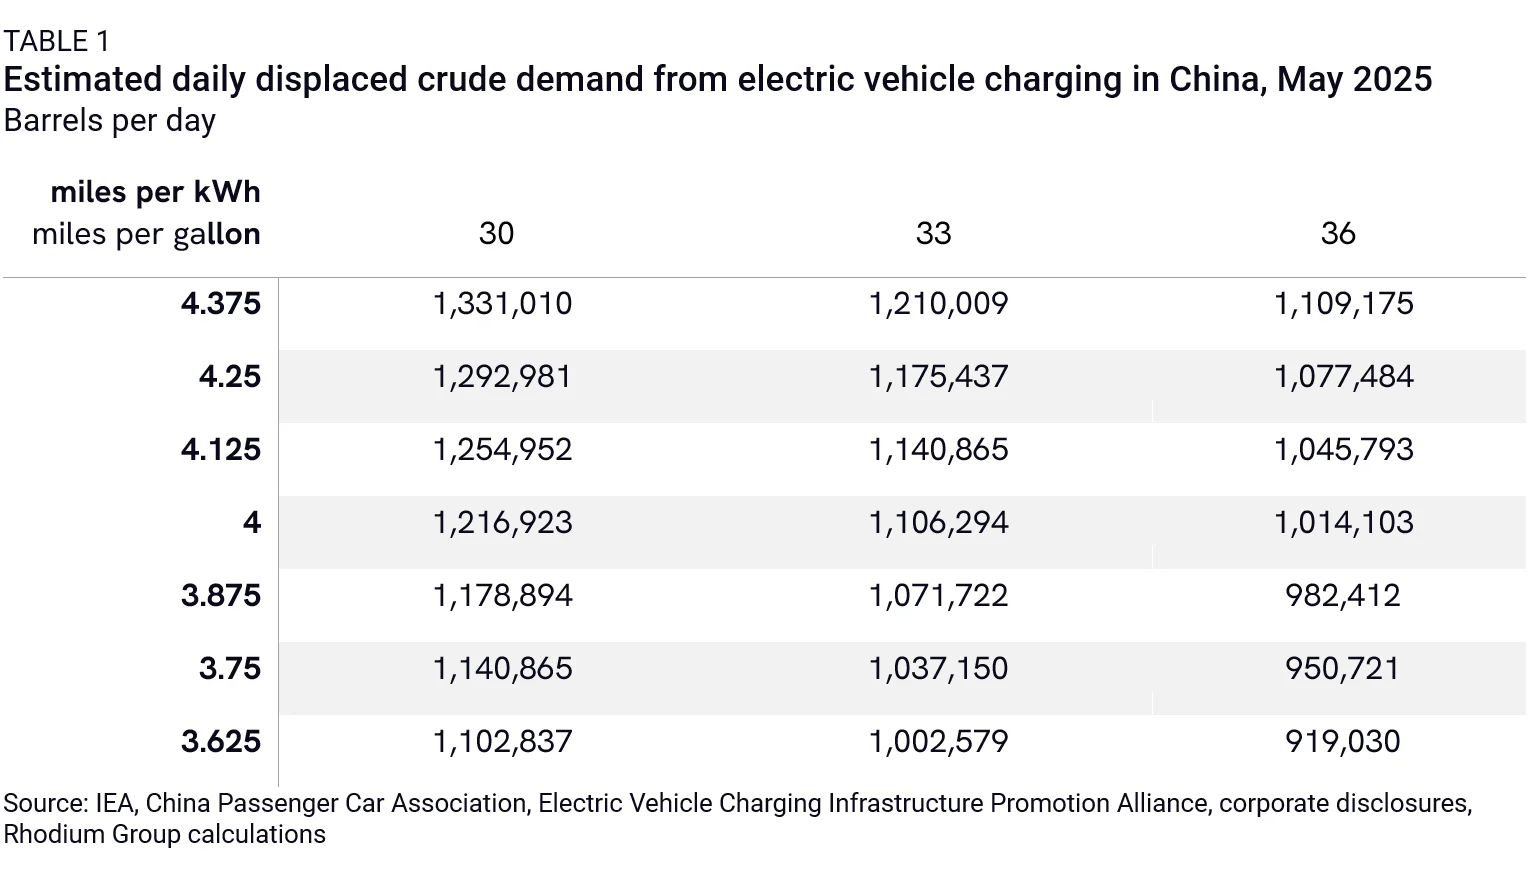
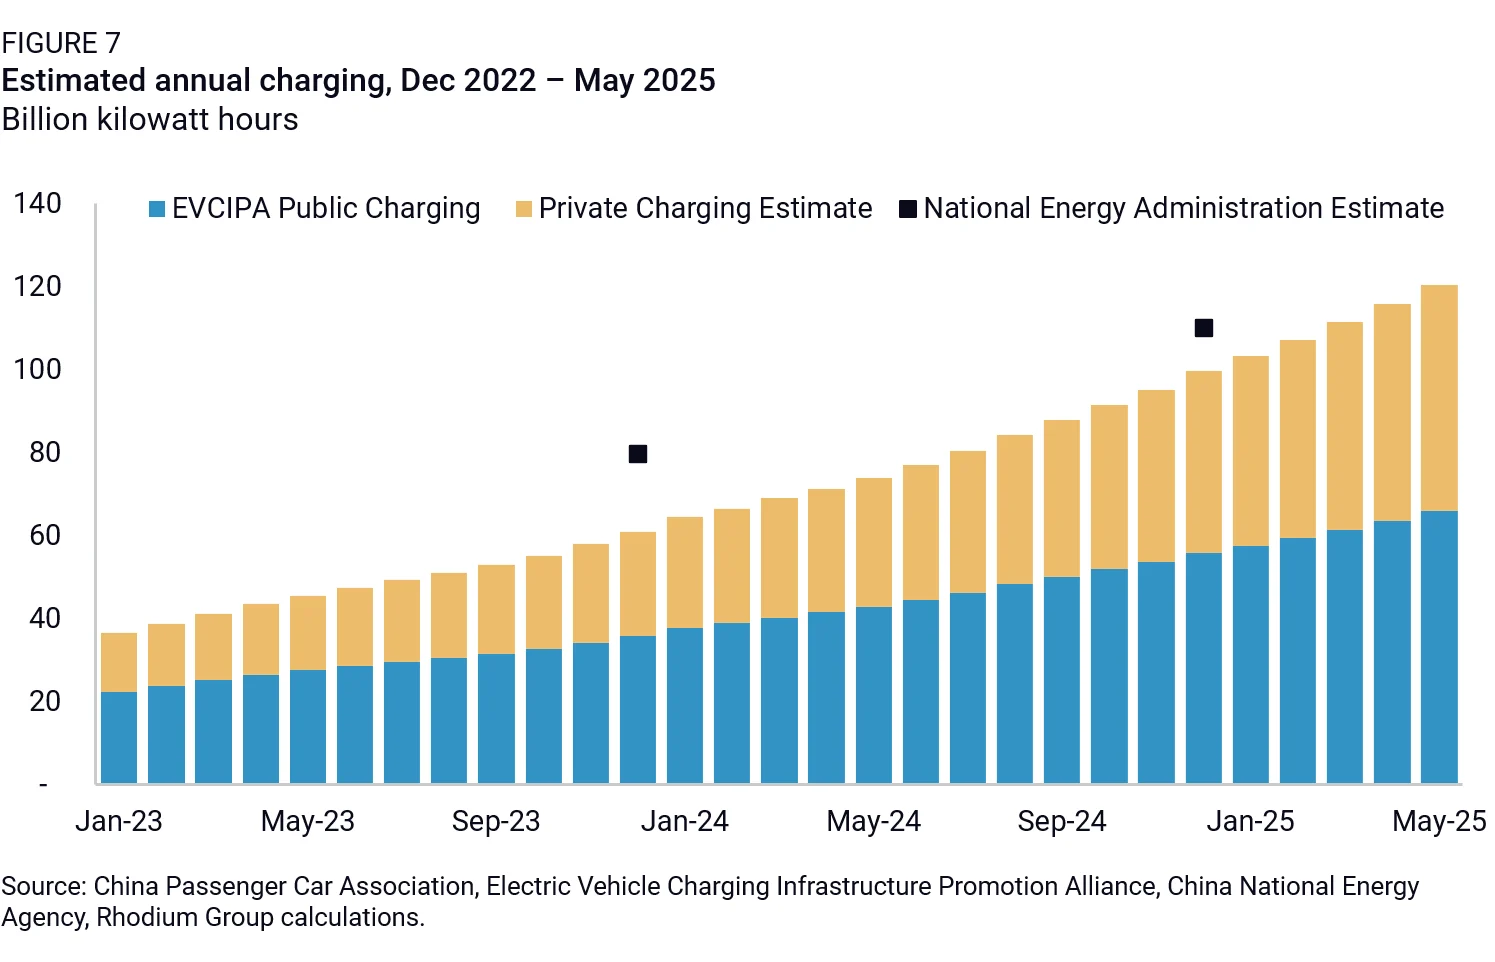
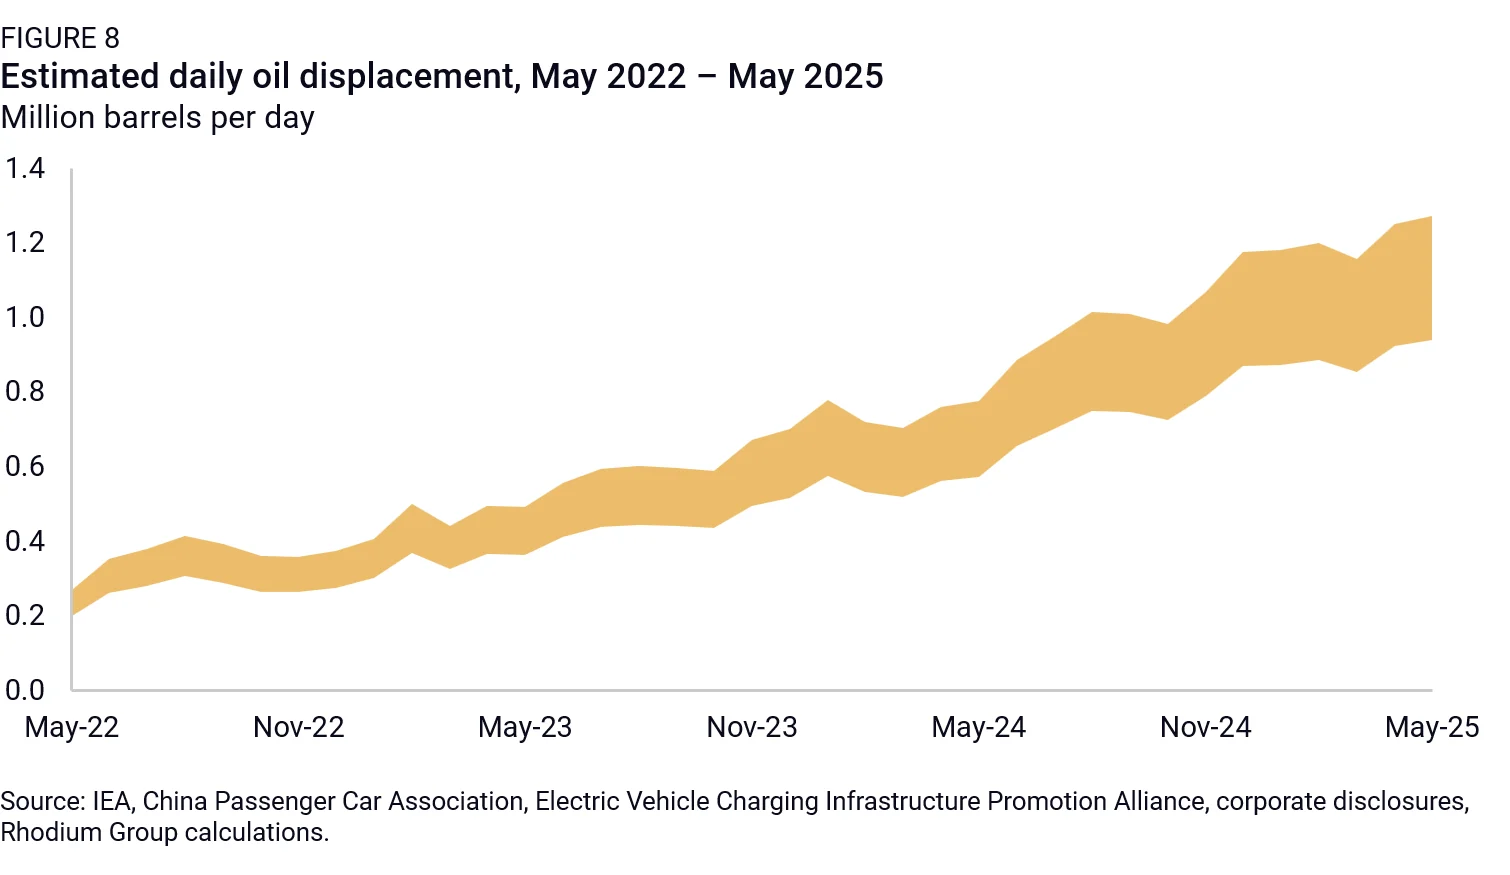
Figure 7 provides the range of expected displacement of oil demand given total charging output over the past three years. Notably, it has risen by around 431,000 barrels per day per year over the past 12 months—equivalent to 2.6% of China’s annual implied crude demand—up from 284,000 barrels per day in 2023.
The estimated oil equivalent is derived from an array of public statistics to estimate the change in total charging. The EVCIPA’s statistics only explain public charging. The China Passenger Car Association’s number of public and private charging piles are combined using a ratio of 3 to 1, where private charging piles are used at one third the frequency as public piles. The 3 to 1 ratio comes from Cui Dongshu, the Secretary-General of the China Passenger Car Association.
In May, the total estimated charging per private pile was 527 kWh per month or 17 kWh per day. This would equal between 8 and 9 charges per month for a 40-kWh vehicle. After considering the shared space in Chinese urban housing, the total number of charges per vehicle falls considerably.
The sum of private and public charging is then used as the power estimate to calculate the equivalent oil demand. Our estimate for total electric charging in 2024 was 99.6 billion kWh, close to the reported 110 billion kWh cited in state media sources. Rhodium Group’s estimate of annual total charging surpassed 110 billion kWh in March 2025.
The oil equivalent is then calculated by estimating the fuel efficiency of China’s existing fleet. Under the principle that heavier vehicles require greater energy to move, we can estimate the oil equivalent based on power generation. The base case takes 4 miles (6.44 km) per kilowatt hour and 33 miles (53 kilometers) per gallon of gasoline to estimate the demand equivalent. A range of 15% is added to both sides of the generated value to account for potential variance in monthly charging or evolving energy efficiencies in either category of vehicle.
The continued growth in charging will impact transportation fuel demand in China in the coming years, and may have global implications if China’s electric cars and trucks can find growing markets abroad (see From Fast Lane to Gridlock: Have Chinese Car Exports Peaked?). Public charging demand growth has averaged 62% year on year over the past 12 months, only slightly slower than the 63% growth over the past 24 months. If that rate of growth continues over the next year, annual displacement would rise by 670,000 barrels per day, bringing the total implied destruction of oil demand to 1.76 million barrels per day.
The likely impact will be weaker Chinese crude imports over the longer term, declining from last year’s average levels of 11.1 million barrels per day. But because long-term contracts for major refiners can be slower to adjust, independent refiners may slow imports by larger margins. Either refining output will slow or refined product exports will pick up from their current pace of 4.64 million tons per month.
In 2022, China’s refining margins were under pressure, while Singapore crack spreads—the pricing difference between a barrel of crude and the materials that are refined from it—were at multiyear highs. Chinese firms were benefiting from cheap Russian feedstock as well. China increased exports of refined products during that period at least in part because of the higher margins abroad. While spreads in China and overseas have normalized, pressure on demand in onshore markets may still incentivize exports.
The longer-term trend caused by electrification of China’s trucking fleet is likely to be continued pressure on China’s refineries to shift output away from gasoline and diesel toward feedstock for petrochemicals. Just as China is facing problems of excess capacity in several heavy industries where downstream demand from construction and infrastructure investment has slowed, the extensive buildup in refining capacity in recent years may place further downward pressure on refined product prices as domestic demand slows. The international trading activities of China’s independent refiners will be particularly important to watch in the months ahead.