Justice40 Initiative: Mapping Race and Ethnicity
Using 2019 census data, we quantify race and ethnicity demographics of the communities identified as disadvantaged in the White House Council on Environmental Quality's Climate and Economic Justice Screening Tool.
The Biden-Harris administration has vowed to make environmental justice and boosting economic development in disadvantaged communities a national priority. Last Friday, February 18th, the White House Council on Environmental Quality (CEQ) released a preliminary Climate and Economic Justice Screening Tool, identifying communities across the country which would be eligible for federal investment under President Biden’s flagship Justice40 (J40) initiative. Notably, this tool does not include race as a factor in determining eligibility for J40 funding, a decision which has been criticized by the environmental justice community and in the media.
Using 2019 census data, in this note we’ve quantified race and ethnicity demographics of the communities identified as disadvantaged in the Climate and Economic Justice Screening Tool. We find that 64% of the people in disadvantaged communities are either Hispanic/Latino, Black, or American Indian/Alaskan Native. In total, 50% of Hispanic/Latino, Black, and American Indian/Alaskan Natives in the country reside in census tracts considered disadvantaged and qualifying for J40 funding.
Mapping race and ethnicity
The Climate and Economic Justice Screening Tool (CEJST) identifies communities across the country which are marginalized, underserved, and overburdened by pollution. The purpose of this tool is to help federal agencies identify disadvantaged communities to ensure that at least 40% of the overall benefits of federal climate, clean energy, and other key programs reach these communities. However, the beta version of the tool released this month does not include data on race and ethnicity—a decision which has been criticized by many in the environmental justice community.
In order to quantify the racial and ethnic makeup of communities identified for J40 funding, we’ve combined the CEJST dataset with demographic data. CEJST identifies a census tract as “disadvantaged” if the tract is above the thresholds for certain environmental, climate, health or socioeconomic burdens. Using race and ethnicity breakdowns from the 2019 American Community Survey, we find that within the disadvantaged communities identified by CEJST, 34% of people self-identify as Hispanic/Latino, 22% as Black, and 1.5% as American Indian/Alaskan Native (Figure 1).
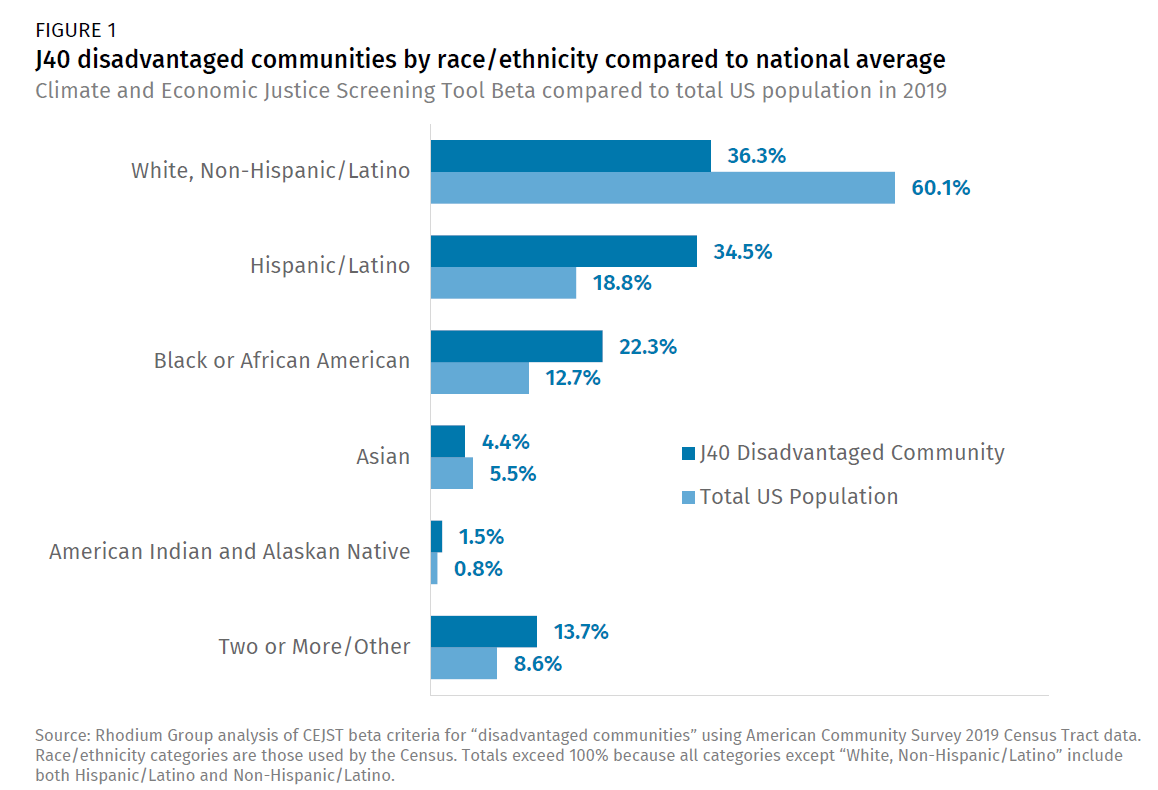
We also compared the racial makeup of communities eligible for J40 funding to the racial makeup of the US as a whole. As shown in Figure 1, people of color make up a much larger share of the population marked for J40 funding compared to their share of the overall US population, although race was not explicitly considered in the screening tool methodology.
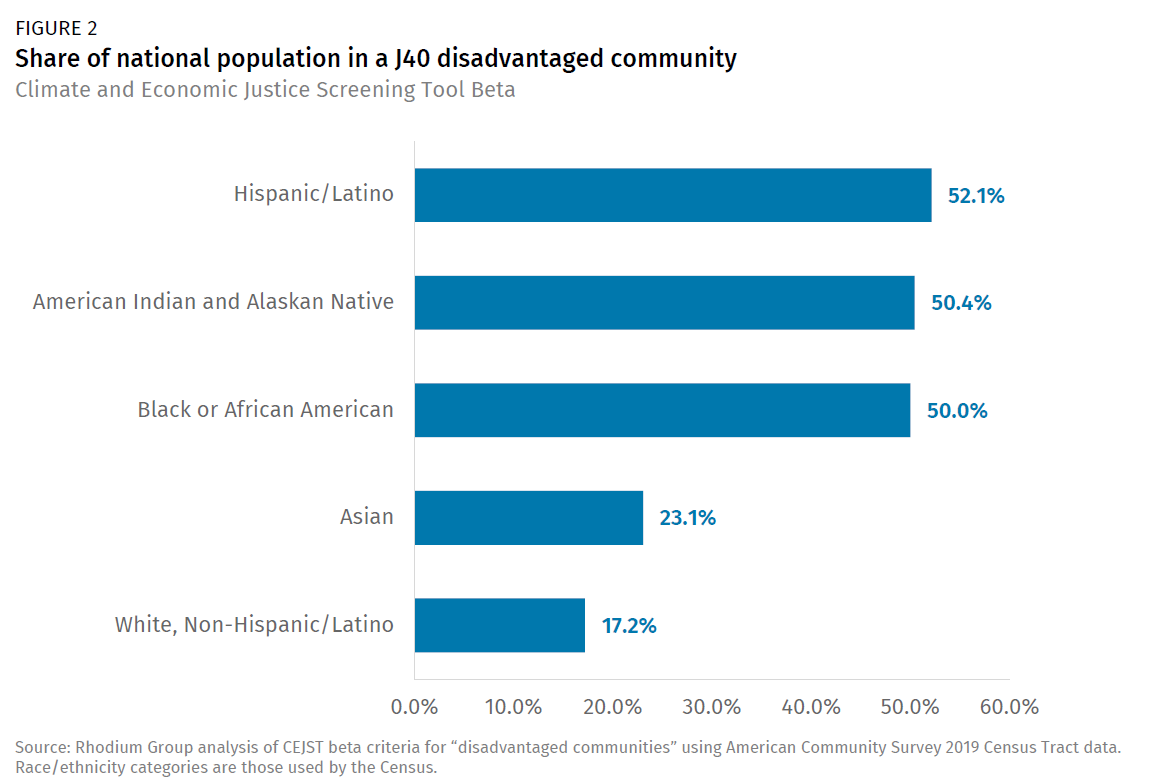
Further, we calculated the number of individuals identifying with each racial demographic group and residing in a census tract eligible for J40 funding as a percentage of the total population of that group. Over 50% of Hispanic/Latino, Black, and American Indian/Alaskan Native individuals reside in census tracts considered disadvantaged and qualifying for J40 funding (Figure 2).