Preliminary US Emissions Estimates for 2018
After three years of decline, US carbon dioxide (CO2) emissions rose sharply last year. Based on preliminary power generation, natural gas, and oil consumption data, we estimate emissions increased by 3.4% in 2018.
After three years of decline, US carbon dioxide (CO2) emissions rose sharply last year. Based on preliminary power generation, natural gas, and oil consumption data, we estimate emissions increased by 3.4% in 2018. This marks the second largest annual gain in more than two decades — surpassed only by 2010 when the economy bounced back from the Great Recession. While a record number of coal-fired power plants were retired last year, natural gas not only beat out renewables to replace most of this lost generation but also fed most of the growth in electricity demand. As a result, power sector emissions overall rose by 1.9%. The transportation sector held its title as the largest source of US emissions for the third year running, as robust growth in demand for diesel and jet fuel offset a modest decline in gasoline consumption. The buildings and industrial sectors also both posted big year-on-year emissions gains. Some of this was due to unusually cold weather at the start of the year. But it also highlights the limited progress made in developing decarbonization strategies for these sectors. The US was already off track in meeting its Paris Agreement targets. The gap is even wider headed into 2019.
Rhodium’s Final US Emissions Estimates for 2018 were published in May 2019.
A Sign Change in US Emissions Trends
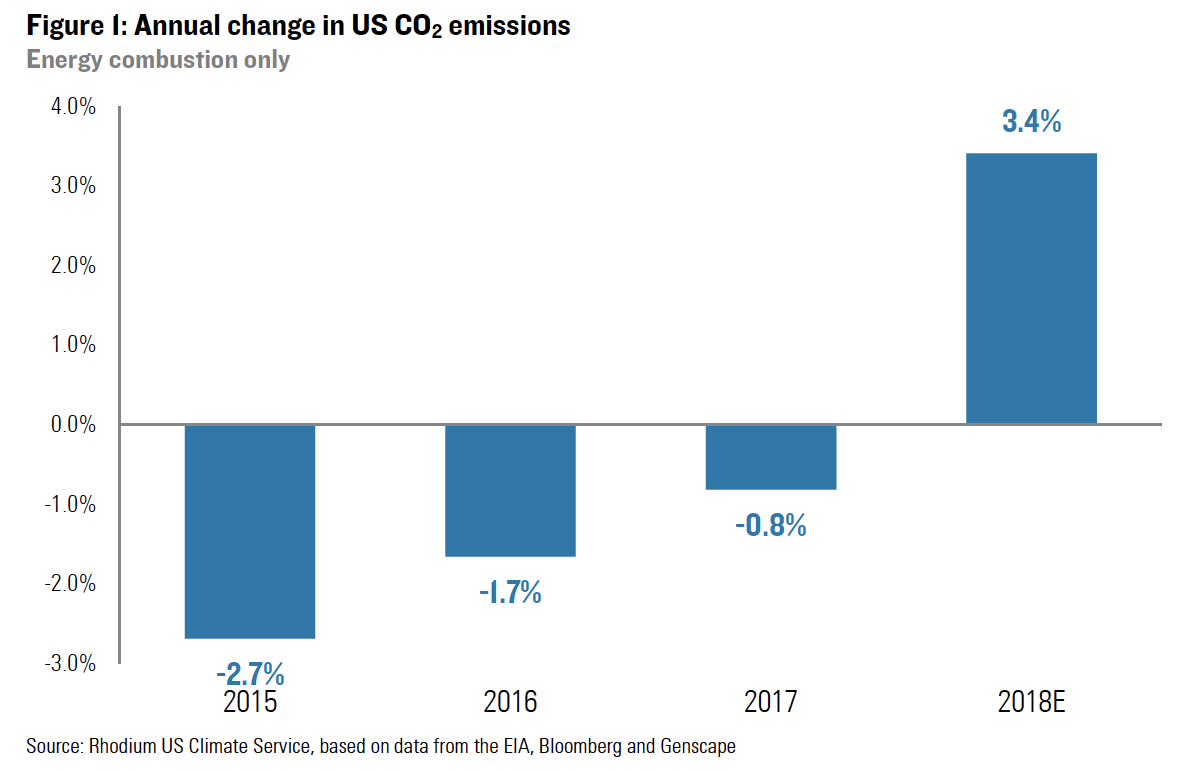
CO2 emissions from fossil fuel combustion in the US peaked in 2007 at just over 6 billion tons. Between then and the end of 2015, emissions fell by 12.1% — an average rate of 1.6% per year. The Great Recession played a significant role in that decline, but the carbon intensity of US energy supply also dropped dramatically, primarily due to a switch in power generation from coal to natural gas, wind, and solar. Since 2016, the pace of US emissions decline has slowed, from 2.7% in 2015 to 1.7% in 2016 to 0.8% in 2017 (Figure 1). As we noted this time last year and in our annual Taking Stock report, that slowdown in progress, combined with a lack of new climate policy action at the federal level, risked putting the US emissions reduction goal under the Paris Agreement — a 26-28% cut below 2005 levels by 2025 – out of reach.
Preliminary data from last year suggests that the gap the US needs to close to meet that target got bigger, not smaller. Based on emissions data from the Energy Information Administration (EIA) for the first three quarters of the year, weekly EIA petroleum supply data, plus daily power generation and natural gas data from Genscape and Bloomberg, respectively, we estimate that energy-related CO2 emissions increased by 3.4% in 2018. That’s the second largest annual gain since 1996 — surpassed only by the 3.6% increase that occurred in 2010, when emissions rebounded from a recession-driven 7.2% decline the year before.
While we don’t expect a repeat of 2018 this coming year, the data provides some important insights into the emission reduction challenges facing the US.
Record Coal Closures, But Gas Picks Up the Slack
As of the end of October, 11.2 gigawatts (GW) of coal-fired power generation capacity had closed in the US (Figure 2). With another 2.5 GW of capacity scheduled for retirement by the end of December, 2018 could end up being the biggest coal plant closure year on record.
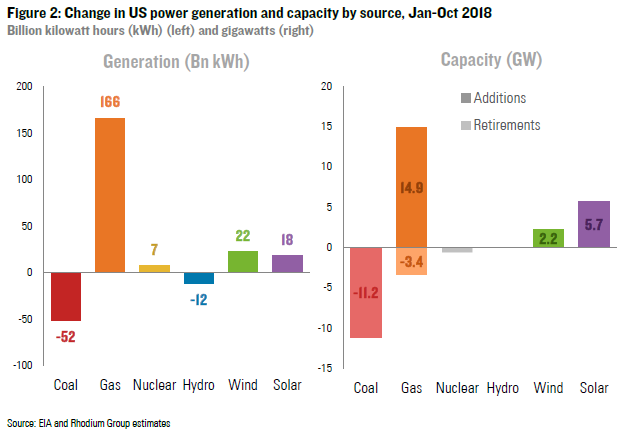
Coal-fired power generation was down sharply last year as well — more than in 2017 though not nearly as much as in 2012, 2015 and 2016. Unlike those years, where electricity demand was either flat or declining, US power consumption increased meaningfully in 2018. Natural gas not only replaced most of the lost coal generation but also fed the vast majority of the load growth last year. Between January and October, US power companies added a greater share of gas capacity than the share of retired coal capacity, and twice as much gas went online as combined wind and solar capacity additions (including distributed solar) during that period. Natural gas-fired generation increased by 166 billion kWh during the first ten months of the year. That’s three times the decline in coal generation and four times the combined growth of wind and solar.
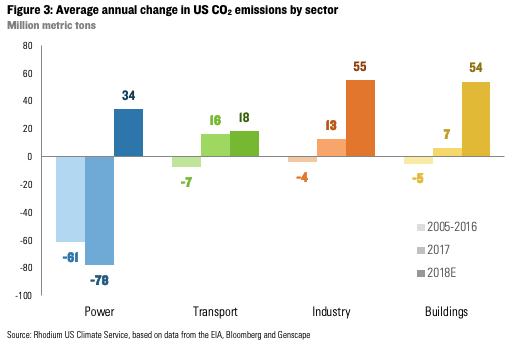
Combined with daily power generation data from Genscape for November and December, we estimate that US power sector emissions rose by 34 million metric tons in 2018, compared to a decline of 78 million metric tons in 2017 and a 61 million metric ton average annual decline between 2005 and 2016 (Figure 3). But power wasn’t the only sector where emissions increased. We estimate significant gains from transportation, industry, and buildings as well.
The More Stubborn Parts of Transportation
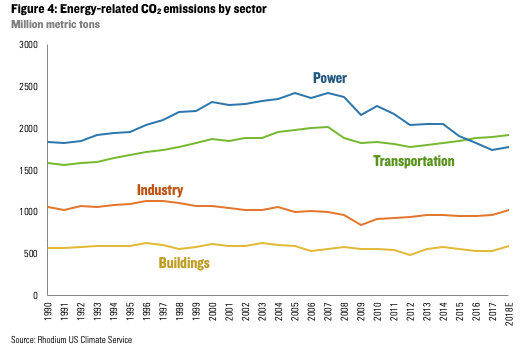
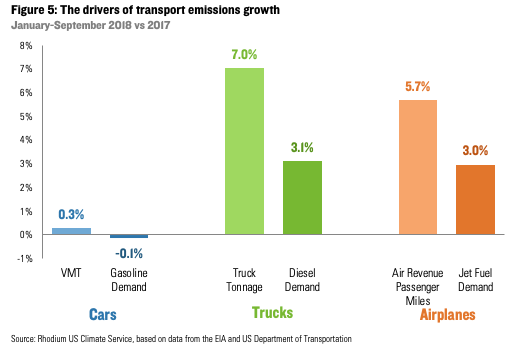
The transportation sector retained its title as the largest source of CO2 emissions in the US for the third year running (Figure 4). During the first nine months of the year, gasoline demand declined by 0.1% as modest efficiency gains offset a minor increase in vehicle miles traveled (Figure 5). But robust growth in demand for both trucking and air travel increased demand for diesel and jet fuel by 3.1% and 3.0%, respectively. This highlights the challenges in decarbonizing the transportation sector beyond light-duty vehicles. Here we see efficiency improvements and electrification beginning to make a dent, albeit not nearly a big enough one to meet medium- and long-term US emissions targets.
Preliminary fourth quarter data suggests an accelerated decline in gasoline demand, an uptick in diesel demand and moderation in jet fuel demand relative to the first three quarters of the year. All told, we estimate that transportation emissions grew by 1% in 2018, roughly the same as the 2017 growth rate.
The Forgotten Sectors
The largest emissions growth in 2018 occurred in the two sectors most often ignored in clean energy and climate policymaking: buildings and industry. We estimate that direct emissions from residential and commercial buildings (from sources such as fuel oil, diesel and natural gas combusted on site for heating and cooking) increased by 10% in 2018 to their highest level since 2004. Part of this was due to a colder winter — the number of heating degree days (HDDs) across the US increased by 15% during the first quarter of 2018 relative to the same period the year prior. But it was the relative warmth of 2017 that was the anomaly more than 2018. The first three months of 2018 were still warmer than the average during for the quarter during the 20 years prior. While there have been modest improvements in the efficiency of oil and natural gas furnaces, it is not enough to offset the emissions impact of population growth and increased demand for heating and other non-electric building energy services. Building electrification has recently gained traction as a concept within the energy and climate wonkosphere, but much less headway is being made on the ground among actual building owners and operators.
While buildings have begun to attract some creative policy thinking, the industrial sector is still almost entirely ignored. At the state and federal level few good strategies have been implemented to begin decoupling production from emissions. Our preliminary estimates suggest the industrial sector posted the largest emissions gains in 2018 at 55 million metric tons. That was due mostly to growth in industrial activity. The value of shipments across all manufacturing industries rose 7.3% during the first nine months of the year, compared to 4.5% during the same period the year before. The Federal Reserve’s industrial production index for manufacturing was up 2.5% year-on-year between January and November 2018, compared with 1.4% during the same period the year before.
Absent a significant change in policy or a major technological breakthrough we expect the industrial sector to become an increasingly large share of US greenhouse gas (GHG) emission in the years ahead (including non-CO2 gases). We expect it to overtake power as the second leading source of emissions in California by 2020 and to become the leading source of emissions in Texas by 2022.
Going into 2019, the Emissions Gap Is Wider
The estimates provided in this note are for energy-related CO2 emissions only, which account for roughly three-quarters of total GHG emissions in the US. Official EPA 2018 inventory numbers for all GHGs will not be available until 2020. But this spring we will release our annual public forecast of US GHG emissions under current federal and state policy that will incorporate these recent energy-related CO2 trends. Other factors will impact that outlook, including policy, market, economic and technology developments since our last public report. That said, the growth in energy-related CO2 emissions that occurred last year stretches the gap the US has to close to meet its Paris Agreement target even wider.
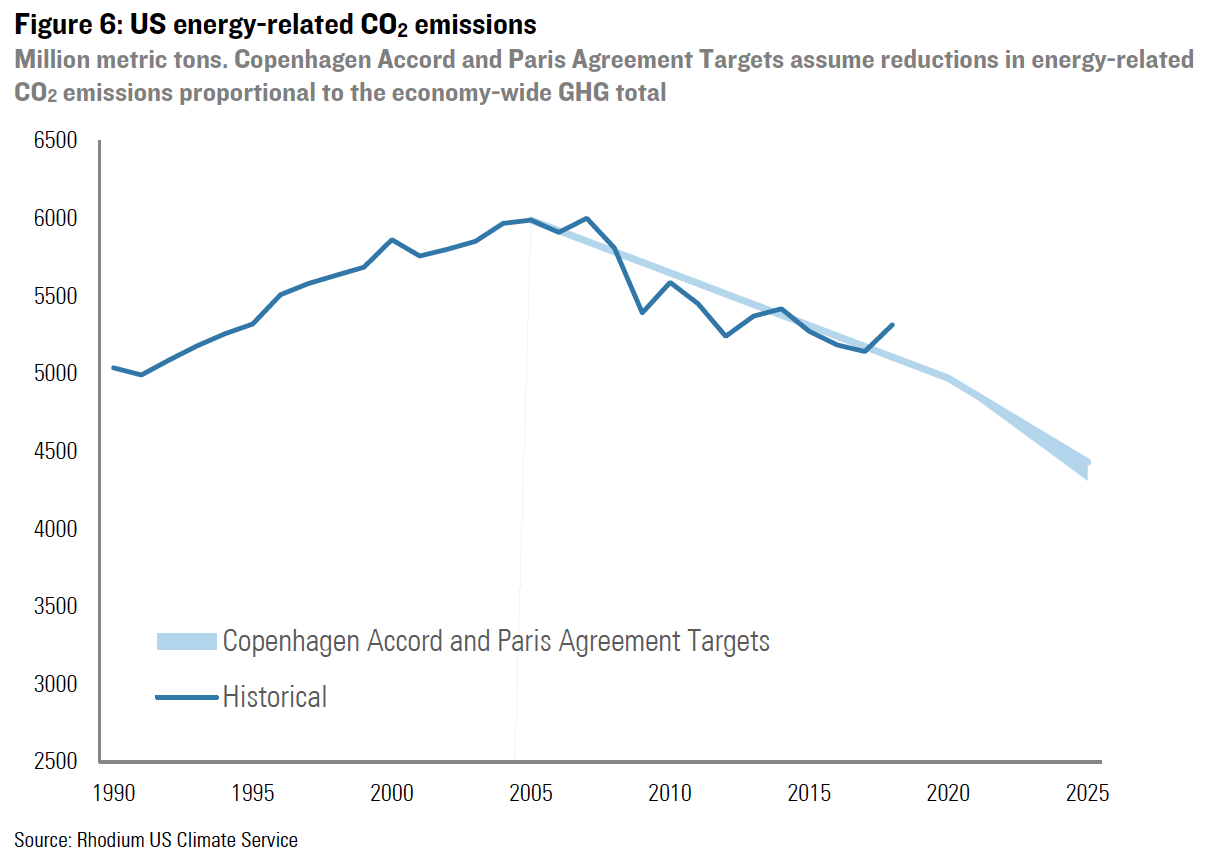
Energy-related CO2 emissions ended the year 11.2% below 2005 levels. That’s an uptick compared to 14% below 2005 at the end of 2017 (Figure 6). The US target under the Copenhagen Accord is a 17% reduction in all GHG emissions by the end of 2020. Assuming proportional reductions in other gasses, the US will need to reduce energy-related CO2 emissions by 3.3% per year, on average, in 2019 and 2020 to meet the Copenhagen target. That is significantly faster than the 1.2% average annual reduction between 2005 and 2017. In reality, the pace of energy CO2 emission reductions will likely need to be even faster as the decline in non-CO2 gasses has underperformed that of energy-related CO2 in recent years.
To meet the Paris Agreement target of a 26-28% reduction from 2005 levels by 2025, the US will need to reduce energy-related CO2 emissions by 2.6% on average over the next seven years — and faster if declines in other gasses do not keep pace. That’s more than twice the pace the US achieved between 2005 and 2017 and significantly faster than any seven-year average in US history. It is certainly feasible, but will likely require a fairly significant change in policy in the very near future and/or extremely favorable market and technological conditions. We will explore both in our updated US emissions forecasts in late spring/early summer.
How’s the US Doing on Climate Goals? Read Our 2019 Taking Stock Report