Taking Stock 2019
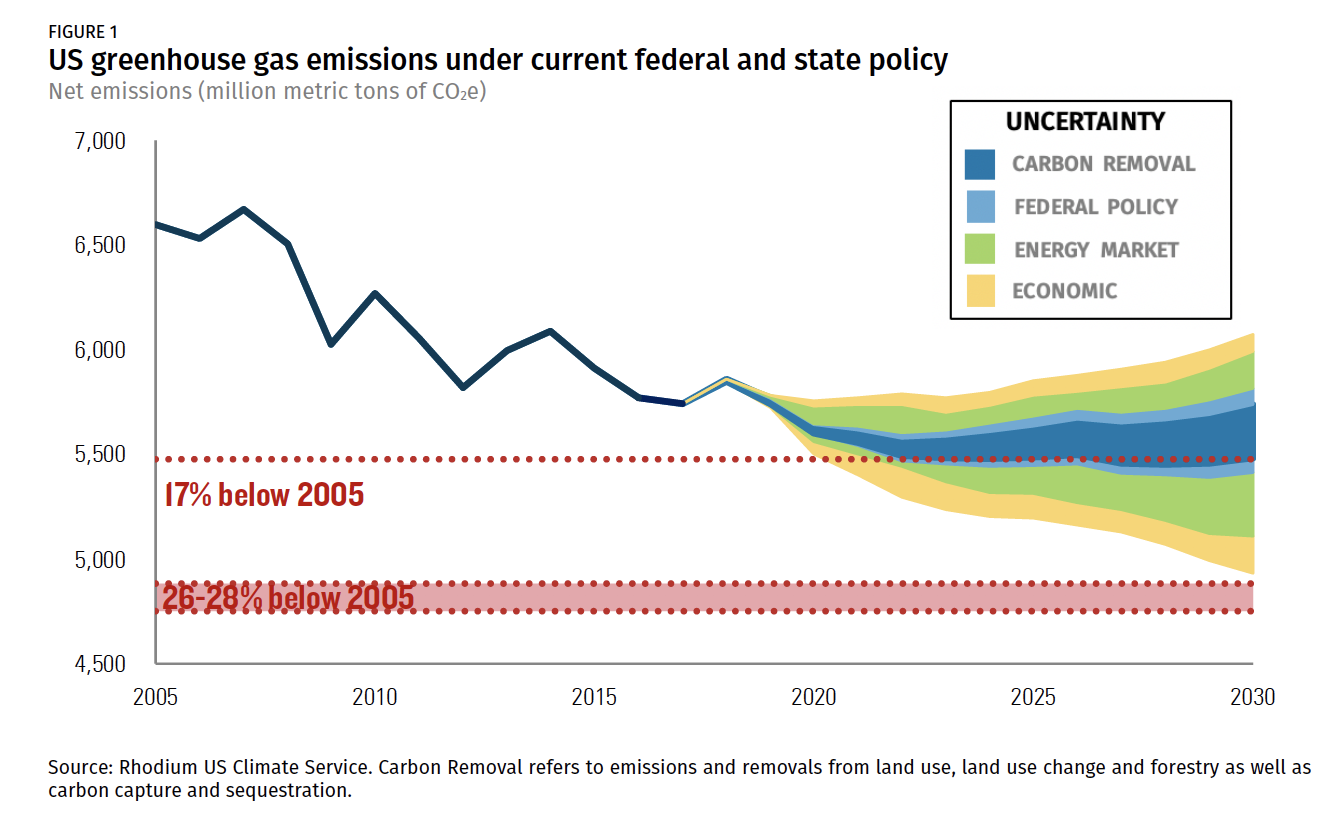
Given the current state and federal policy landscape and range of potential energy market dynamics on the horizon, we find that the US is on track to reduce emissions 13% to 16% below 2005 levels by 2020.
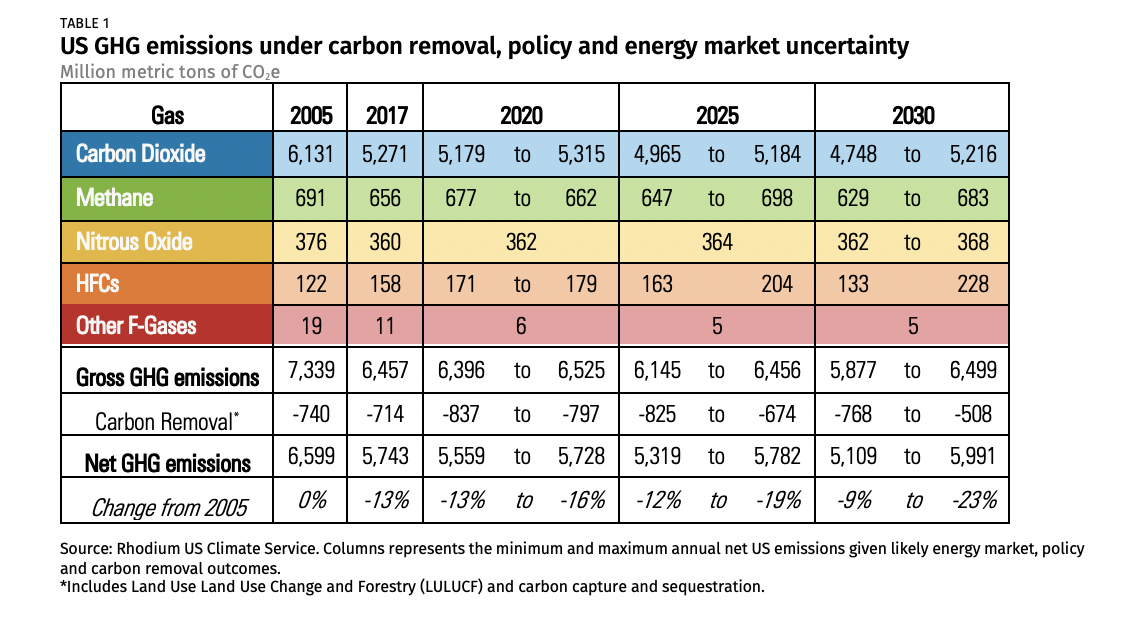
For the past five years, Rhodium has provided an independent annual assessment of US greenhouse gas (GHG) emissions and progress towards achieving the country’s climate goals. Given the current state and federal policy landscape and range of potential energy market dynamics on the horizon, we find that the US is on track to reduce emissions 13% to 16% below 2005 levels by 2020. This puts the US potentially out of reach of its Copenhagen Accord target of a 17% reduction by 2020, with little room for policy to affect outcomes in the next 18 months. Looking ahead to 2025, the US is on track to achieve reductions anywhere from 12% to 19% below 2005 levels absent major policy changes—a far cry from its Paris Agreement pledge to reduce emissions 26% to 28%. Taking into account additional uncertainty in the direction and pace of US economic growth, we project 2025 emission reductions as small as 11% below 2005 levels, or as great as 21%.
What’s Changed Since Last Year
In this year’s edition of Taking Stock, we unpack the trends driving US emissions in the coming decade by providing a more nuanced look at how changing energy market dynamics affect various sectors of the US. On the policy front, we assess how the Trump administration’s ongoing push to roll back federal regulations that limit GHG emissions is shaping the trajectory. We account for potential U.S. participation in the Kigali Amendment to the Montreal Protocol to phasedown hydrofluorocarbons (HFCs) and Obama-era methane standards for oil and gas production, both in limbo.
Despite the lack of forward momentum at the federal level, the last year has brought a wide range of new mid- and long-term climate goals from states, companies, and others looking to fill the gap. However, much of the work to implement these ambitions remains to be done. In order to assess progress, we incorporate only those state-level policies that contain clear, feasible milestones and real compliance obligations.
Unpacking the Biggest Trends
Power sector emissions continue to decline through the 2020s, as coal is pushed out by increasingly competitive natural gas and renewables, but natural gas over time becomes a threat to zero-emitting power sources.
Low natural gas prices and falling renewable costs have the potential to shrink the coal fleet by almost a third of its current size by 2025. Renewable deployment continues apace thanks primarily to steadily declining costs, along with tax credit support and state renewable policies through 2025. Just how fast will depend largely on renewables’ relative competitiveness with natural gas. In a best-case scenario for emissions, high natural gas prices—around $4 per one million British Thermal Units (MmBTU)—combined with steep declines in the cost of renewables would, by 2025, result in 50% more wind capacity than today and more than four times current solar deployment. If natural gas prices persist near current levels ($2.65 per MMBtu or lower) through the mid-2020s, they pose a serious threat to climate goals over time. With cheap natural gas and only moderate reductions in renewable costs, solar capacity grows more slowly, and wind deployment rises only 20% though 2025 from today’s levels. Sustained low natural gas prices could also spell trouble for the country’s nuclear fleet absent significant changes in federal or state policy. In the worst-case scenario for nuclear power, 45% of the current fleet could retire by 2025. This represents nearly 12% of the zero-carbon capacity on the nation’s power grid today.
Transportation emissions decline modestly through 2025—even if the cost of owning an electric vehicle falls dramatically—as consumers continue to favor larger, higher-emitting vehicles.
Due to sustained low oil prices over the last half decade, Americans are driving more and buying larger vehicles. This trend is expected to continue through the next decade if oil prices remain below $55 per barrel. Cheaper and more plentiful electric vehicle (EV) options could counterbalance this effect, but the impact is minor. Even with the most optimistic estimates of EV battery cost declines, in 2025 these vehicles would represent just 16% of all light-duty sales and transportation emissions would fall by only 12% below 2005 levels. More moderate EV cost reductions lead to EVs capturing only 6% of total sales in 2025, putting transportation emission reductions at the low end of our potential range at just 8% below 2005 levels.
Cheap, plentiful natural gas may also be a liability for emissions from industry and buildings.
Although industrial emissions have fallen since 2005, that trend will reverse as low-cost natural gas bolsters more activity in energy-intensive industries, including steel, cement, chemicals, and refineries. Industrial emissions climb highest when natural gas is cheap, rising 7% from 2018 levels by 2025. Conversely, if natural gas gets more expensive, industrial emissions grow by only 1% in the same timeframe. If the natural gas boom in the US continues, and the Trump administration is successful in walking back Obama-era regulation, the oil and gas sector could see a nearly 30% increase in methane emissions from today’s levels by 2025.
In 2025, emissions in the buildings sector fall 3% to 8% from 2005 levels, depending primarily on natural gas and oil prices. Emission reductions level off by the mid-2020s.
There is a narrow and shrinking window for state and federal policy to play a role by 2025.
Since our last Taking Stock report, the Trump administration has continued to move forward with its agenda to dismantle Obama-era climate regulations, with federal Corporate Average Fuel Economy (CAFE) standards the latest to succumb. Two major decisions are still in limbo involving non-carbon dioxide (CO2) gases: Obama-era efforts to reduce methane from oil and gas production; and plans to decrease hydrofluorocarbon (HFCs) emissions through both federal standards and participation in the Kigali Amendment. If these remaining policies are not implemented, overall US emissions in 2025 could be 58-78 million metric tons (MMt) of carbon dioxide equivalent (CO2e) higher than today, or about 1.0% to 1.4% of net GHG emissions in that year. This uptick would take place despite current efforts by states to fill the gap.
The 2018 elections swept climate-progressive leaders into a handful of state legislatures and governors’ offices across the US. Many of these elected officials have announced plans to dramatically expand clean energy, adopted new climate policies, and established long-term emission reduction goals. These developments could make a significant dent in emissions in the future. However, the majority of these announcements will not meaningfully impact emissions before 2025, thus doing little to help the US meet its 2020 and 2025 climate commitments.
Explore the Data
Rhodium’s annual Taking Stock report provides objective, up-to-date analysis of legislative and regulatory action at the US federal and state level in a framework consistent with accounting methodologies of the US government and United Nations Framework Convention on Climate Change. This report offers an overview of our national results for 2019. For more granular detail on our results, Rhodium’s US Climate Service provides direct access to all emissions data from Taking Stock as well as 50-state emissions and energy data (broken down by sector and by gas). US Climate Service subscriptions include interactive data visualizations of a wider range of energy market and policy scenarios, as well as research coverage of key developments in US energy and climate policy.
For more information about our approach and methods, see the Taking Stock 2019 Technical Appendix.