From a decarbonization perspective, two of the most important components of the Inflation Reduction Act (IRA) are some of the most familiar: the investment (ITC) and production tax credits (PTC) for clean electricity. Under the measures included in the IRA, the electric power sector delivers the largest share of emission reductions of all major-emitting sectors, thanks largely to the long-term technology-neutral ITC (48E) and PTC (45Y) available to any new or expanded eligible power plant until at least 2032 and probably longer. Though the credits carry a familiar name, their approach is brand new. They replace and harmonize the technology-specific ITC and PTC that have been in the tax code as far back as the early 1990s and are due to take effect on January 1, 2025. The Internal Revenue Service (IRS) is due to release initial guidance on what kinds of generators can qualify for these new credits.
In this note, we quantify the magnitude of the impact of these credits compared to a scenario where these credits don’t exist, in order to pinpoint just how big the stakes are for the IRS in getting the new guidance out the door. We find that 48E and 45Y combined deliver 300-400 million tons of GHG reductions compared to no tax credits in 2035, 29-46% lower than a scenario without the tax credits. There’s up to nearly 650 gigawatts (GW) more clean electricity capacity online in 2035. Air pollutants drop by at least 20%, and consumers across the economy will save a total of $16-$34 billion in annual electric costs in 2035. From a decarbonization perspective, tax guidance on 45Y and 48E may be the single most important IRA implementation action the IRS will take.
From short-term tech-specific to long-term tech-neutral tax credits
Before the IRA passed in 2022, the tax code contained a PTC, adopted in the early 1990s, that generally supported wind generation and an ITC, in place since the mid-2000s, that generally supported solar PV. In both cases, specific technologies are named in the tax code to define eligibility. This approach worked well when there were only a few commercially available clean electricity technologies (like wind and solar), and others, like new nuclear plants, had their own tax credit. These tax credits have been one of the main drivers behind the level of wind and solar installed today. The main issue before the IRA was that Congress would perennially renew the credits, usually on a short-term basis, sending uncertain signals to the market. Even worse, Congress would occasionally let the tax credits expire and then retroactively reinstate them, making it even more difficult for developers to plan.
The old framework began to show its age as new and innovative clean technologies, like battery storage and small modular nuclear reactors, entered the scene. By this point, the new nuclear tax credit had few takers, and there was recognition that the tax code could be revised to let any zero-emitting technology qualify without the need for a new act of Congress every time a new technology emerged. These ideas gained traction during the drawn-out congressional deliberations that eventually produced the IRA.
As part of those negotiations, two new tax credits (the 48E ITC and 45Y PTC) were created that allow, starting in 2025, any electric power generator to qualify so long as it does not emit GHG emissions in the production of electricity. Technologies that rely on combustion or gasification, such as bioenergy with carbon capture and storage (BECCS), must demonstrate that their net GHG emissions are at or below zero on a lifecycle basis to be eligible.
Beyond making the PTC and ITC open to all clean generators, including nuclear, geothermal, BECCS, and other emerging technologies, Congress extended the timelines for eligibility to provide long-term certainty for clean electricity developers. 48E and 45Y are available to any eligible project that commences construction before 2033 or the year that US electric power CO2 emissions fall below 25% of 2022 levels, whichever is later. Our latest projections do not find emissions falling below that phaseout threshold at least through 2035, though new EPA power plant rules or other changes in market factors could change that. Bonus add-ons to the credit value for using domestic content or siting in an energy community, which were established by the IRA for the legacy ITC and PTC, also carry over to the new credits. However, before developers can claim the credits, the IRS needs to issue guidance to set the rules of the road.
A large driver of electric power decarbonization
Our initial analysis of the IRA found that 65-75% of all the emission reductions from the legislation occur in the electric power sector. This is due to a portfolio of enhanced and new tax credits and other programs such as 45Q for carbon capture, 45U to retain existing nuclear plants, the USDA rural electric utility clean energy programs, direct pay for municipal and non-profit organizations, credit transferability for the private sector as well as 45Y and 48E and their predecessor credits. With the electric power sector contributing so much to the total decarbonization impact of the IRA, the 45Y and 48E credits are important components of the package.
To understand just how important, we use RHG-NEMS, our integrated energy system model, to consider a scenario where all the components of the IRA and all other policies on the books as of our Taking Stock 2023 report are in place except 45Y and 48E. We don’t do this to postulate that the IRS will not follow through on implementation or that Congress will repeal the credits in the near future. Instead, we do this to isolate the impact of 45Y and 48E compared to a world without the credits to estimate the general magnitude of impacts on the US energy system from the two policies.
Other factors that we don’t consider here can influence the magnitude of our estimates. As we discuss below, RHG-NEMS is limited in its ability to represent some headwinds facing clean energy deployment like permitting and siting constraints and supply chain limitations. The power sector will also be affected by EPA’s recently finalized standards for existing coal plants and new natural gas plants, which will also put downward pressure on electric power sector emissions. However, we previously saw that the IRA displaces existing natural gas generation more than existing coal and new natural gas plants. There has also been increased attention paid to potential increases in electricity demand from data centers and manufacturing, which may be regionally significant. We intend to analyze these dynamics and incorporate them into the next version of our Taking Stock report, our annually updated outlook for US emissions under current policy, to be published later this summer.
45Y and 48E pick up the pace of decarbonization
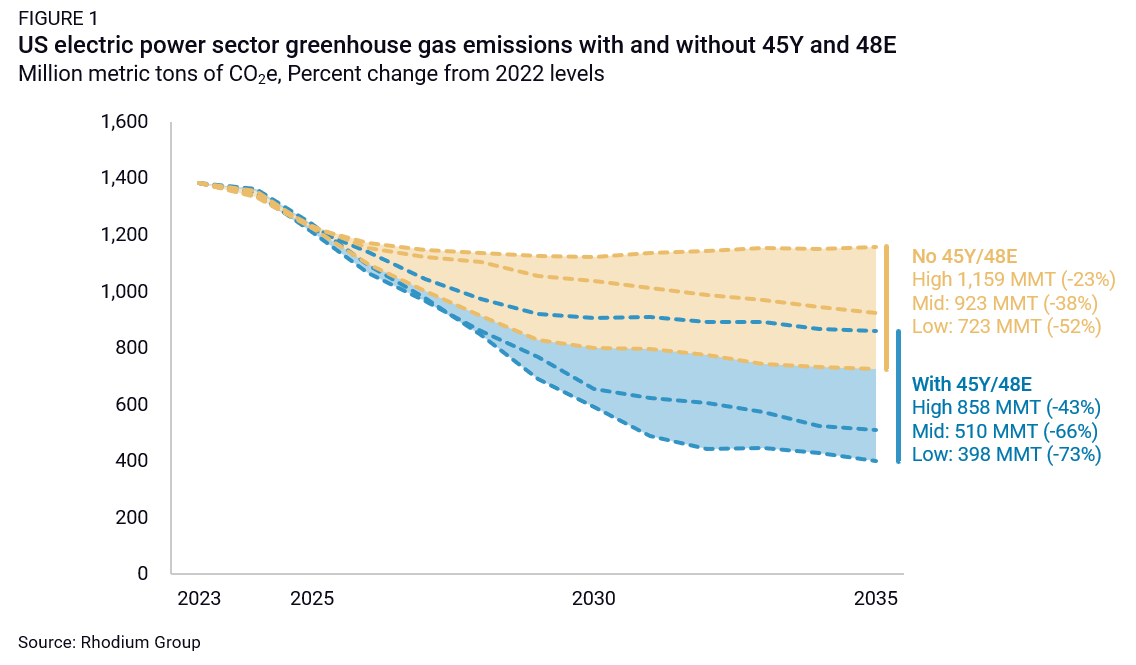
We consider the impacts of the two tax credits across a range of scenarios that consider uncertainty around the pace of economic growth, the cost of clean technologies, and fossil fuel prices. These are the same emissions scenarios we used in Taking Stock 2023, and more detail on these assumptions is available in that report. We find that without the tax credits, electric power sector emissions would be on track for 723 to 1,159 million metric tons of CO2 emissions in 2035 or a 23-52% reduction from 2022 levels (the benchmark year for tax credit phase-out) (Figure 1). With the tax credit, emissions drop to 398 to 858 million metric tons in 2035, or 43-73% below 2022 levels.
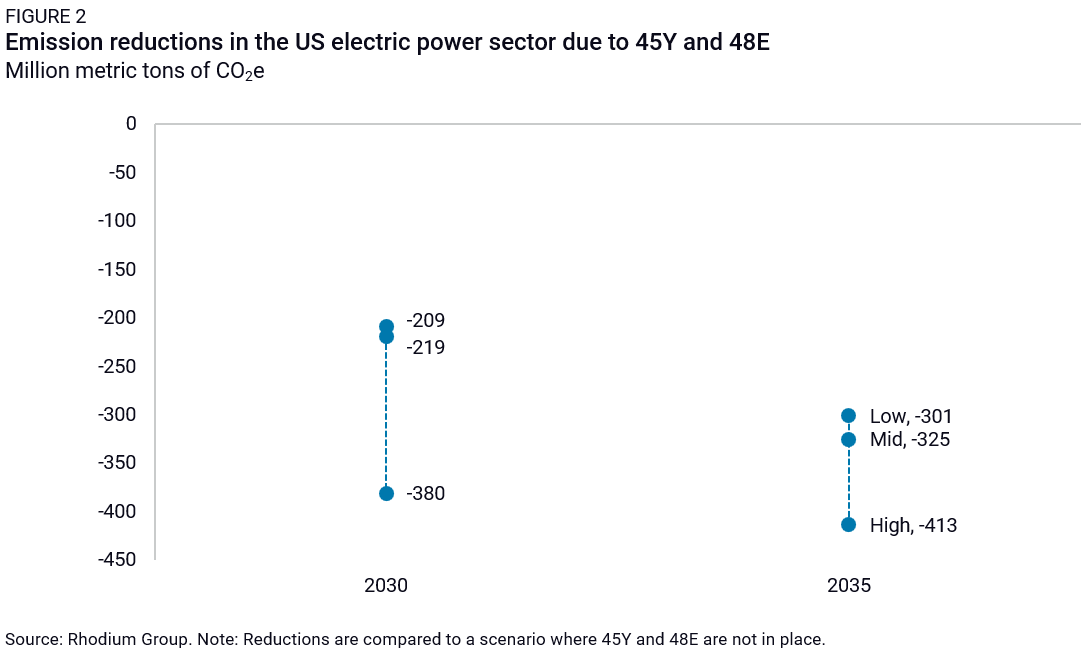
In both 2030 and 2035, 45Y and 48E lead to electric power sector emissions that are at least 200 million tons and 300 million metric tons respectively lower than without the tax credits (Figure 2). That’s a bigger reduction in 2035 than EPA estimated for its methane standards on oil and gas, its standards on light-duty vehicles, or its emissions standards on existing coal and new natural gas plants by at least 100 million metric tons.
A surge of new clean generation
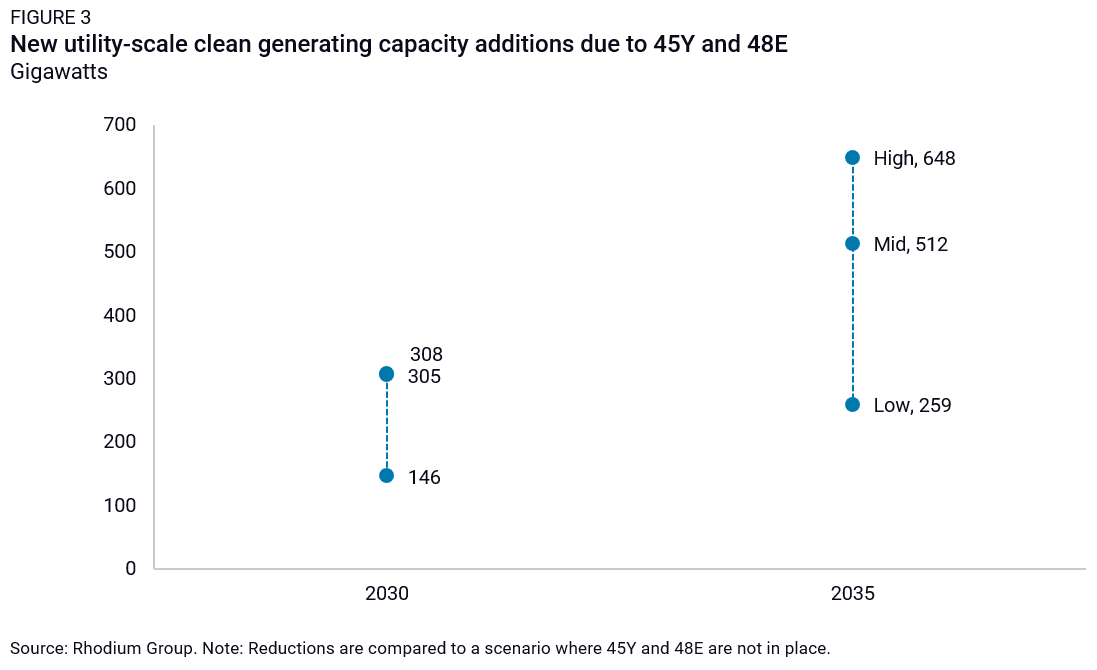
These emission reductions are accomplished by accelerating deployment of clean generating capacity well into the 2030s. We estimate that these tax credits drive an additional net 146-308 GWs of clean capacity onto the grid by 2030 (Figure 3). These additions consist primarily of solar PV, followed by batteries and wind. In 2035, net clean capacity additions from the tax credits surge to 259-648 GWs, increasing total installed clean capacity to 900 GW to 1.9 TW that year, or by up to 50%.
This is an ambitious level of clean electricity deployment. Our modeling assumes that economically competitive new capacity gets built on reasonable timeframes over the next decade. The pace of clean energy additions to date has fallen behind what we’ve previously modeled. High interest rates, siting and permitting challenges, and long interconnection wait times all present headwinds to clean electricity deployment. While there is still time for the industry to speed up, realizing the full benefits we model here likely requires improvements in addressing these impediments.
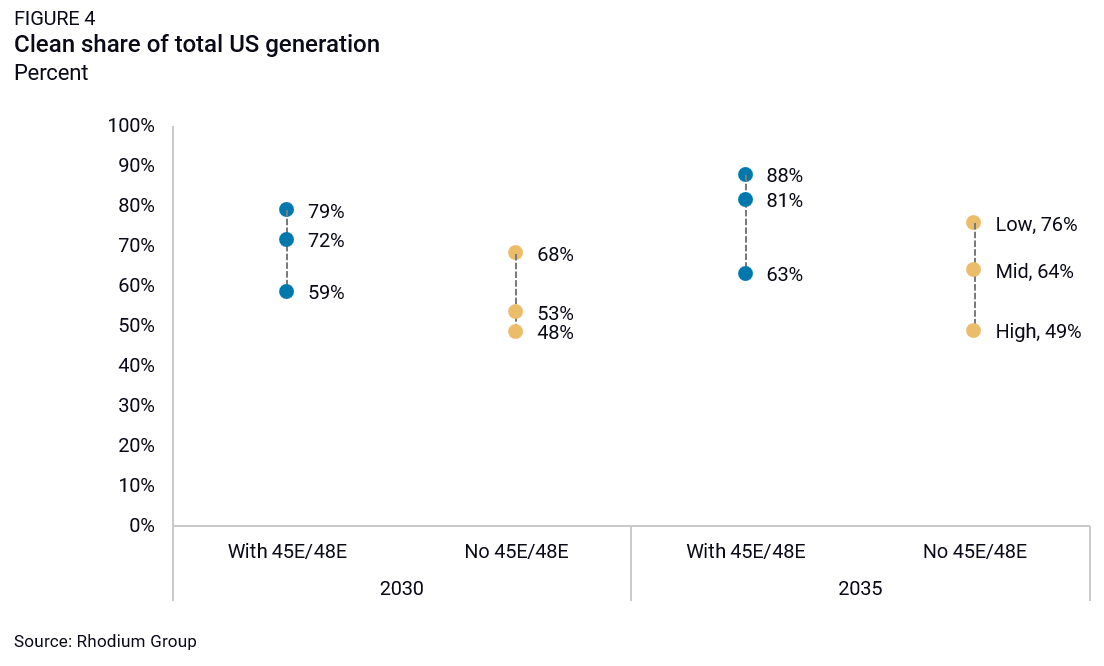
These new clean capacity additions driven by 45Y and 48E prevent some new uncontrolled fossil generation from being built and displace generation from existing coal and natural gas power plants. Today, clean generation provides roughly 40% of all electricity on the US grid. In 2030, without the tech-neutral tax credits, we estimate that share will rise to 48-68% and 49-76% in 2035 (figure 4). With 45Y and 48E in place, clean generation surges to 59-79% in 2030 and 63-88% in 2035. This represents an additional 12-15 percentage point increase by the mid-2030s in clean generation’s national market share.
There have been a number of reports of expected acceleration in new electric load growth lately. In these projections, we do take into account the new electric load associated with the electrification of buildings and vehicles but do not completely account for potential new growth associated with manufacturing and data centers. We believe our estimates hold in directional terms, though actual values may shift as we incorporate these factors into future updates in our Taking Stock projections.
Conventional pollutant relief and consumer savings
The surge in clean, zero-emitting generation doesn’t just cut CO2 emissions—it also drives reductions in conventional pollutant emissions that harm public health through increased asthma attacks, respiratory illnesses, emergency room visits, and premature deaths. 45Y and 48E also deliver cost savings for consumers as the cost of new clean capacity shifts from ratepayers to the tax base and clean generation puts downward pressure on natural gas prices.
Cleaner air
We find conventional pollutant emissions from power plants decline substantially. Without 45Y and 48E, sulfur dioxide (SO2) emissions from (predominantly coal) power plants are 0.27-0.31 million short tons in 2030 and stay roughly at that level through 2035 (Figure 5). With the tech-neutral tax credits, SO2 emissions drop to 0.18-0.27 million short tons in 2030 and continue to decline to 0.15-0.21 million short tons in 2035. The latter represents a 28-46% reduction compared to a case with no tech-neutral tax credits. Our results may differ once EPA’s new regulations on CO2 emissions from existing coal plants are taken into account, as there may be fewer coal plants online with the rules in place.

We find a similar story for oxides of nitrogen (NOx), which come from both coal and natural gas power plants. Without 45Y and 48E, NOx emissions from electric power plants are 0.33-0.40 million short tons in 2030, declining slightly to 0.30-0.39 million short tons in 2035 (Figure 6). With the tech-neutral tax credits, emissions drop to 0.27-0.35 million short tons in 2030 and decline further to 0.22-0.31 million short tons in 2035, a 21-27% reduction. Again, once EPA’s final CO2 regulations on existing coal and new natural gas are taken into account, we may see a somewhat smaller difference between the tax credit scenarios since there will likely be fewer coal plants online in the 2030s.
Consumers save
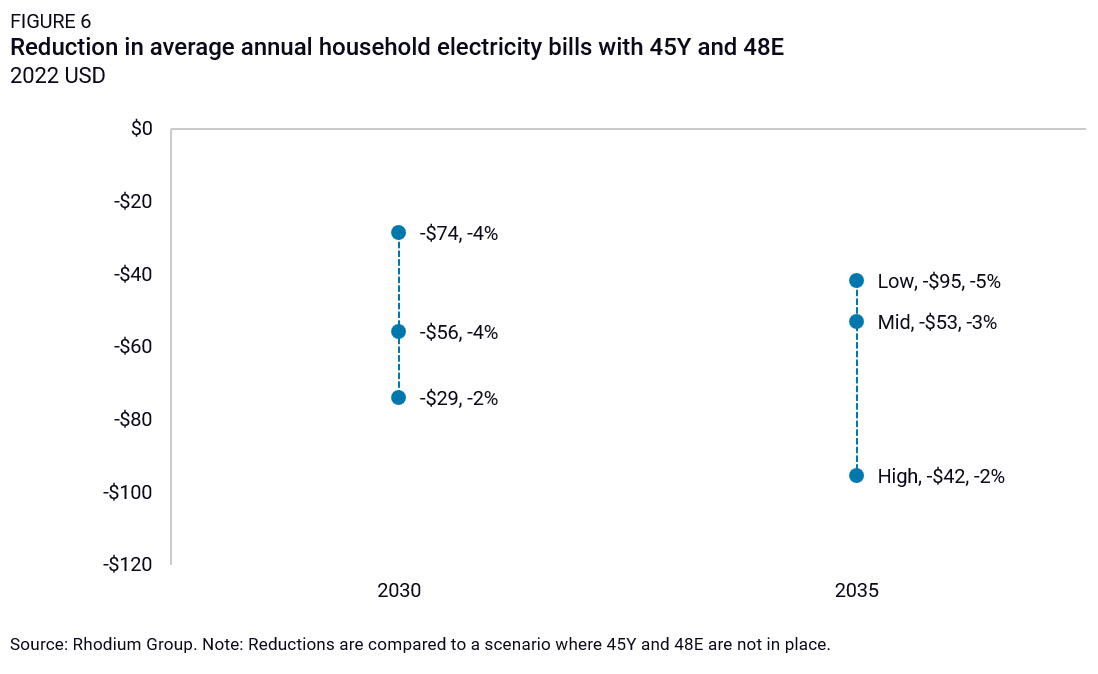
The tech-neutral tax credits reduce pollution and save money for consumers. We estimate that in 2030, US average annual electric bills could be $29-74 lower per household with the tech-neutral tax credits in place, a savings of 2-4% (Figure 6). The level of savings rises to $42-95 (2-5% savings) per household in 2035.
Consumers across the commercial and industrial sectors also see reductions in electricity costs. When looking at economy-wide electricity cost savings, we find that US consumers across all sectors will see a total savings of $11-24 billion in 2030, rising to $16-34 billion in 2035. That latter represents a 5% cut in electricity costs. These estimates represent the savings impact of 45Y and 48E alone, above and beyond what benefits ratepayers will see from other IRA programs such as the building efficiency tax credits, distributed generation tax credits, DOE grant programs, and EPA’s GHG reduction fund.
What to look for when the IRS issues guidance
The IRS may issue initial guidance on 45Y and 48E any week now. It will be important for the agency to send a clear signal to the market that commercial-scale, zero-emitting clean resources like wind, solar, and batteries will qualify for the new credits without any uncertainty. This should avoid any unnecessary confusion and uncertainty in an already turbulent market. Beyond that, we will be watching just how the IRS defines zero-emitting generation resources, what the implications might be for emerging generation technologies like enhanced geothermal and advanced nuclear, and whether the door is left open for other technologies that aren’t demonstrated at scale yet. The latter is important to provide long-term certainty for innovators as they work to bring new technologies and even new classes of electricity to market in the coming years.
Another key area we will be watching is how the IRS handles the IRA’s requirements for lifecycle emissions assessments for technologies that rely on combustion or gasification to count, as long as their lifecycle emissions are net-zero. As we’ve seen in the clean fuel and clean hydrogen tax credit implementation processes, lifecycle accounting (LCA) is complicated and politically contentious. Will the IRS seek to provide continuity in LCA treatment across tax credits? Will it need to take a different approach tailored to unique aspects of the electric power system?
In the medium term, after the guidance is final, it will be interesting to see disparate technology-specific interest groups begin to cooperate and collaborate to advocate for enhancement or extension of the tech-neutral tax credits. Traditionally, the wind industry advocated for its own interests separately, as did the solar and storage industries. Down the road, 45Y and 48E may catalyze a more unified, broad, and sophisticated multi-technology coalition advocating for sustained electric power sector decarbonization. Time will tell.
One thing is clear from our analysis: 45Y and 48E are central components of accelerated decarbonization within the IRA. Providing certainty to the market both for currently commercial and emerging generation technologies is critical to maintaining progress on emission reductions in the US electric power sector. What’s more, emission reductions in the power sector are critical to broader economy-wide decarbonization. From an emissions perspective, IRS guidance on 45Y and 48E may be the most important step the agency will take in implementing the IRA.
This nonpartisan, independent research was conducted with support from Breakthrough Energy. The results presented reflect the views of the authors and not necessarily those of the supporting organization.