Transatlantic Clean Investment Monitor: Comparing Deployment and Manufacturing Trends in Europe and the United States
This note marks the start of a new collaboration between Bruegel and Rhodium Group to compare clean technology deployment and manufacturing trends in Europe and the United States.
This note marks the start of a new collaboration between Bruegel and Rhodium Group to compare clean technology deployment and manufacturing trends in Europe and the United States with a series of quarterly briefings.
Both Europe and the US have witnessed a revival of industrial policy focused on clean technology supply chains in the past couple of years. This has been driven foremost by the Inflation Reduction Act in the US and, as a response to that, by the Net-Zero Industry Act in the EU. In the wake of these policies, Rhodium Group and Bruegel have respectively developed monitoring tools for the US and Europe to respond to an increasing need for transparent and independent data on the manufacturing and deployment of clean technologies. The Clean Investment Monitor, a joint project of Rhodium Group and MIT’s Center for Energy and Environmental Policy Research (CEEPR), tracks public and private investment in the manufacturing and deployment of clean technologies in the US, while Bruegel’s European Clean Tech Tracker provides an overview of the main clean technology manufacturing and deployment trends in Europe.
Using data from these two trackers, Rhodium Group and Bruegel have teamed up to provide a granular comparison of clean technology deployment and manufacturing trends on both sides of the Atlantic. This first in a series of quarterly briefings provides an overview of the deployment and manufacturing capacity of four key clean technologies—wind, solar, battery electric vehicles, and electrolytic hydrogen. In terms of deployment, we find Europe leads in wind, solar, and battery electric vehicle adoption, though the US gained ground on Europe last year in electric vehicle registrations, mainly due to the increasing popularity of plug-in hybrid vehicles in the US and their declining sales in Europe. Europe also overtook the US last year in electrolyzer deployment for the production of green hydrogen. In terms of manufacturing, we find significant on-the-ground growth over the past three years, with Europe leading in wind, electrolyzers, and inverters manufacturing, and the US leading in solar modules and battery cells manufacturing.
The battle over each new manufacturing facility—and the associated jobs and economic development that come with them—is only just heating up. US and EU officials have already let tensions spill into the public view as each government tries to strike a balance between encouraging domestic growth, accelerating a clean energy transition, and maintaining energy and supply chain security. Climate leadership requires navigating domestic political realities, legal constraints, and international diplomatic ties. In future notes in this series, we will take a forward-looking view, exploring how policy differences and economic realities are translating into project announcements and actual groundbreakings, and what this foretells about the pace of the transition in these two major economies.
Solar and wind power
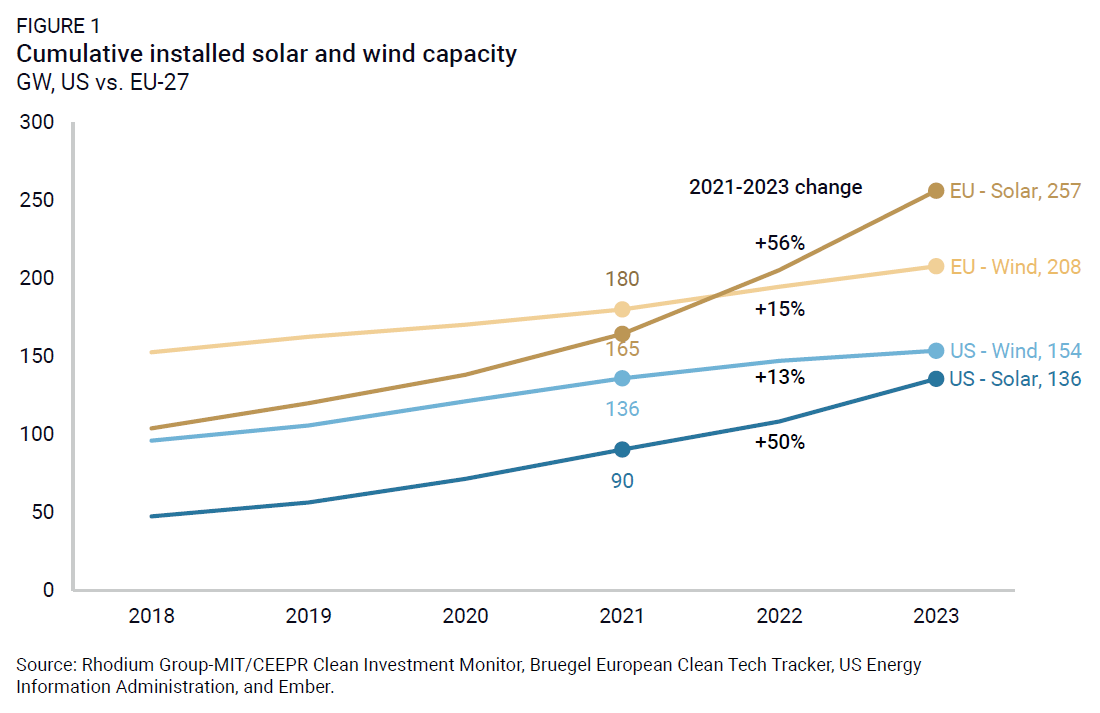
The EU leads the US in the overall deployment of both solar PV and wind capacity. By the end of 2023, 257 GW of solar PV and 208 GW of wind were connected to grids in the EU, including both utility-scale and distributed generation. This is compared to 136 GW of solar PV and 154 GW of wind in the US (Figure 1). The deployment gap is the most prominent for solar PV, where the EU has deployed nearly twice that of the US. Electricity demand is higher in the US (4,350 TWh in 2023) than in the EU (2,700 TWh), so this deployment difference is even starker when considered relative to demand.
While wind historically has made up a larger share of total capacity compared with solar across both regions, the recent expansion of solar PV capacity is substantially faster than for wind. From 2021 to 2023, the EU built out 92 GW of solar, increasing capacity by 56%. For the US, 45 GW of solar was deployed, increasing overall capacity by 50%. For wind, the EU grew capacity by 28 GW in the last two years, a 15% increase. Wind capacity in the US grew by 18 GW, also a 13% increase.
Solar panel manufacturing involves multiple components and value chain stages. For much of the solar market, the starting point is producing polysilicon. Both the US and EU have substantial capacity for polysilicon manufacturing, although this capacity is also used for the manufacture of semiconductors. In the US, polysilicon production for solar has dropped to nearly zero since 2015 as prices dropped and China became dominant in this space, though some facilities have begun transitioning back to polysilicon production from chip manufacturing or expanding production for solar.
Following polysilicon production, the next stages involve energy-intensive processes to transform polysilicon into intermediate products of ingots and wafers, and ultimately solar PV cells. Neither the US nor the EU have substantial capacities for ingots or wafers—globally, these stages are dominated by China.
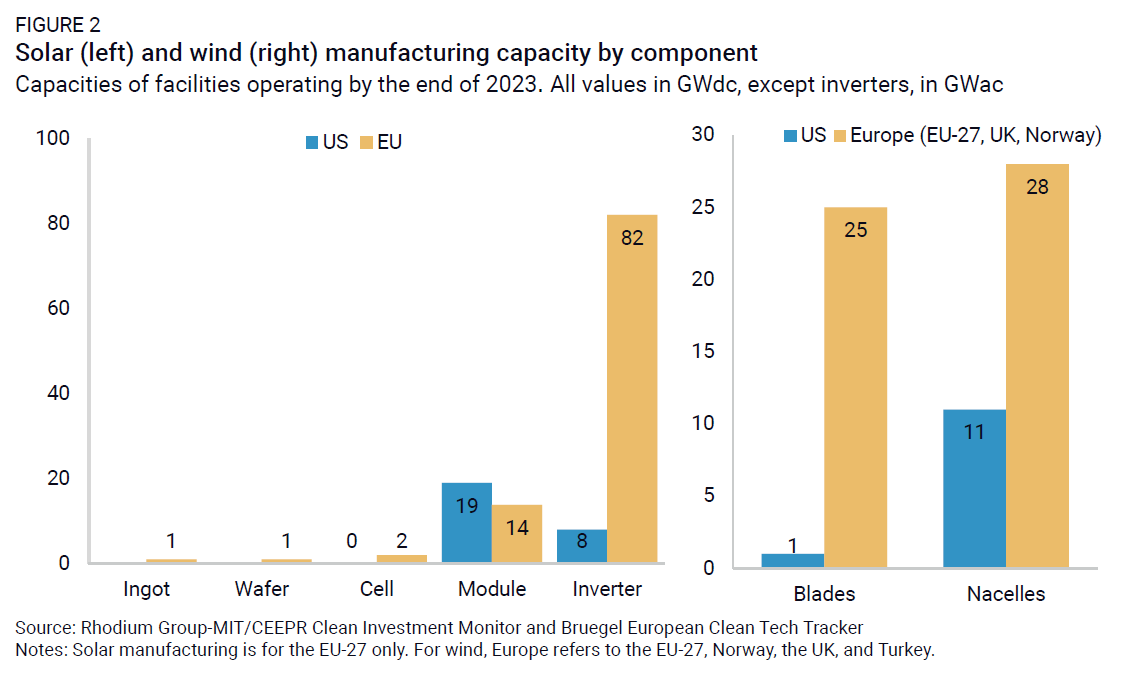
Module assembly is the final stage in the manufacture of a solar PV module and is more job-intensive than previous stages. Here, the US and EU have more noteworthy capacities, with 19 GW and 15 GW, respectively (Figure 2). For both, this amounts to more than one-third of deployed solar PV in 2023. The EU is a large manufacturer of inverters that convert electricity between different types of currents, a necessary component for connecting solar panels to the wider electricity grid. Like polysilicon, inverters are not used exclusively for solar panels but also for other technologies.
When it comes to wind manufacturing, Europe has a long history of expertise in the manufacture of turbines and complementary components. This is reflected in current manufacturing capacity data (Figure 2). For blades, Europe has the capacity to manufacture the equivalent of 25 GW per annum and 28 GW for nacelles. A nacelle is an important section of a wind turbine, which converts the turning of blades via gears and the generator into electricity. The US has significantly lower capacities in both stages.
Electric vehicles and batteries
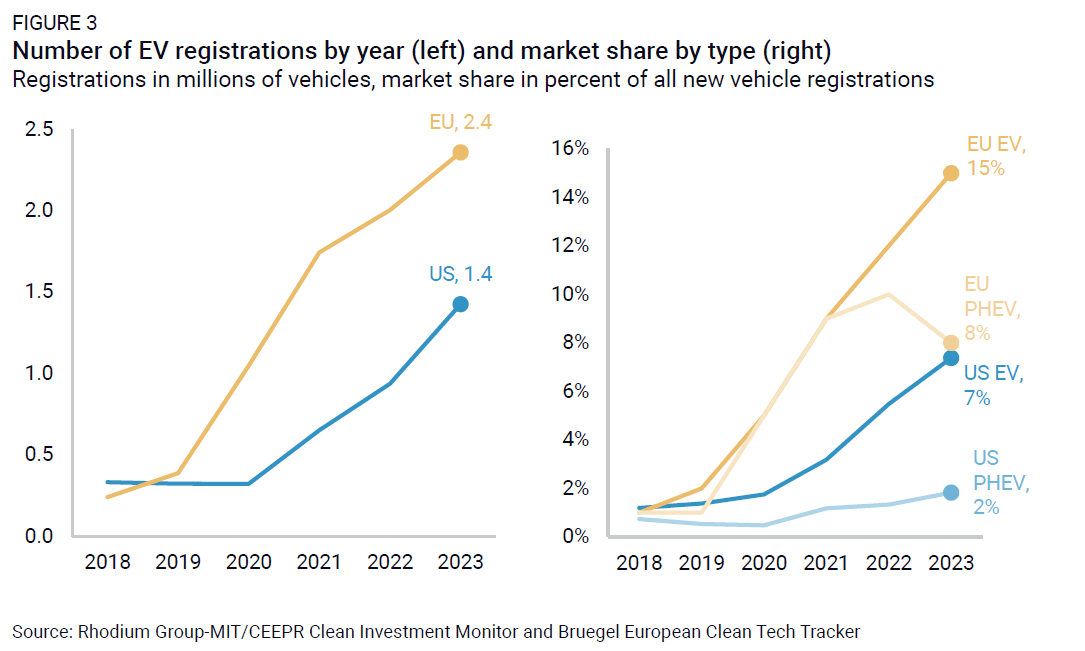
The deployment of electric vehicles (EVs) has significantly accelerated in both the US and Europe in the past five years, showing progress towards decarbonizing transportation, which is the biggest source of greenhouse gas emissions in both regions. While EV registrations hovered around 350,000 vehicles in both regions in 2018-2019, EV adoption accelerated earlier in Europe. As shown in Figure 3, EU EV registrations reached 2.36 million vehicles in 2023. But the US has begun to catch up; in 2023, EV registrations topped 1.43 million vehicles in the US, a 52% year-on-year increase since 2022. By contrast, EV adoption in the EU grew by only 18% in the same year.
On both sides of the Atlantic, buyers have favored pure battery-electric vehicles (BEVs) over plug-in-hybrid electric vehicles (PHEVs), though PHEV registrations have begun picking up in the US in recent quarters. Over the past two years, the share of PHEVs in the EU’s total vehicle sales peaked and then declined to just under 8%, whereas BEVs’ share of total sales rose from 9% to 15% between 2021 and 2023 (Figure 3). Over the same period in the US, BEVs’ share rose from 3% in 2021 to 7% in 2023, while PHEVs grew more slowly, reaching just under 2% of sales in 2023.
As the market share of EVs rises around the world, the demand for batteries to equip these vehicles is also increasing rapidly. Recent tariffs imposed by the US and EU on imports of EVs from China have brought more attention to domestic EV and battery manufacturing capacity. A comparison of battery cell manufacturing across both regions (Figure 4) shows that while EU capacity was 2.3 times larger than US capacity in 2021 at 135 GWh, investments in new capacity since then have reversed the picture. By 2023, the US capacity of battery cell manufacturing has grown three-fold to reach 188 GWh. While nine facilities were operational in the US in 2021, this number increased to 27 in 2023, according to the Clean Investment Monitor. On the other hand, EU battery cell manufacturing capacity increased by just 17% to 158 GWh.

Electrolytic (green) hydrogen
Hydrogen is an important chemical and energy vector for existing industrial processes. Much of it is currently derived from natural gas, which causes high carbon emissions. When these carbon emissions are captured and sequestered, the term “blue hydrogen” is used to indicate the substantially lower carbon footprint compared to unabated “grey hydrogen.” Hydrogen can also be produced through electrolysis, where an electrical current splits water into hydrogen and oxygen, with no associated carbon emissions. When the electricity used is generated from renewable sources, the resulting product is referred to as “green hydrogen,” which is our focus here.
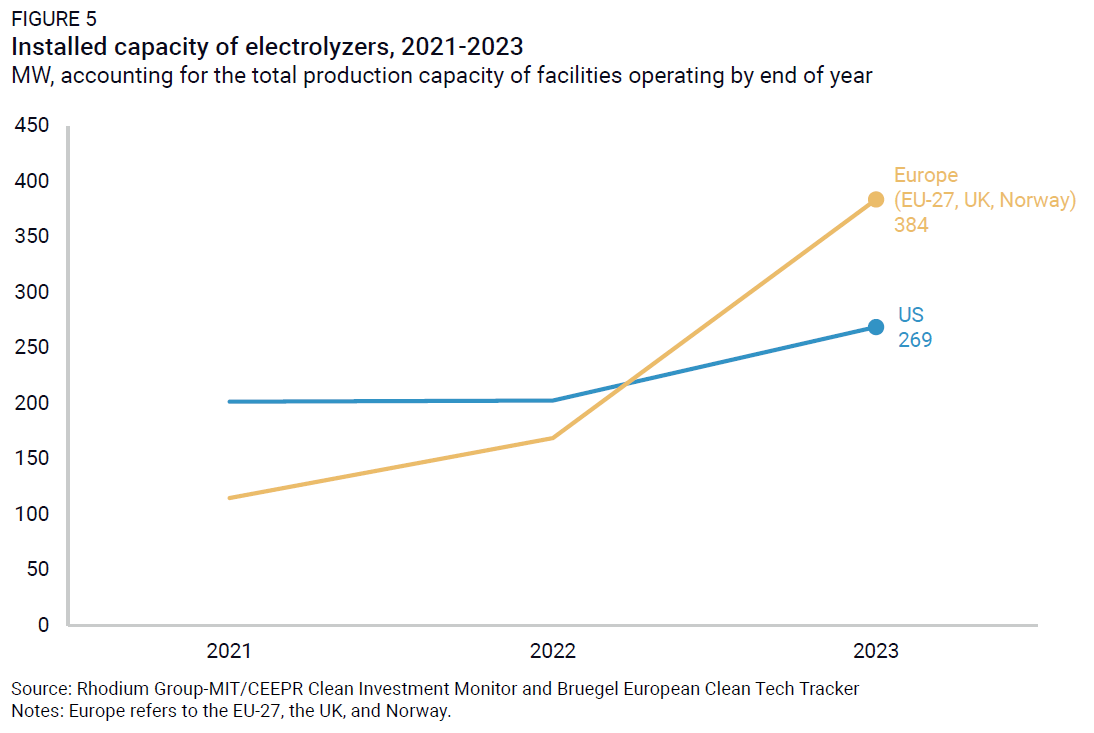
Europe overtook the US last year in terms of electrolyzer deployment, with 384 MW of installed capacity, compared to 269 MW (Figure 5). Notably, Europe experienced a 300% rise in capacity from 2021 to 2023, whereas US capacity rose by 33% over the same period. However, electrolytic hydrogen still makes up a very marginal share of hydrogen production capacity in both regions. In the REPowerEU plan, Europe has set a political target for renewable hydrogen deployment, aiming to produce 10 million metric tons in the EU by 2030. This production level is estimated to require between 65 and 80 GW (65,000 to 80,000 MW) of capacity deployed. In the National Clean Hydrogen Strategy and Roadmap, the US also sets out a 10 million metric tons (non-binding) objective for clean hydrogen by 2030, which includes both green and blue hydrogen. While this US objective can be met with a combination of technologies, electrolyzers would need to be deployed more than a hundred times the current pace in both regions to play a significant role in meeting these targets.
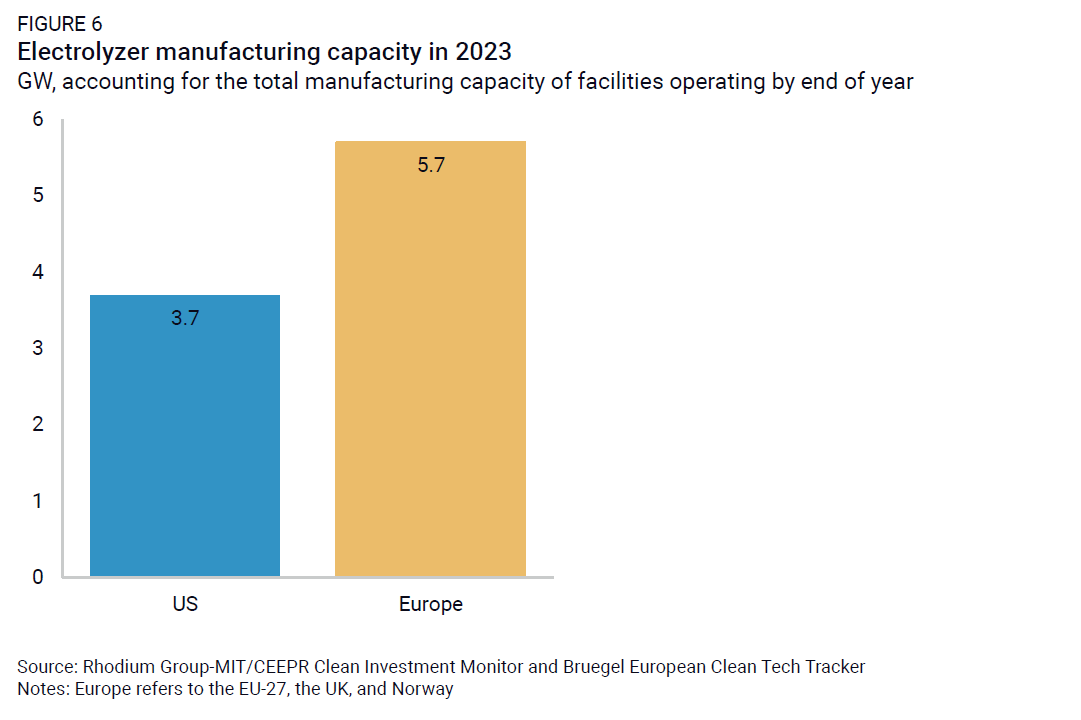
The slow pace of hydrogen deployment is not due to supply constraints on equipment. Global electrolyzer manufacturing capacity is currently largely underutilized, and this is also the case in the US and Europe, where manufacturing capacity last year stood at 3.7 GW and 5.7 GW respectively (Figure 6).
Looking ahead
Momentum on clean technology deployment and manufacturing is set to gather speed in the coming years, partly driven by recent policy interventions on both sides of the Atlantic. In the coming months, all eyes will be on how industrial and trade policy measures will evolve as a result of the electoral cycles in both Europe and the US and how these will affect clean technologies. Rhodium Group and MIT CEEPR’s Clean Investment Monitor and the Bruegel European Clean Tech Tracker will continue to actively monitor clean tech deployment and manufacturing trends as companies navigate these dynamics. In our next quarterly briefings, we will provide insights into the announced and in-process developments of different clean technologies, in order to better inform political and policy discussions in this rapidly evolving space across the Atlantic.
This nonpartisan, independent research was conducted with support from the Children’s Investment Fund Foundation. The results presented reflect the views of the authors and not necessarily those of the supporting organization.