Trump 2.0: What’s in Store for US Energy and Climate?
Rolling back executive action on climate could raise average household energy costs, increase dependence on oil and gas imports, drive up GHG emissions, and put substantial levels of private investment at risk.
Though President Trump’s return to the White House and unified Republican control of Congress may evoke a return to 2017, this time is different. Yes, the executive branch under President Trump is likely to reprise its efforts to roll back regulations that reduce greenhouse gas (GHG) emissions. But this will occur in a markedly different context—during the Biden administration, an array of energy policies were enacted via legislation to lower energy costs for consumers, cut greenhouse gas (GHG) emissions and air pollution, foster domestic manufacturing and accelerate the energy transition. While the climate and energy policy priorities under a unified Republican government in 2025 remain uncertain, these energy provisions appear high on the target list. In this note, we unpack the energy and climate impacts of a range of policy pathways that the White House and Congress could pursue in 2025.
We find that rolling back executive action on climate and repealing the energy and tax policies that were enhanced and expanded through the Inflation Reduction Act (IRA) starting in 2025 could raise average household energy costs by as much as $489 a year in 2035, increase dependence on imported oil and gas, drive GHG emissions levels 24-36% higher compared to current policy in 2035, and risk substantial levels of private investment. However, opportunities remain to advance energy innovation, including investments in research, development, demonstration and deployment of clean energy technologies, reforms to accelerate siting and permitting of energy infrastructure, and clean trade measures.
Past is prologue?
During the campaign and in the days since the election, the incoming Trump administration has made it clear they intend to remove key federal regulations promulgated by the Environmental Protection Agency (EPA) and other executive branch agencies aimed at reducing GHG emissions—including GHG standards for cars and trucks, methane standards for oil and gas production, and GHG standards for fossil fuel-fired power plants, among others. The Trump administration could roll back these regulations through a mix of Congressional Review Act resolutions and executive actions. This approach matches the playbook used in the first Trump term that resulted in rolling back more than 100 environmental regulations.
The key question in energy and climate policymaking circles is the fate of energy and climate tax provisions, grant programs, and other policy vehicles enacted via the IRA, the Infrastructure Investment and Jobs Act (IIJA), and the CHIPS and Science Act during the Biden administration. The Trump administration and Republicans demonstrated little interest in weakening renewable energy tax credits during their two years of consolidated control in Washington. That makes sense: there’s a bipartisan history of support for these tax credits. The original clean electricity production tax credit (PTC), passed by Democrats in the House and Senate and signed by President George H.W. Bush in 1992, illustrates this cross-party collaboration. Since then, the PTC and similar credits supporting a variety of clean technologies have been renewed repeatedly under different partisan alignments. Even President Trump extended renewable tax credits, alongside enhancements to carbon capture incentives, and energy efficiency tax credits for commercial and residential buildings and biofuels.
However, the scale of today’s tax credits dwarfs their predecessors. A small group of House Republicans has come out in favor of retaining these credits, leading House Speaker Mike Johnson (R-LA) to suggest that “a scalpel and not a sledgehammer” is the right tool for making changes. Still, the multi-trillion-dollar price tag for extending tax code changes in the 2017 Tax Cuts and Jobs Act may prompt a reevaluation of these credits as useful “pay-fors.”
Beyond tax credits, these landmark climate bills include more than $100 billion in climate, clean energy, and environmental grants and other spending. Though the Biden administration has been working overtime to get this funding out the door before January 20, 2025, anything that remains to be obligated after the Trump administration takes the reins is likely to face stiff headwinds. Similarly at risk is unallocated funding in the Department of Energy Loan Programs Office portfolio. These grants and loans represent important counterparts to the tax credits, often supporting earlier-stage technologies, and their loss would likely reverberate by shrinking the pipeline of innovative technology options.
What impacts do policy changes have?
To begin to understand potential policy decisions made by the second Trump administration and Republicans in Congress, we quantified the impacts of two future policy pathways:
- Rollbacks: Under this policy pathway, the Trump administration repeals key climate regulations including: EPA’s GHG standards for new and existing coal plants and new gas plants; light-duty vehicle (LDV) regulations from EPA and the National Highway Transportation Safety Administration (NHTSA) governing model year 2027 and beyond LDVs; Phase 3 medium- and heavy-duty vehicle GHG standards from EPA; and EPA’s methane emissions limits on oil and gas operations. The Trump administration also revokes its waivers to California allowing the state to establish its own vehicle rules, resulting in California and states that follow its lead being unable to implement the Advanced Clean Cars I and II and Advanced Clean Trucks rules. While additional executive actions by the Trump administration could further impact GHG emissions, this pathway represents a starting point of major regulatory rollbacks.
- Rollbacks and repeal: Building on the rollbacks described above, this pathway also includes the repeal of all components of the IRA beginning in 2025. We detail the components of the IRA that we model under current policy in the technical appendix of Taking Stock 2024. It’s far from guaranteed that this is the policy pathway that Trump and a Republican Congress would pursue, but we provide it as a preliminary bounding case estimate.
We compare these policy pathways with our modeling of current policy outcomes from Taking Stock 2024, which reflects all binding federal and state policies on the books as of June 2024. To understand the range of potential impacts, we use the same three main emissions scenarios reported in Taking Stock 2024: a low-emissions scenario that pairs cheap clean energy technologies with more expensive future fossil fuel prices and slightly slower GDP growth; a high-emissions scenario that pairs more expensive clean technologies with cheap fossil fuels and as-anticipated GDP growth; and a mid-emissions scenario that cuts the difference between the two. To model these policy pathways and emissions scenarios, we use RHG-NEMS, our version of the National Energy Modeling System developed by the US Energy Information Administration. More information on RHG-NEMS and the assumptions underlying these emissions scenarios is available in the Taking Stock 2024 technical appendix.
We analyze the resulting impacts in three main categories: energy bills and prices, fossil fuel production and trade, and GHG emissions. We also discuss the potential impacts on clean energy investment in the broader economy. While we focus this note on rollbacks and IRA repeal, the incoming administration has announced a host of other policy shifts. These include raising tariffs on all imports from key countries, limitations on technology exports and imports, expanding fossil fuel leasing on public lands, and increasing export infrastructure. Given the uncertainty around the shape, scope, and timing of these actions we don’t account for them here, but plan to track developments moving forward.
Energy prices and costs rise for households and businesses
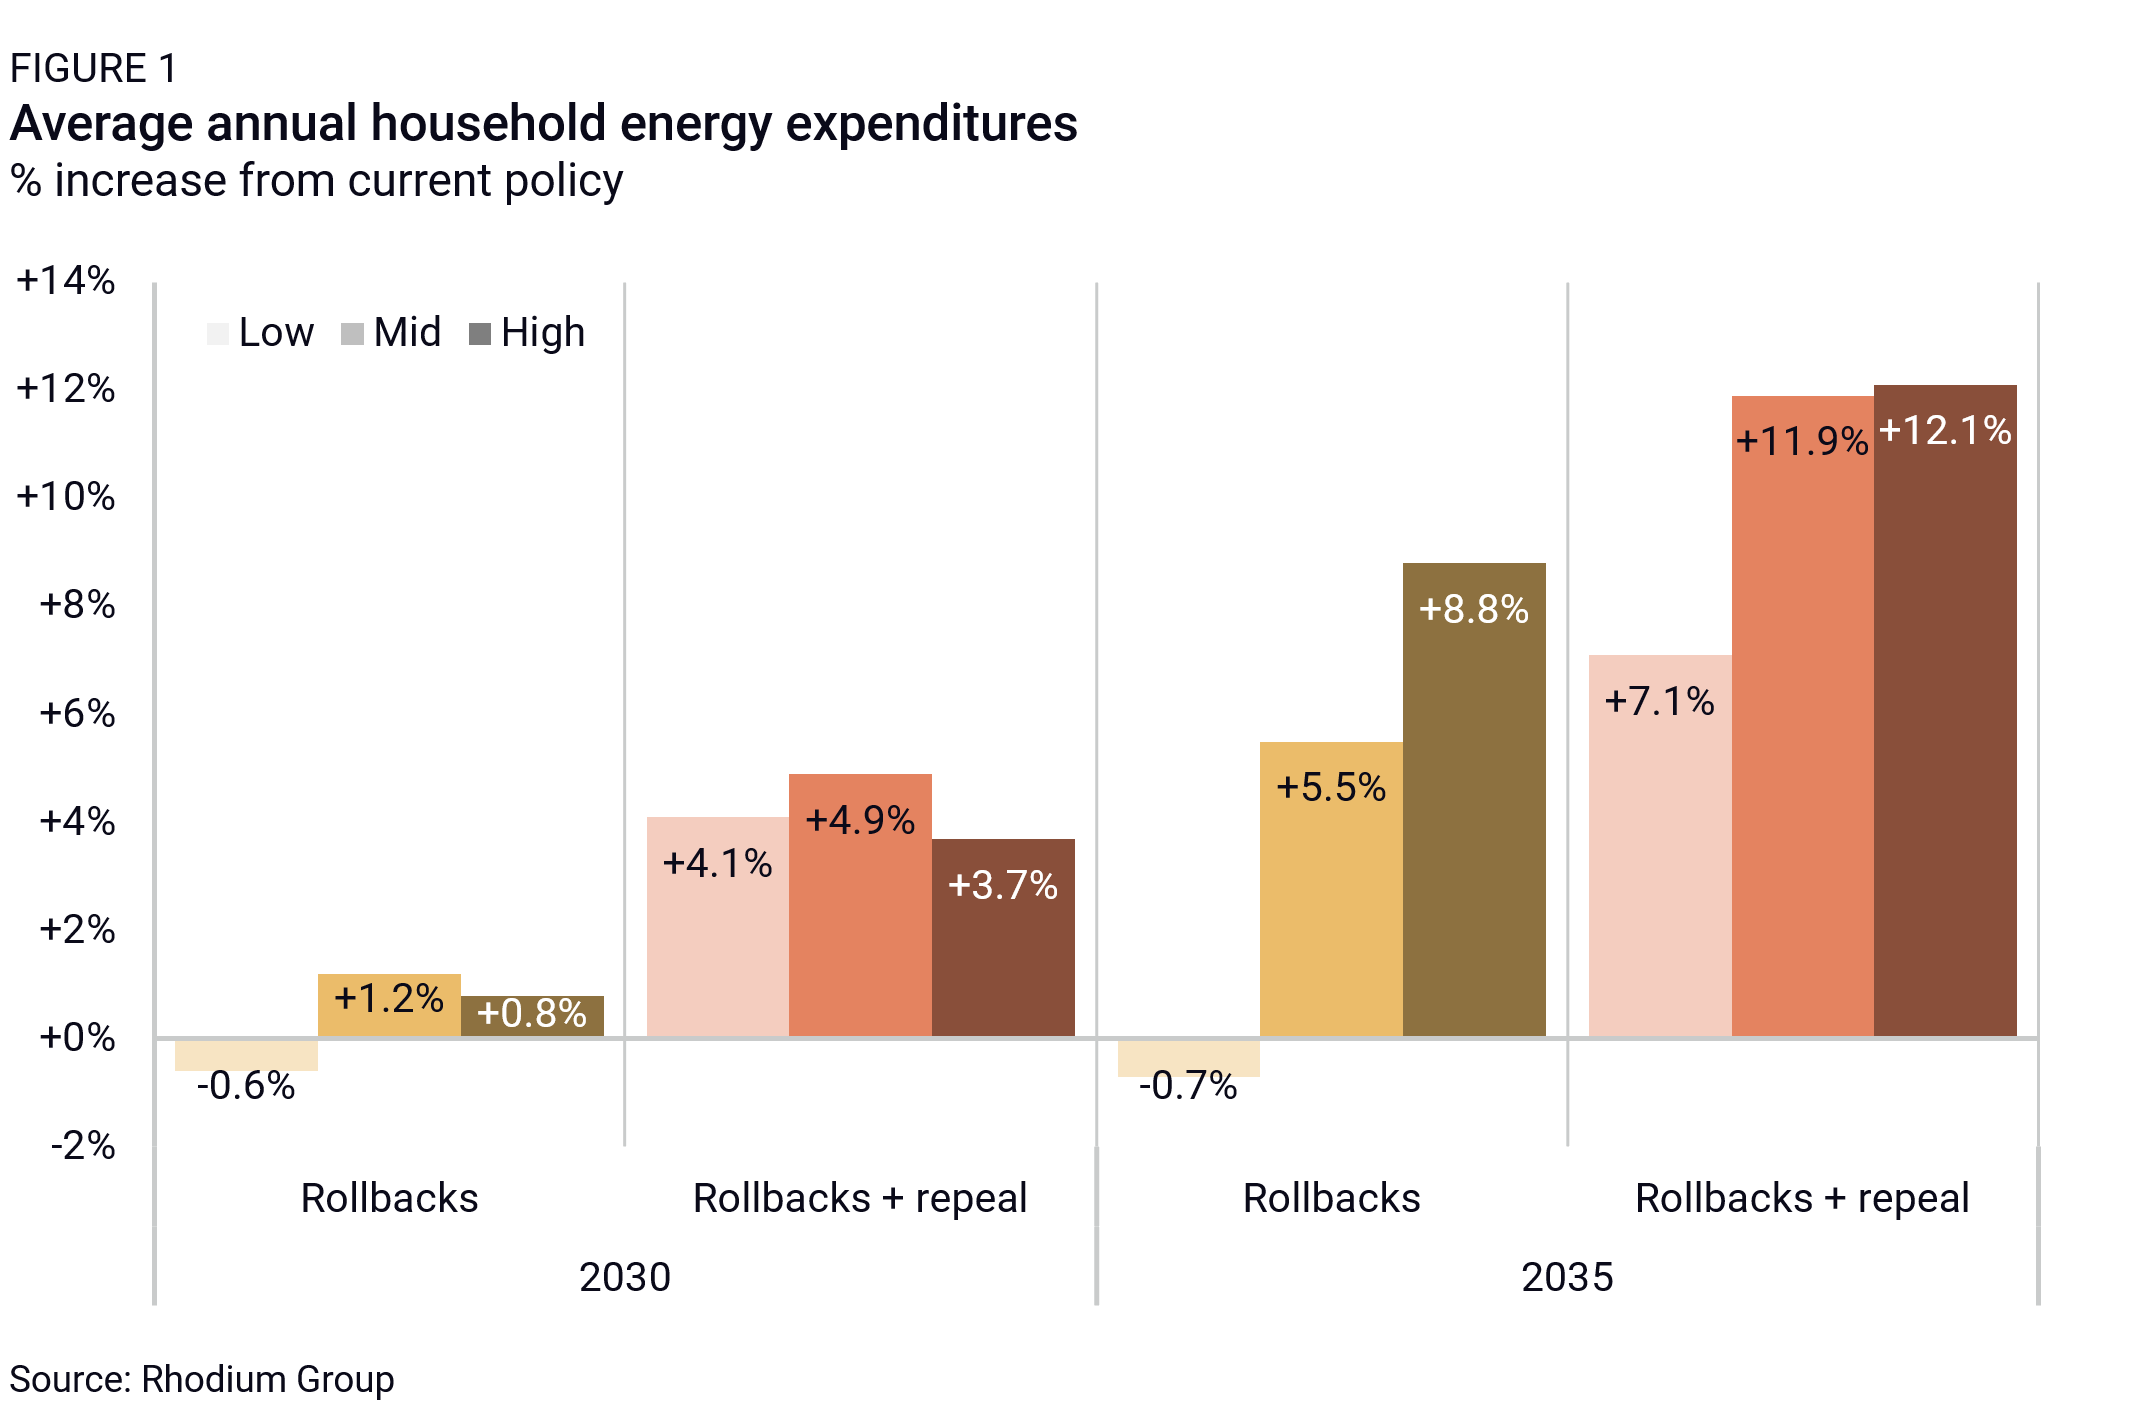
We find that both policy pathways could increase household energy bills. In 2035, national average annual household energy bills are 7-12% higher ($299 to $489) under the rollbacks + repeal pathway relative to current policy (Figure 1). Under the rollbacks pathway, by 2035, bills increase in the mid and high emissions scenarios by 6% and 9%, respectively, ($226 and $346), but they remain effectively flat in the low emissions scenario. These trends also hold in 2030, but the effects are more modest.
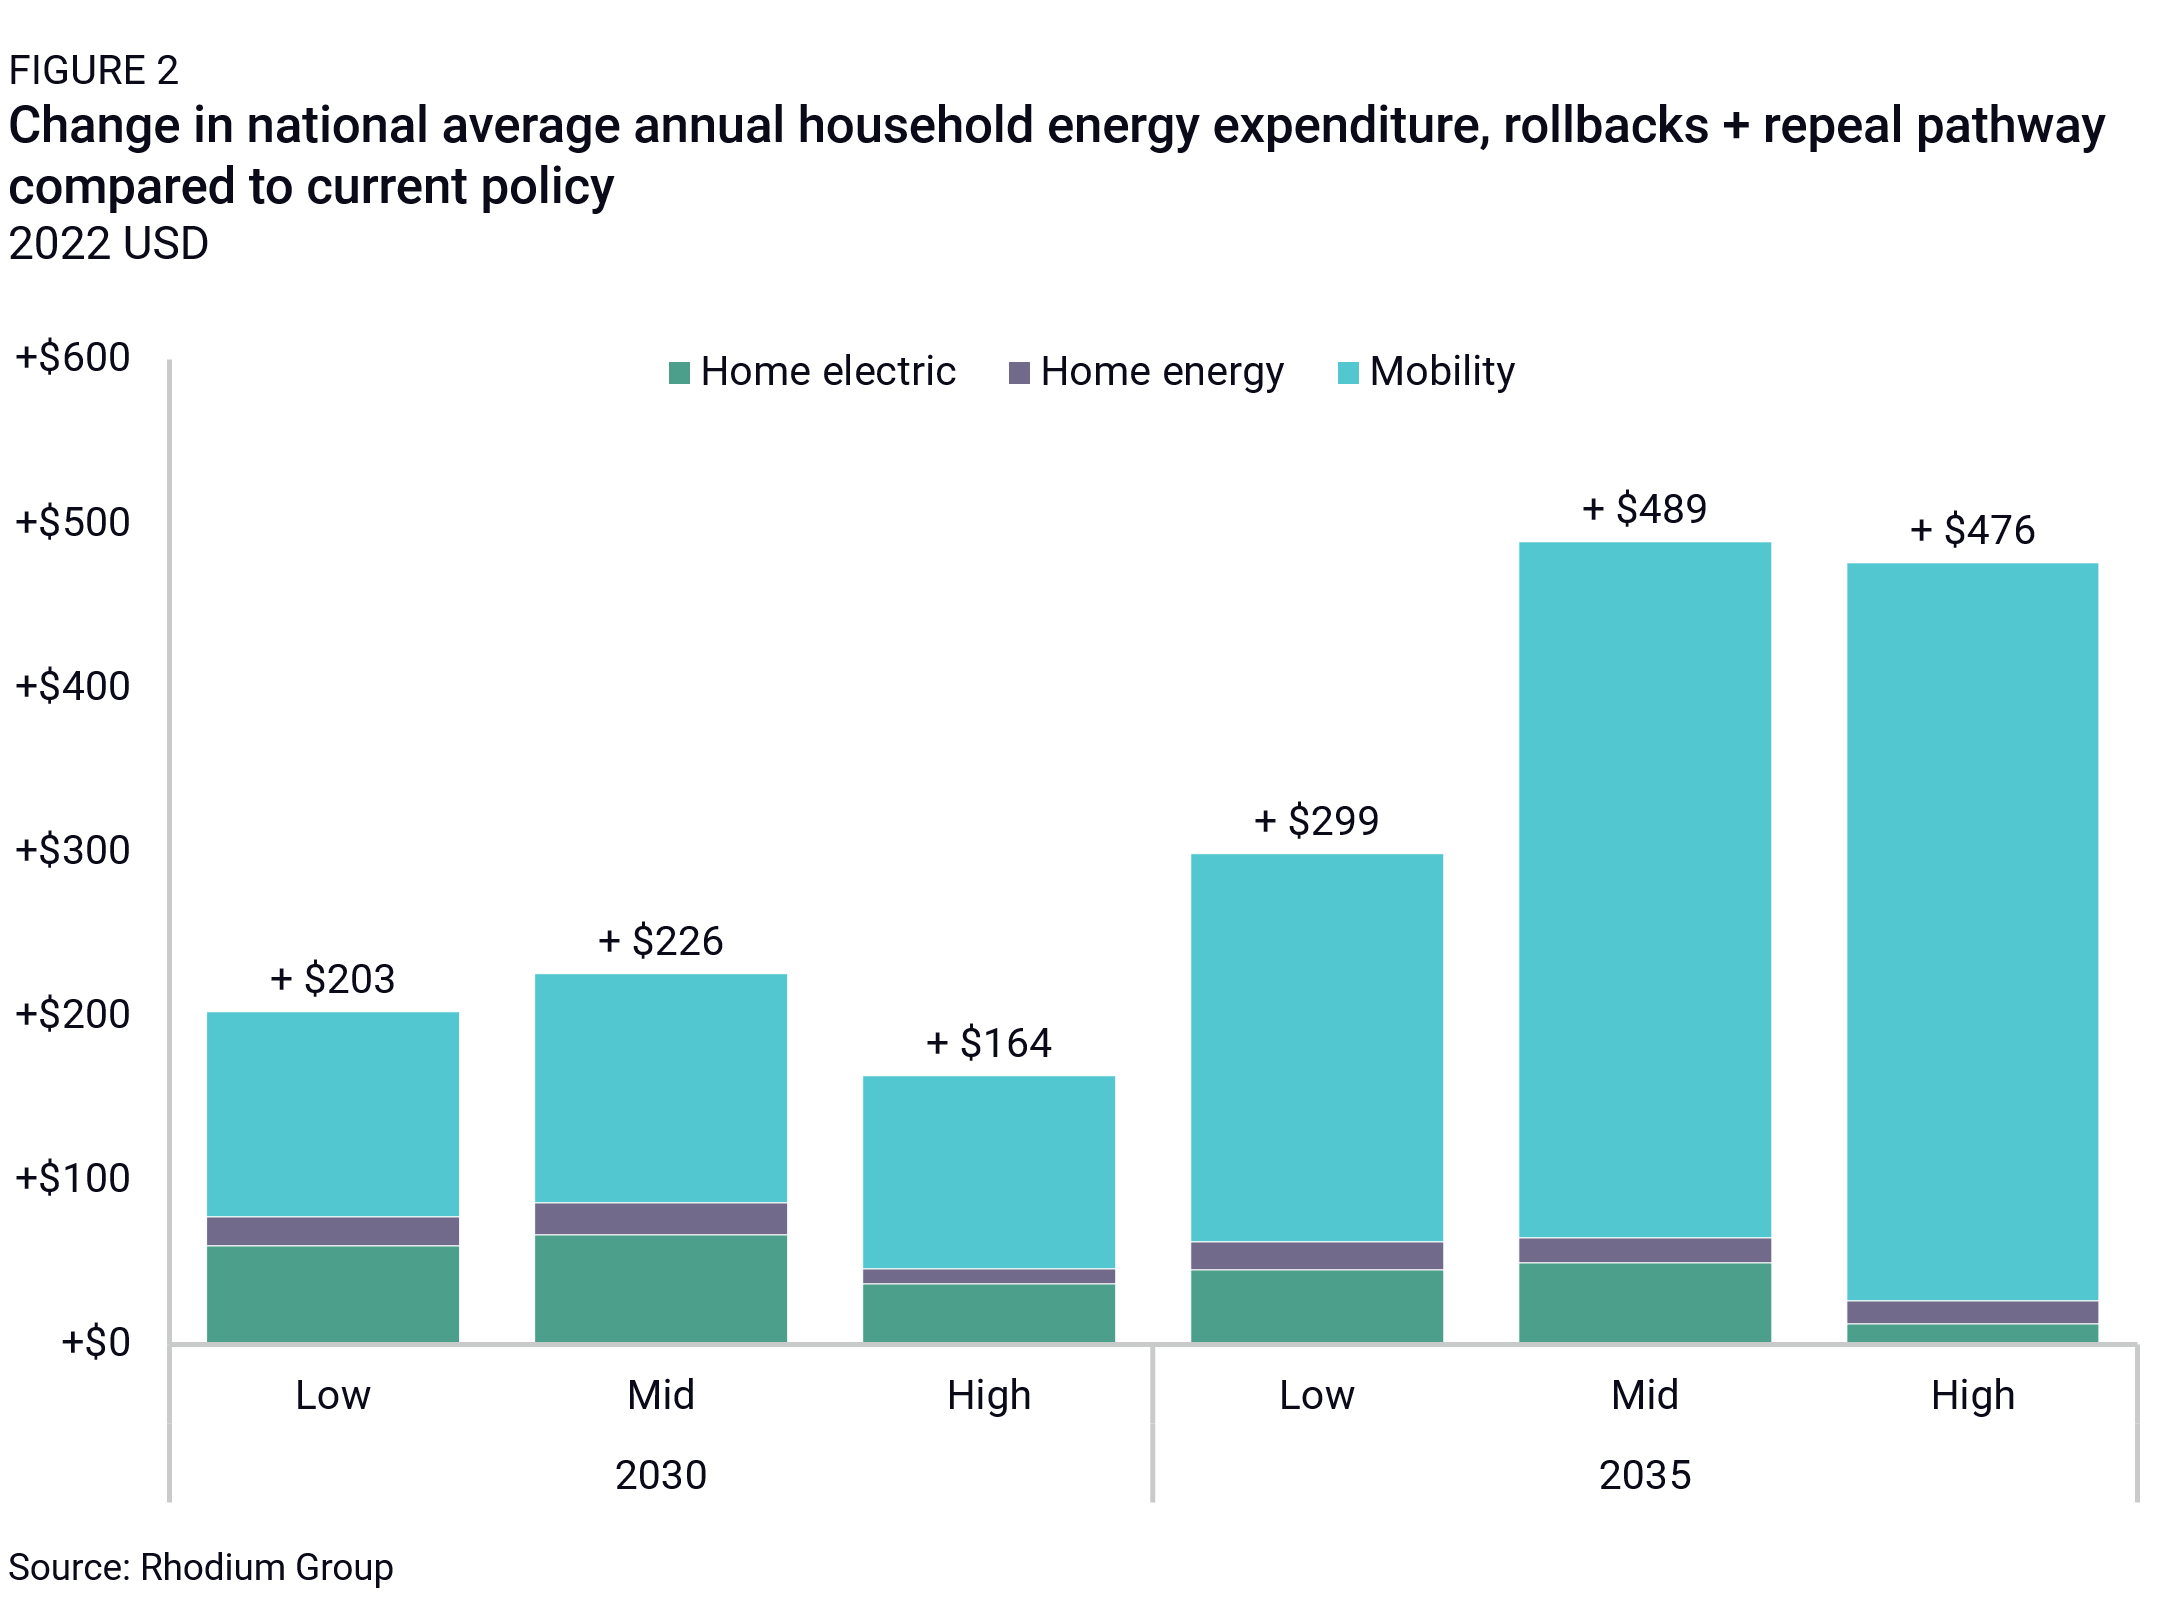
The impacts on expenditures are driven by a few factors. The biggest increase in energy bills comes from higher mobility expenditures, including transportation fuels, such as gasoline and diesel, and electricity used to charge electric vehicles (EVs). Together, these categories represent 79-94% of all expenditure increases in 2035 (Figure 2). This growth is caused by two dynamics. First, the removal of tax credits for consumers to purchase EVs paired with the removal of regulations driving producers to sell more EVs leads to fewer EVs on the road overall. In 2035, there are 17-52 million fewer light-duty EVs on the road under the rollbacks + repeal pathway relative to current policy—a decrease of 20-67%. Internal combustion engines generally have higher fuel costs compared to EVs, contributing to higher bills. Second, more demand for gasoline owing to fewer EVs on the road drives prices at the pump higher for all consumers. We unpack this dynamic further below.
Home electric bills and household heating expenditures—such as those for natural gas and fuel oil—also increase under the rollbacks + repeal pathway due to shifting price dynamics. In the power sector, average retail electricity rates across the economy increase by 2-6% by 2035 compared to current policy (Figure 3). This rise stems from the removal of energy tax provisions, which makes it more expensive to meet electric demand, in particular, because we estimate that demand will grow by 24-29% over the next decade—a sharp acceleration compared to the modest growth of the past couple of decades.
Residential-specific electric rates follow a similar trend at a smaller magnitude, increasing by 3% in the low and mid emissions scenarios and staying flat in the high emissions scenario. Conversely, industrial electric rates face steeper increases, rising by 3-9% in 2035. The impact of the rollbacks + repeal pathway is more pronounced in the low and mid emissions scenarios, as the higher natural gas price assumptions amplify cost increases. By contrast, in the high emissions scenario with its bargain-basement gas prices, rate increases are smaller. Importantly, policy decisions themselves influence these fuel price dynamics, as we unpack further below.
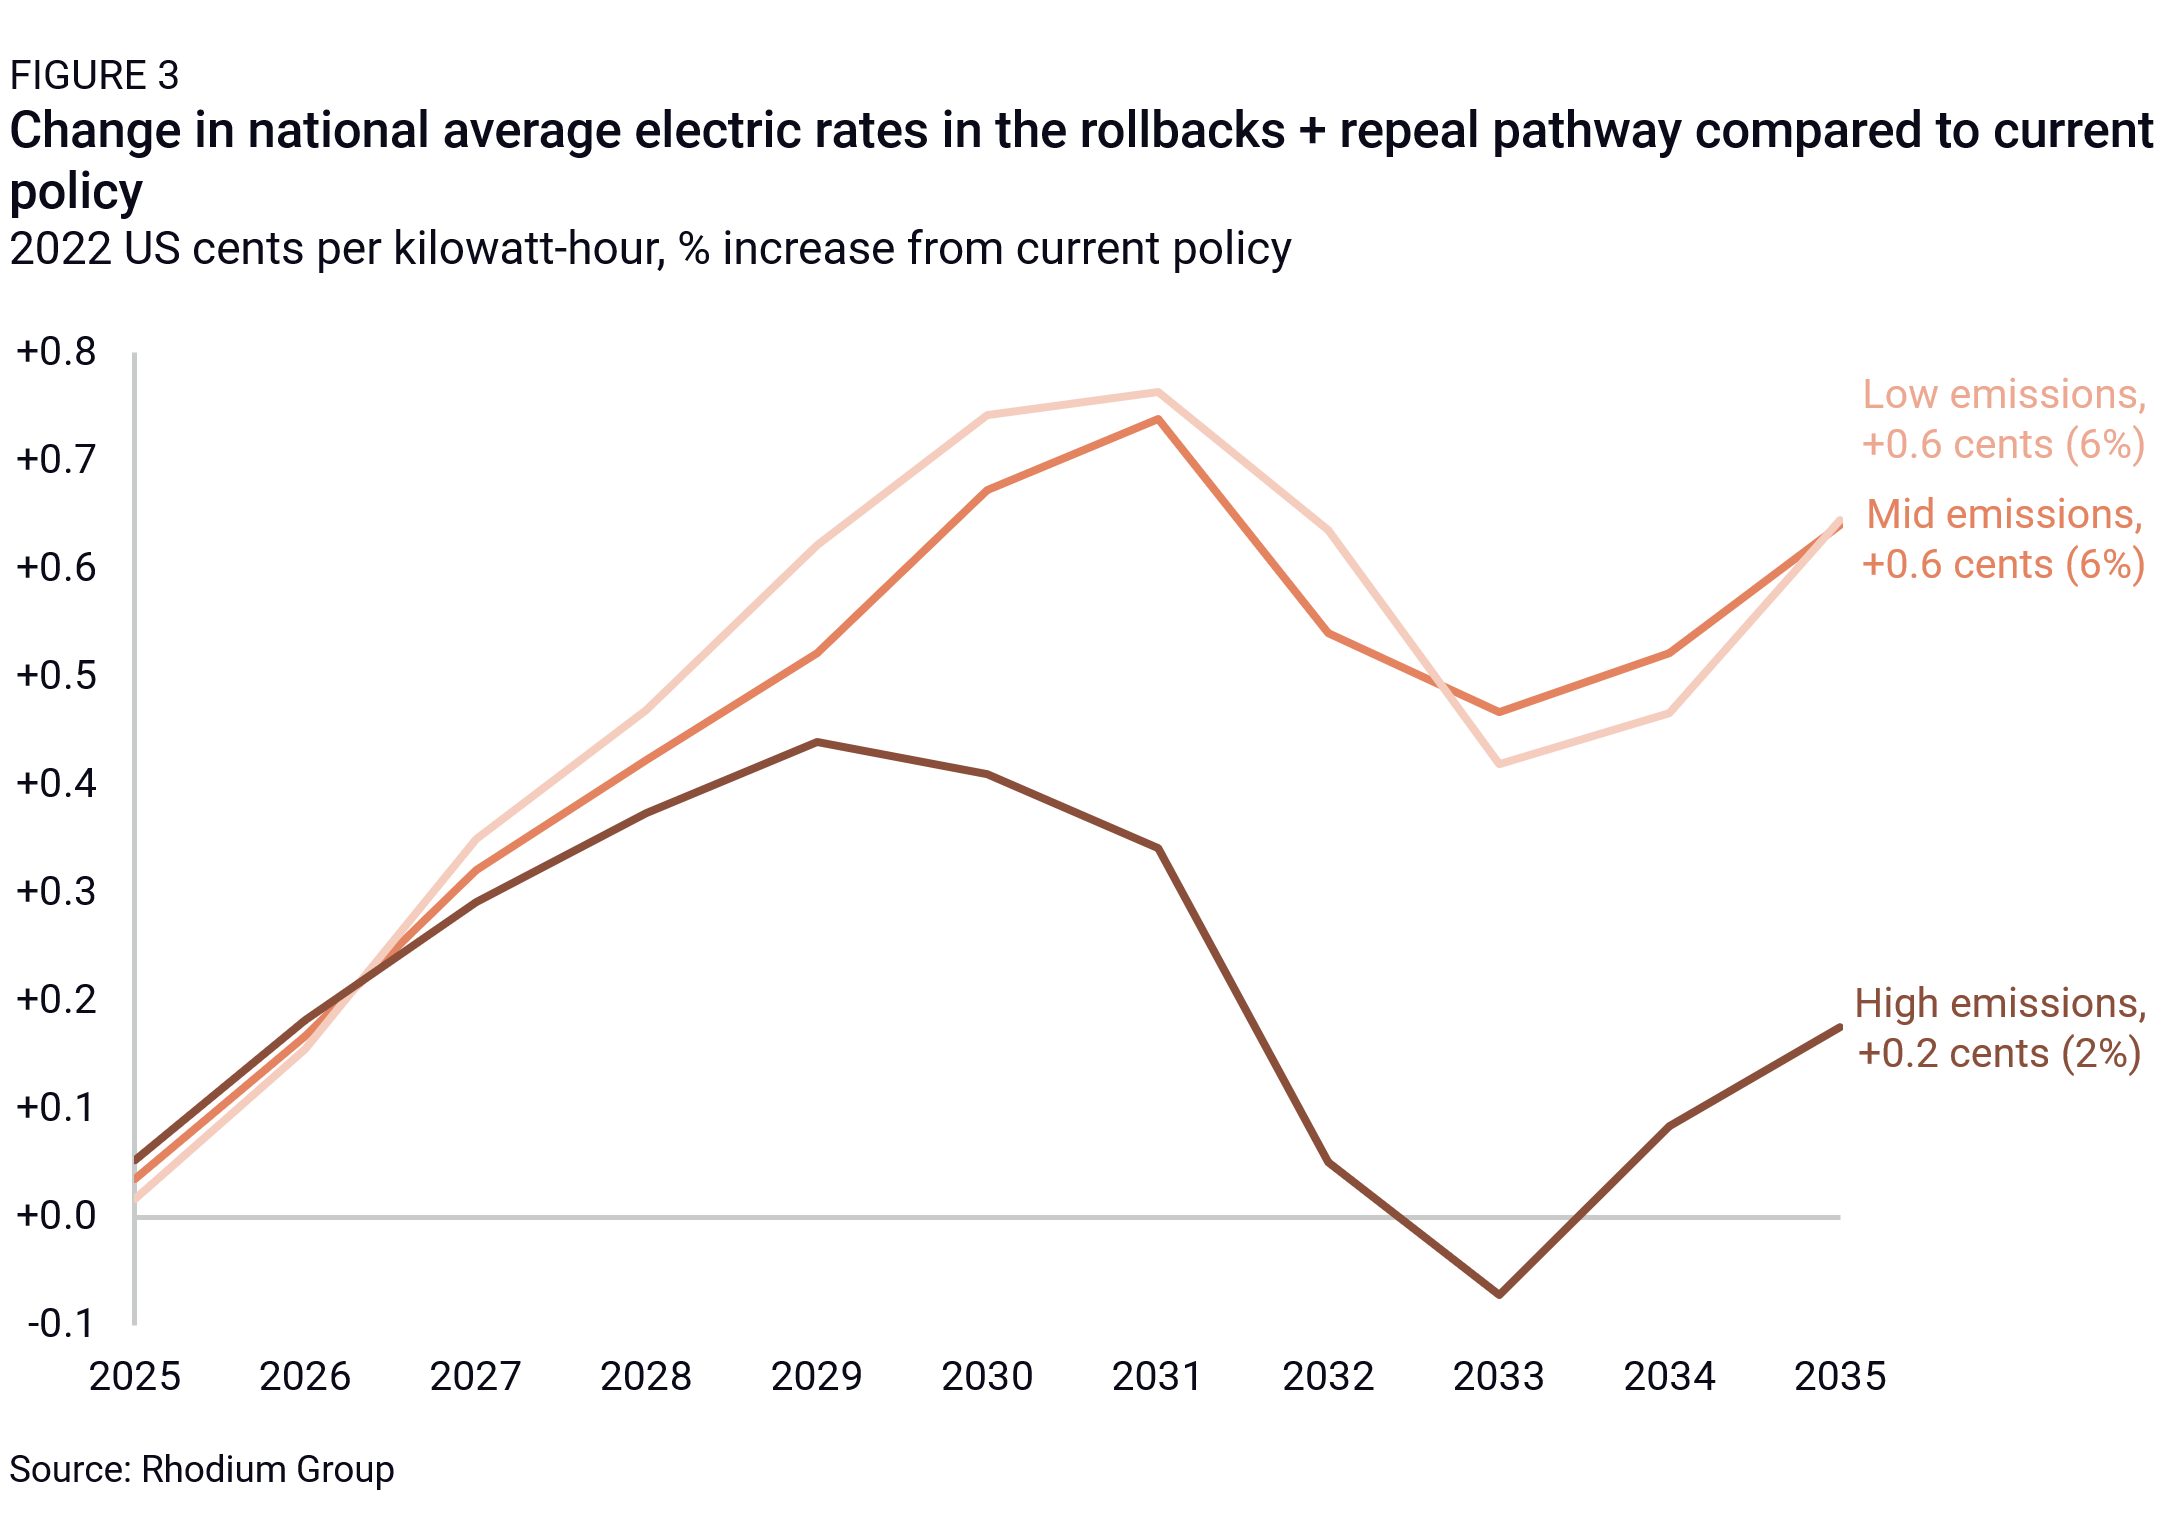
It’s instructive to consider the impacts of these policy decisions over time. Rate increases peak in 2030, before the most impactful deadlines for EPA regulations on power sector emissions. By 2035, the regulatory rollback reduces some costs, as coal plants avoid the need to demonstrate an emissions rate consistent with a 90% carbon capture standard. Rolling back those regulations results in modestly lower electric rates (1-3%) compared to current policy. However, when paired with repeal of the tax credits, these savings reverse, driving rate increases back to 2-6% above current policy projections.
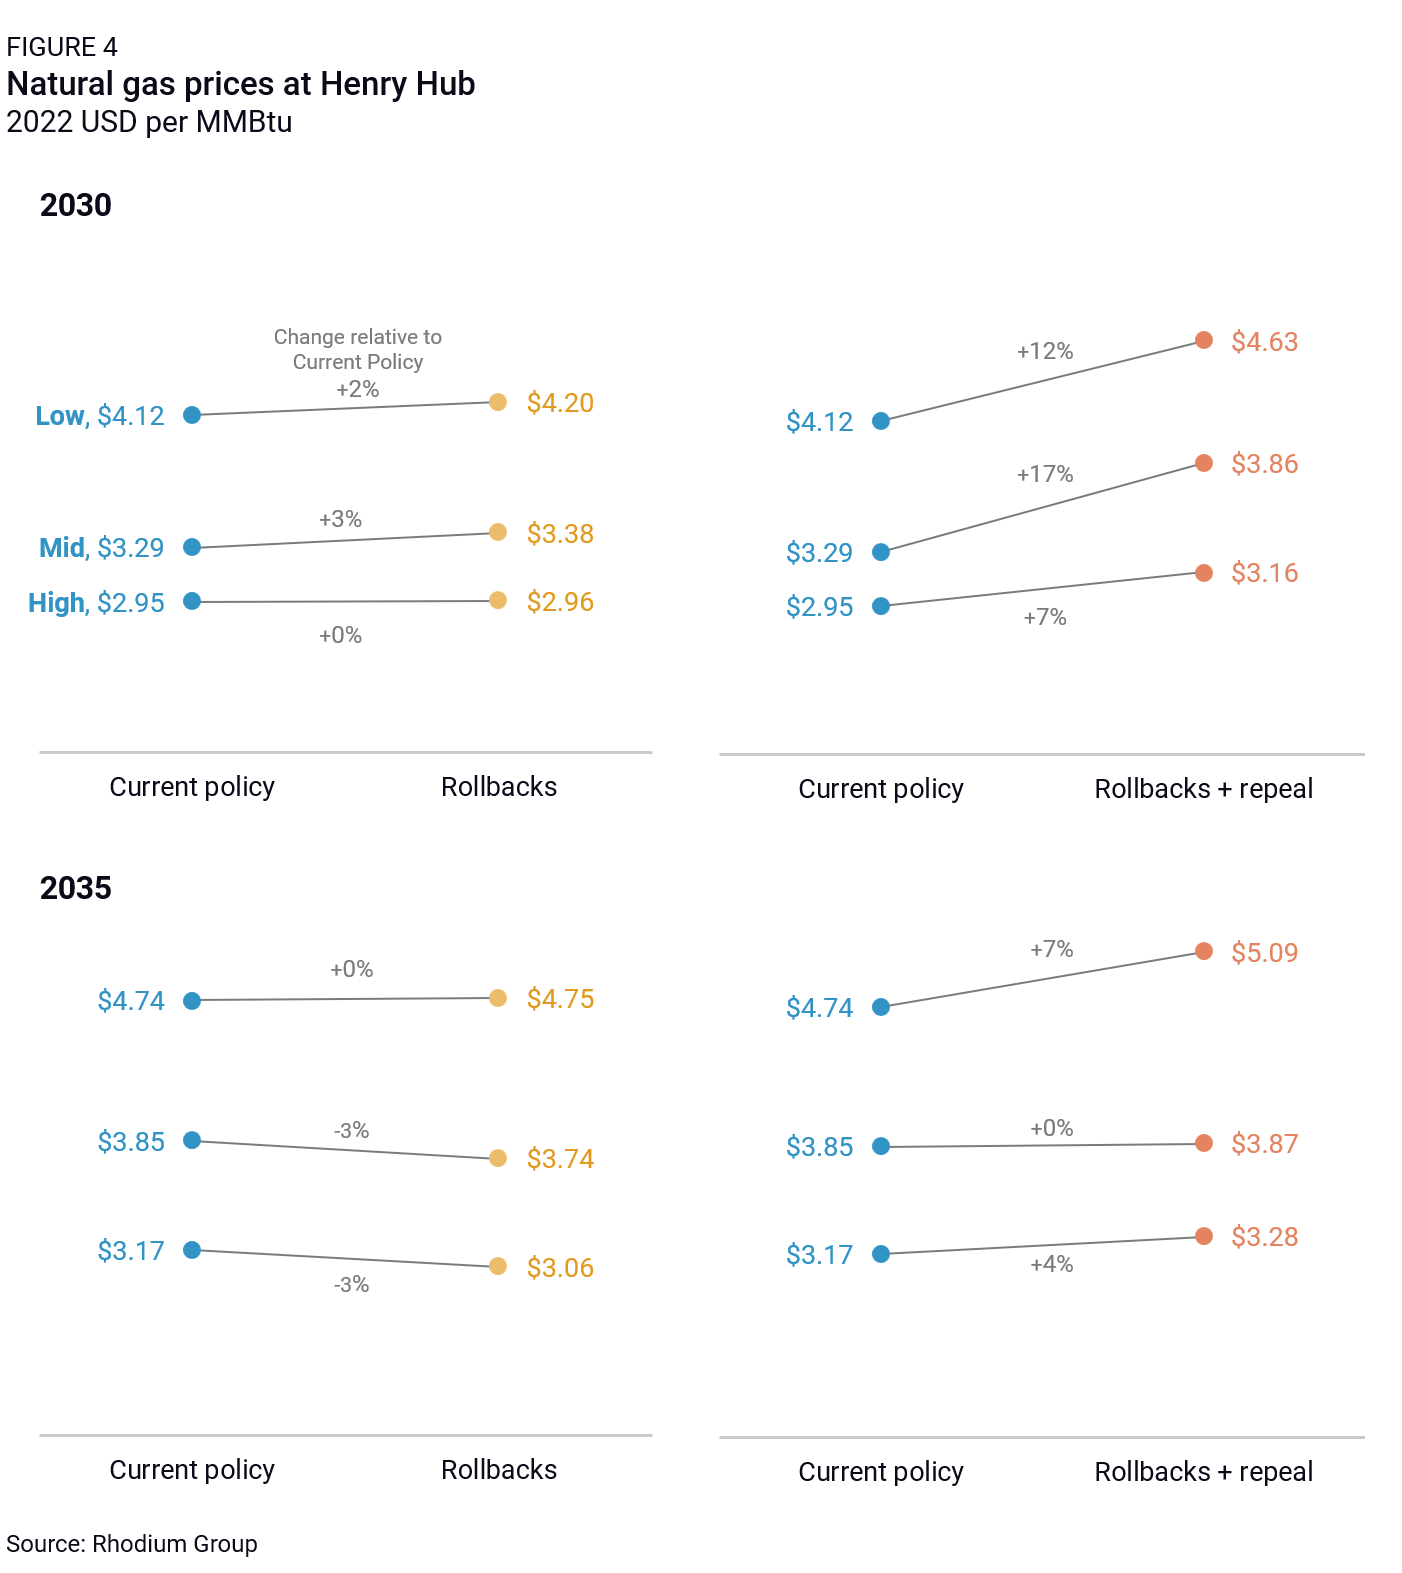
Policy changes in the power sector reverberate beyond electric rates, impacting natural gas demand and pricing. In 2035, demand for natural gas from the power sector increases by 79%, 26%, and 10% in the low, mid, and high emissions scenarios, respectively, under the rollbacks + repeal pathway compared to current policy. Higher demand drives new US production but also leads to a 4-7% increase in the Henry Hub price for gas (Figure 4). Notably, the rollbacks pathway alone has a more muted effect, with gas prices staying flat or slightly declining compared to current policy due to reduced natural gas demand.
Gasoline price dynamics are more straightforward. Under the rollbacks + repeal pathway, retail gasoline prices are 6-15% higher in 2035 compared to current policy. This translates to a $0.20 to $0.37 per gallon increase in 2035, equivalent to more than doubling or even tripling the federal gas tax. Prices at the pump rise steadily over time compared to current policy. Without robust EV adoption to offset traditional fuel consumption, gasoline demand continues to increase, driving higher prices at the pump.
An increase in reliance on imported crude oil
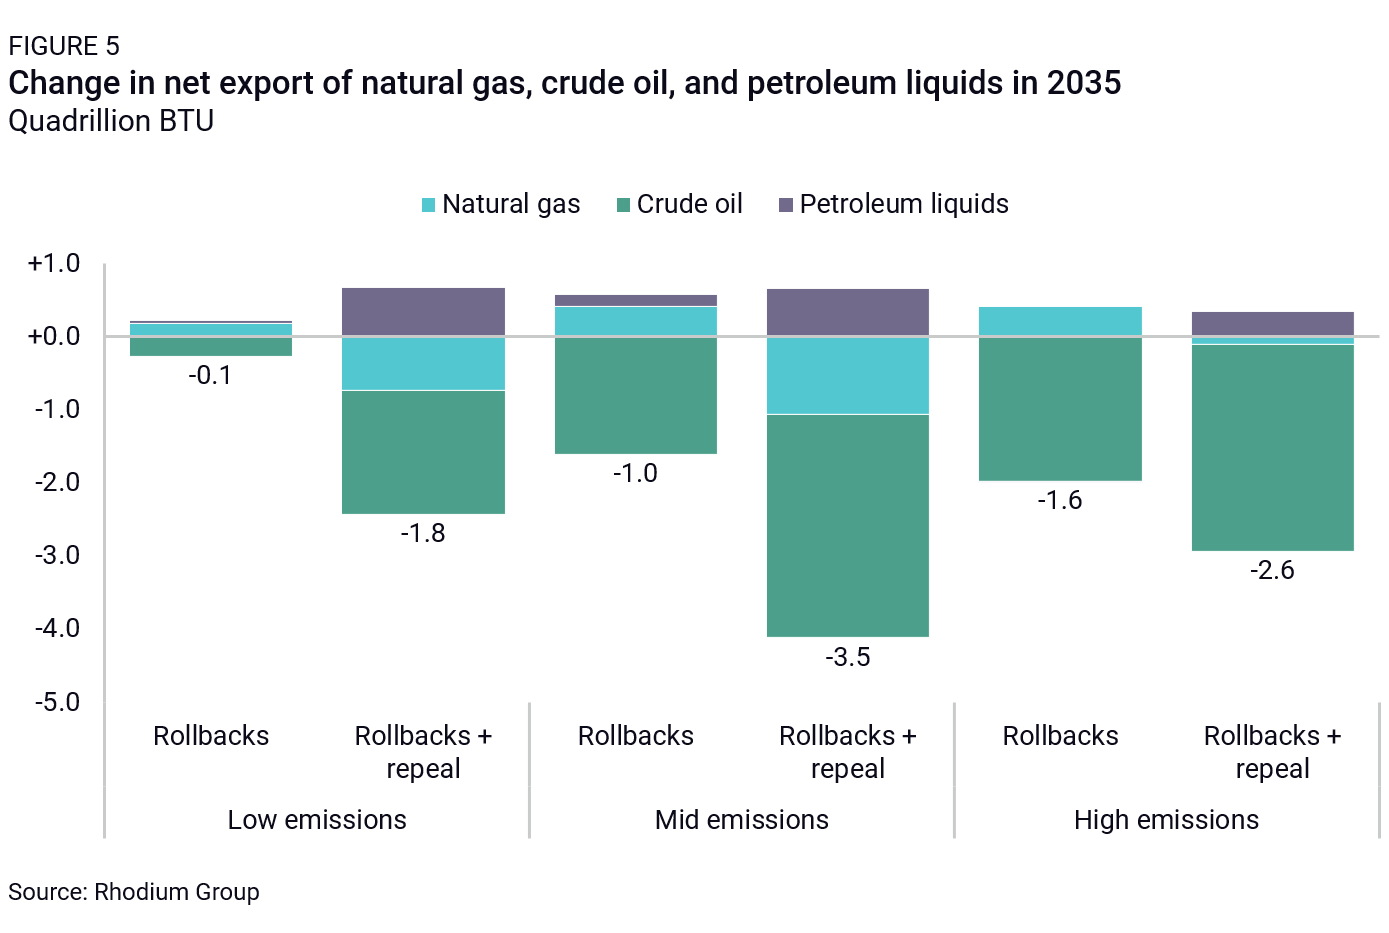
Increasing domestic demand for fossil fuels results in lower net exports of natural gas, crude oil, and petroleum liquids. In 2035, net exports of these fuels decreased by 1.8 to 3.5 quads (9-20%) under the rollbacks + repeal pathway relative to current policy (Figure 5). The biggest shifts come from crude oil, which reflects a meaningful increase in reliance on foreign imports of 0.5-1.1 million barrels per day (7-31%). Crude oil competes in a market with prices set globally, and it’s often cheaper for the US to meet additional demand through imports—especially for the types of crude that match domestic refinery configurations and locations.
The story is a bit different for natural gas, as increased domestic demand is primarily met by higher domestic production. Changes in net export levels for gas are largely driven by a 13-16% increase in demand for pipeline imports from Canada in the rollbacks + repeal pathway relative to current policy, and 5-9% lower liquified natural gas (LNG) exports in the low and mid scenarios, respectively. LNG exports stay flat in the high scenario.
GHG emissions reductions slow down and may stall out
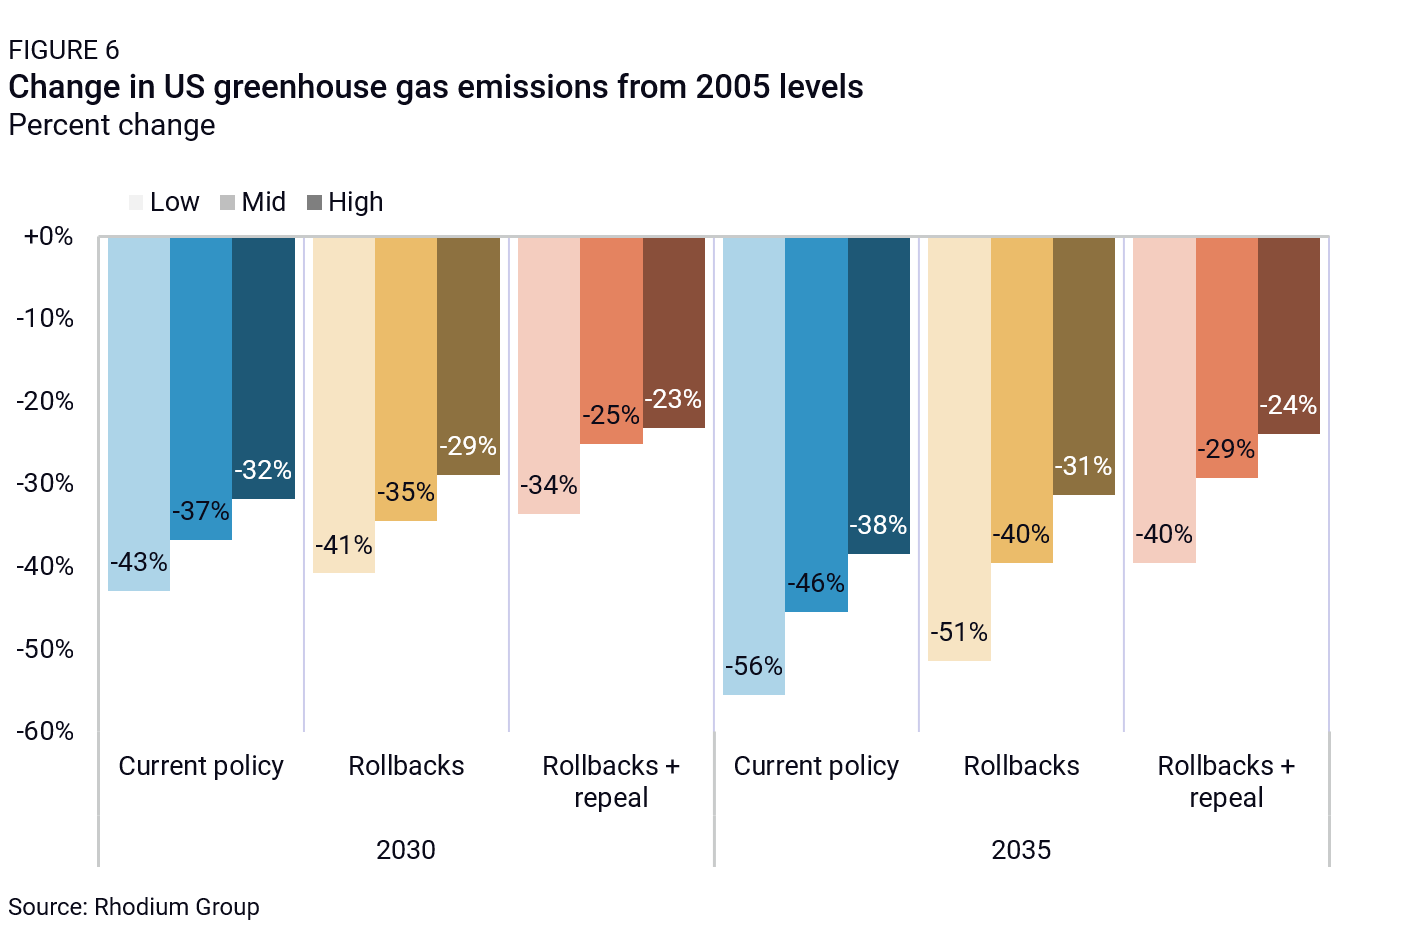
Rolling back executive actions and repealing the IRA significantly increases US economywide GHG emissions. Under current policy, the US is on track for a 38-56% reduction in GHG emissions below 2005 levels in 2035. However, our rollbacks + repeal pathway results in roughly 1 gigaton more emissions in 2035 in each emissions scenario, reducing the US emissions decline to 24-40% below 2005 levels (Figure 6). A 24% reduction is roughly equivalent to US emissions in 2020 during COVID restrictions and signals the possibility of stagnation in decarbonization efforts over the next decade.
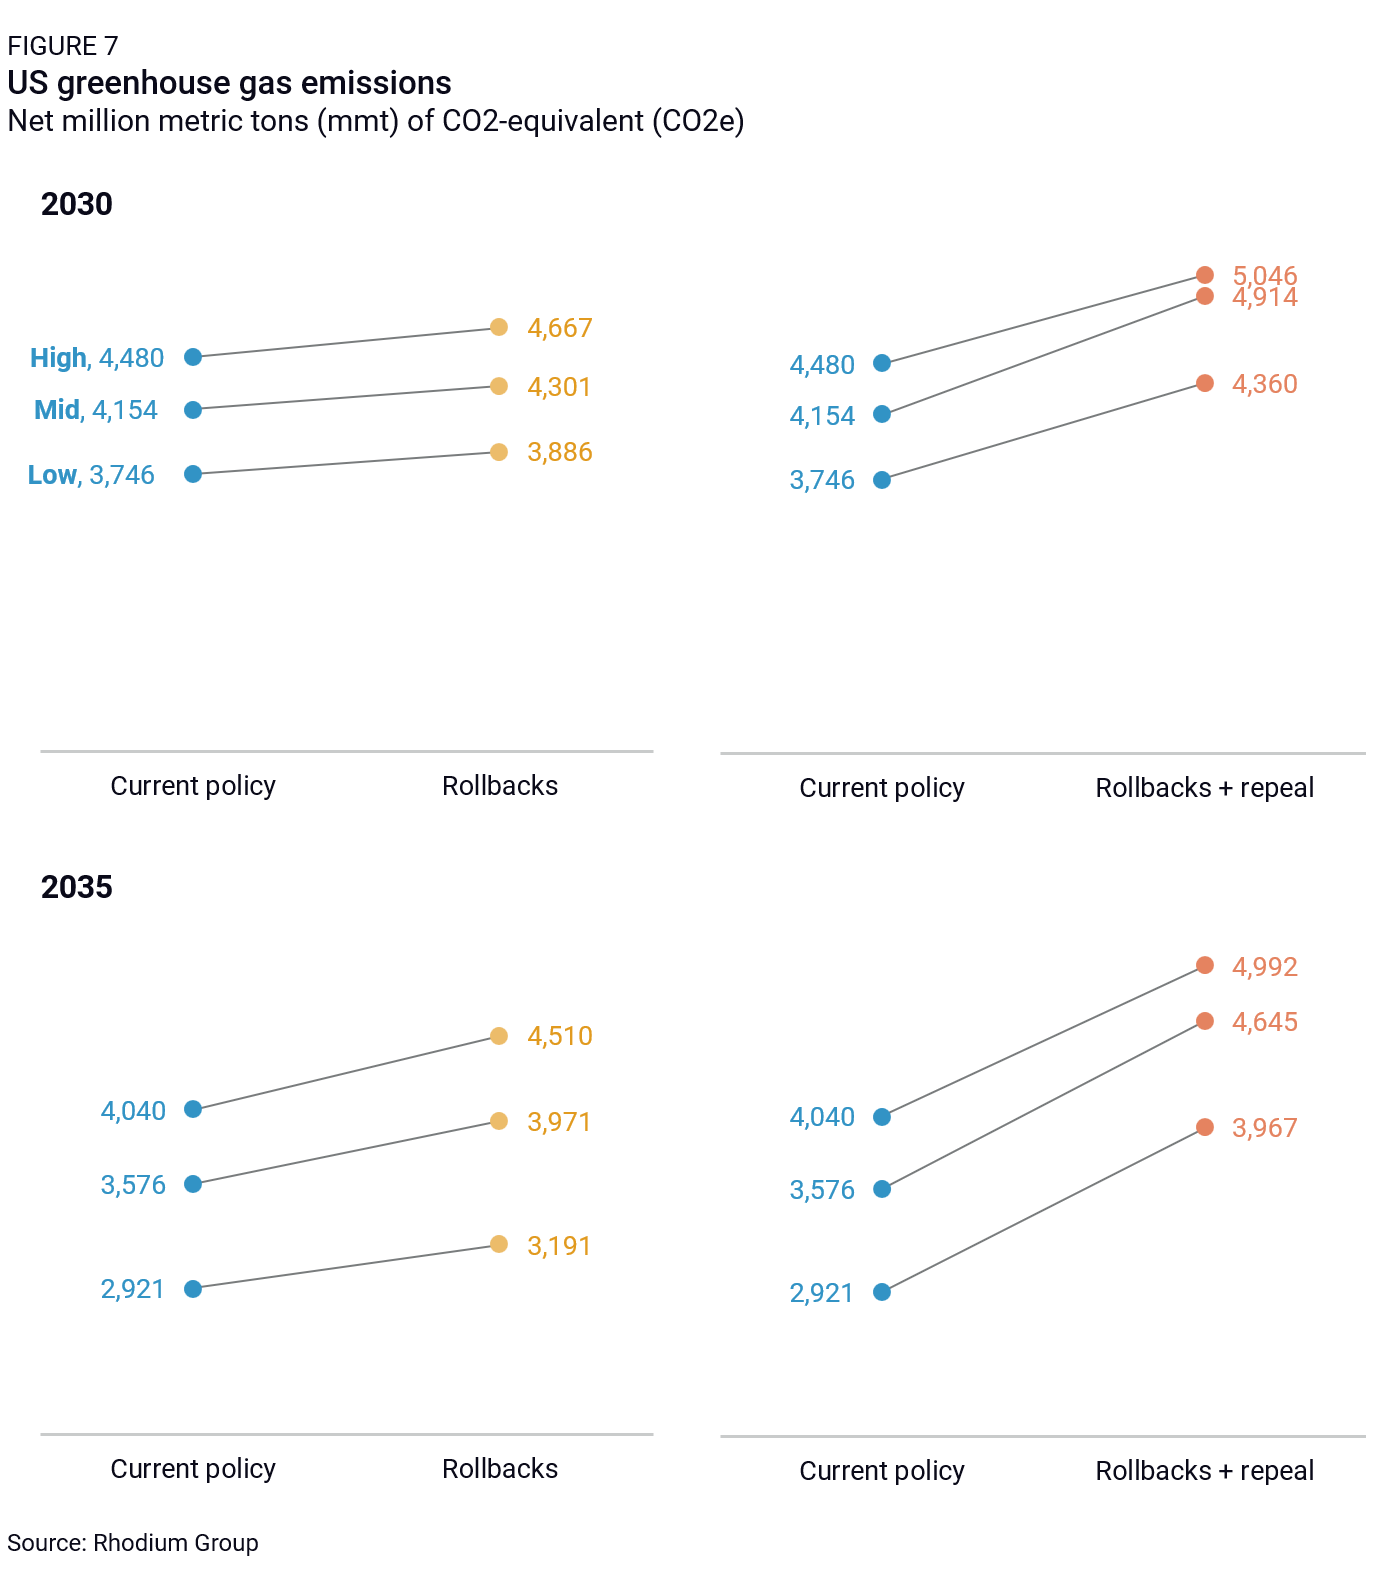
Rolling back regulations alone leads to a 270-470 MMT increase in emissions by 2035—representing 25-50% of the total emissions increase under the full rollbacks + repeal pathway (Figure 7).
The power sector is the largest driver of emissions increases in the rollbacks + repeal pathway compared to current policy, driving 53-59% of the overall increase. Without EPA’s Section 111 regulations in place, significant coal capacity remains on the grid. Combined with the repeal of energy tax incentives, coal retirements are more than halved by 2035 relative to current policy. Clean energy deployment also slows sharply, with solar capacity reduced by more than half and wind installations dropping by 37-44%. In place of these clean resources, natural gas surges, with its share of generation increasing from 9-35% under current policy to 20-45% under the rollbacks + repeal pathway. Beyond the power sector, the transportation and industrial sectors also contribute to emissions growth, each accounting for 10-20% of the increase relative to current policy by 2035, depending on the emissions scenario.
Uncertainty for clean energy investments
Clean energy and transportation investment in the US has been on a historic and sustained growth path over the past three years since the passage of laws focused on climate and manufacturing including the IRA, the IIJA, and the CHIPS and Science Act. The Clean Investment Monitor, a project jointly managed by Rhodium Group and MIT’s Center for Energy and Environmental Policy Research, tracked private and public clean investment reaching a new high of $71 billion in the third quarter of 2024, accounting for 5% of total US private investment in structures equipment and durable consumer goods.
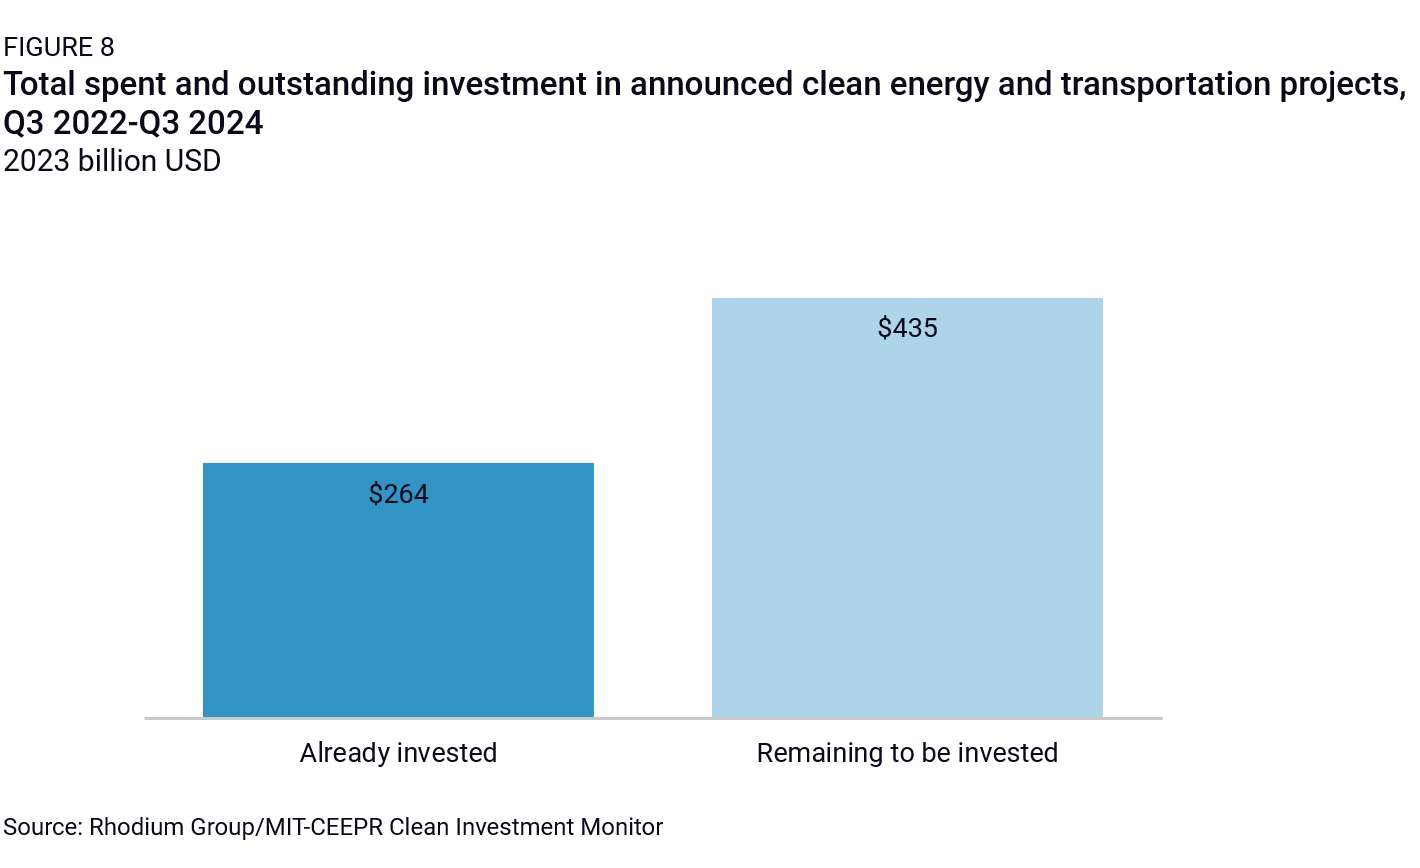
Since the third quarter of 2022, when the last of these three major bills passed, total investment (both public and private) in clean technology manufacturing, utility-scale clean energy, and industrial decarbonization projects has totaled $264 billion (Figure 8). An additional $435 billion worth of investment in these categories has been announced but remains unspent, including money left to be invested in projects already under construction and announced projects that haven’t yet broken ground. Changes to the manufacturing and energy tax credits supporting these projects, or even the uncertainty that these policies may change could put at least some of these unspent investments at risk of disappearing.
Are there opportunities for speed and innovation?
While the fate of many policies currently on the books is uncertain, history suggests opportunities will likely emerge for new policies, reforms, and investments in a Republican-controlled Congress. Key areas for potential bipartisan agreement include permitting reform that accelerates construction of energy projects and infrastructure of all kinds, or trade measures that address embedded carbon in imported and exported products. We see early signs of opportunity in both spaces. The fate of the bipartisan Energy Permitting Reform Act, sponsored by Senators Joe Manchin (I-WV) and John Barrasso (R-WY), remains uncertain at the time of writing. But if it’s not passed this Congress, the bill represents a potential starting point for further conversation once the new Congress convenes in January. Likewise, Senator Bill Cassidy (R-LA) has been working to drum up support on both sides of the aisle for his Foreign Pollution Fee Act, which would implement a fee on key imported goods based on the carbon intensity of their production.
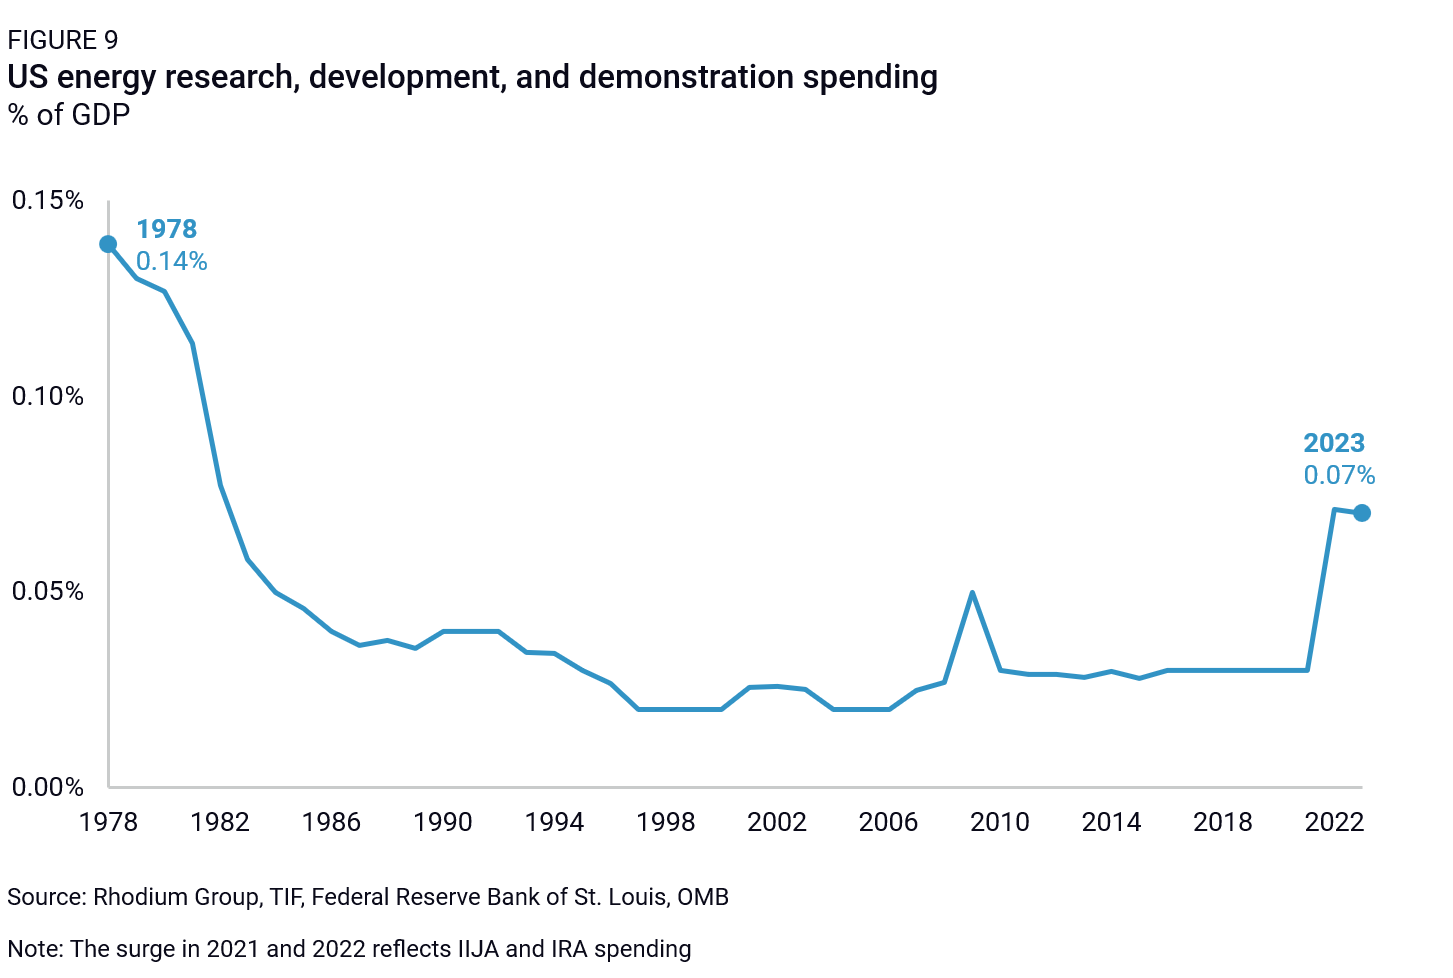
Another potentially fruitful area for progress is in supporting innovation of the next generation of clean technologies. Traditionally, investment in energy research, development, and demonstration (RD&D) is an area where the interests of both parties overlap. Indeed, the bipartisan IIJA passed early in President Biden’s term marked one of the single largest increases in federal RD&D spending ever. Despite this, the US spends far less than its developed country peers on energy innovation, ranking 19th among OECD countries in energy RD&D spending as a share of GDP—just behind Ireland. As a share of GDP, the US currently spends half as much as it did during the energy crisis of the 1970s (Figure 9).
To enhance its global competitiveness in emerging and impactful climate technologies—such as next-generation geothermal, advanced conductors, advanced nuclear, fusion, thermal batteries, and advanced storage—the US has plenty of opportunities for federal investment. The authors of the IIJA recognized that scaling new energy technologies requires more than applied R&D investment. They emphasized the need for funding large-scale demonstration projects and early deployment assistance, providing a clear runway for these technologies to achieve takeoff. Sustained and expanded investment will be critical to scaling breakthrough technologies, expanding the decarbonization solution set, and enhancing US innovation and competitiveness.
While much of the current policy framework could be altered or repealed in the next Congress, opportunities remain for new leadership on energy innovation. By prioritizing these areas of bipartisan support, the US can build on the foundation of prior clean energy and advanced technology investments.