Quantifying Federal Investments in Advancing Energy Innovation
Using our newly developed Federal Investments in Energy Innovation database, we can, for the first time, observe what US public funding for research, development, demonstration, and deployment looks like by technology and stage.
Technological innovation is essential if the US is to achieve long-term energy leadership by capturing a broader share of the global energy market, particularly the clean energy market. US federal spending on research, development, demonstration, and deployment (RDD&D) has been a driver of innovation and contributed to the proliferation of the wide range of clean energy technologies we see today. Federal energy innovation spending has been declining as a share of GDP since the late 1970s, but in recent years, we have begun to see a slight reversal of this trend following the passage of the Infrastructure Investment and Jobs Act (IIJA) of 2021 and the Inflation Reduction Act (IRA) of 2022. Both laws added substantial amounts of funding to the US Department of Energy’s energy innovation portfolio. Using our newly developed Federal Investments in Energy Innovation database, we can, for the first time, observe what US public funding for research, development, demonstration, and deployment looks like by technology and stage of the innovation process.
We find that over the last three years, the IIJA and IRA provided a one-time increase in the Department of Energy’s total innovation budget of $85 billion, more than five times the sum of annual congressional funding over the same period. Most of the funding ($82 billion) supports demonstration and deployment activities, which is a major shift from historical trends. We also find that much of the funding supports technologies associated with grid infrastructure, building efficiency, and nuclear fission technologies. Equipped with this data, policymakers can make strategic decisions about where to prioritize and sustain future investments at the Department of Energy to drive innovation in the areas where it’s most beneficial. In future Rhodium Group work, we will quantify the needed levels of investment to achieve commercial deployment of a suite of clean technologies, using this historical data as a jumping-off point.
Pursuing US energy leadership through energy technology innovation
Since taking office on January 20th, the Trump administration has been aggressively launching their energy policy agenda focused on boosting domestic energy production and “restoring American energy dominance.” Their efforts include an executive order issued on February 14th, 2025, establishing the National Energy Dominance Council. The council is tasked with advising the administration on potential strategies for making the US more energy dominant through the utilization of more fossil fuels, biofuels, nuclear energy, and geothermal heat. In support of this agenda, newly appointed Secretary of Energy Chris Wright recently established a series of priority actions for the Department of Energy (DOE), which include realigning department resources in support of driving innovation in “secure” energy technologies like advanced nuclear, advanced geothermal energy, and hydropower. All-in-all, this administration believes that restoring US energy dominance is critical to helping curb rising energy costs, creating more jobs, and reducing US reliance on foreign energy, all the while providing the country with even greater geopolitical leverage.
The truth of the matter is the US is already dominant in the fossil fuel space. It is the world’s leading producer of both oil and natural gas, spurred by the US “shale revolution,” which began nearly two decades ago. In 2023, the US accounted for 16% of global oil production, averaging 13.2 million barrels per day. In the same year, US natural gas production represented nearly a quarter of overall global production, followed by Russia with 14% of the global market share. Over the last couple of years, US liquified natural gas (LNG) exports have surpassed that of Australia and Qatar, now making it the world’s largest exporter of LNG.
The US also leads in the development and deployment of several clean energy technologies. Clean energy technologies are a wide range of technological solutions capable of reducing greenhouse gas (GHG) emissions and other negative environmental impacts by reducing or optimizing the use of existing natural resources. Examples of clean energy technologies include solar and wind power generation, clean fuels (e.g., biofuels), battery electric vehicles, geothermal and nuclear energy. Today, the US is the second-largest generator of both solar energy and wind energy behind China. It’s also the world’s top producer of biofuels and nuclear energy. In 2023, the US accounted for 30% of the world’s nuclear power generation. US contributions to global nuclear energy capacity have the potential to increase as the country remains positioned to lead in advanced nuclear energy innovation (e.g., generation IV and small modular reactors).
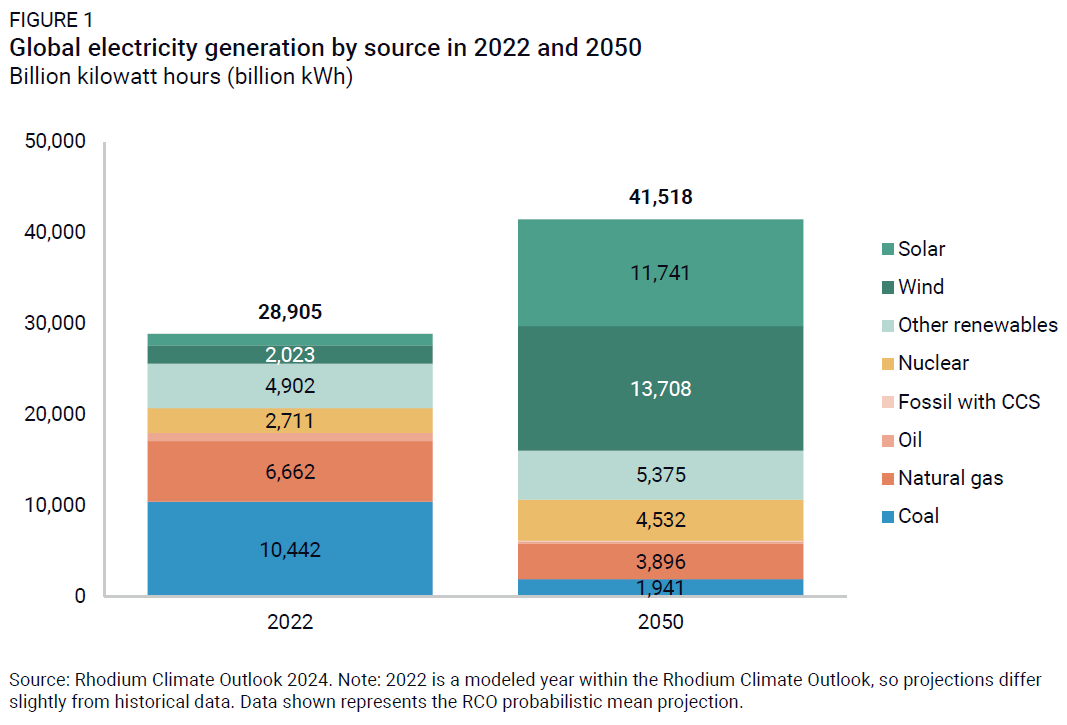
Projections of global electricity generation under the Rhodium Climate Outlook (RCO) suggest that total generation could grow by nearly 50% by 2050, largely driven by rapid growth in the use of clean sources (Figure 1). This presents a unique opportunity for the US to become more of a global energy leader by leveraging its strengths in innovation to capture a larger share of the global energy market, particularly in the clean energy space.
Investments in clean energy innovation also have economic and social impacts by driving industries and creating new growth opportunities, including boosting domestic energy security levels by expanding the use of clean energy resources and diversifying the energy mix, as well as helping to improve environmental quality. However, it is unclear as to which clean energy technologies are helpful in the pursuit of long-term US energy dominance, as well as the commercial viability of these technologies in the long run, particularly because of the uncertainty about future tech costs and other characteristics associated with these technologies. Many potential clean energy technology options are currently under development and are in the early stages of the innovation process, hence the need for further investments in innovation by both the federal government and the private sector to accelerate their movement through the innovation process and get them to market faster.
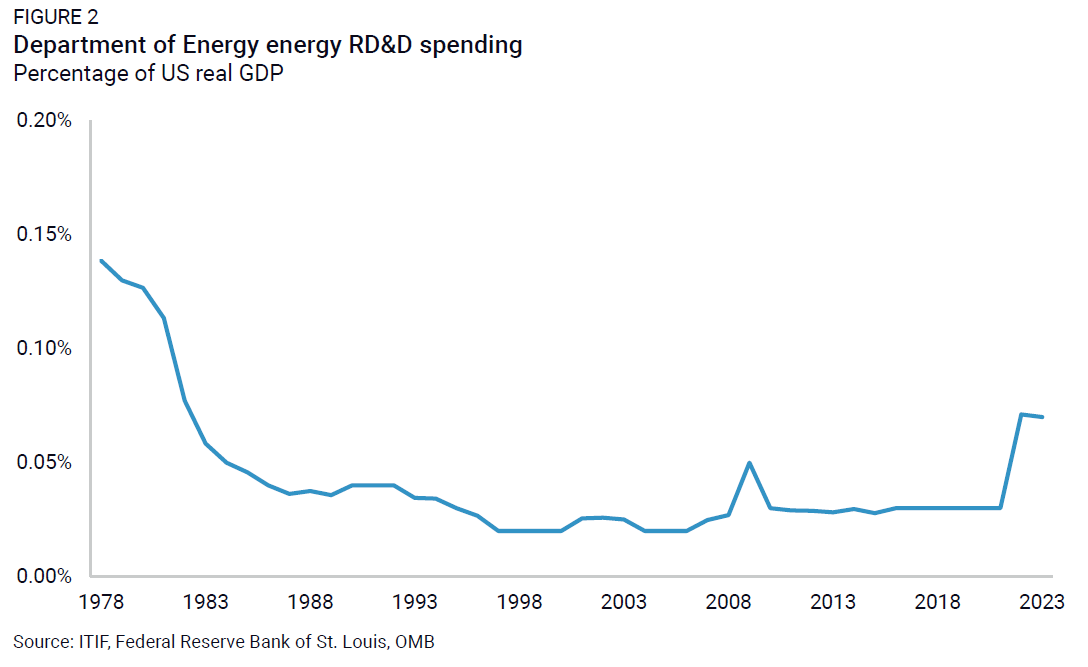
In the past, US federal support for energy innovation produced valuable advances in energy technologies, including breakthroughs in solar panels and wind energy. But over the past few decades, support for energy research, development, and demonstration (RD&D) by DOE has been declining from 0.14% in 1979 to 0.07% of US real GDP in 2023 (Figure 2).1 In 2009, Congress attempted to help address this funding gap by passing the American Recovery and Reinvestment Act (ARRA). ARRA supplied more than $80 billion in funding for clean energy innovation and was the largest single investment in clean energy technologies in history at that time. But despite this transformative surge in funding, subsequent annual congressional appropriations were significantly lower and remained relatively flat over the next decade.
More recent efforts to address the issue of insufficient funding include the passage of both the Infrastructure Investment and Jobs Act of 2021 (IIJA) and the Inflation Reduction Act of 2022 (IRA). Combined, this legislation provided the largest federal investment in clean energy innovation in US history. Like ARRA, they, too, delivered one-time increases in funding, though the nearly $750 billion investment is more than eight times the size of ARRA (~$90 billion).2 However, getting many of these technologies over the finish line to help drive economic competitiveness, improve energy security, and sustain emissions reductions requires Congress to sustain significant funding through the annual appropriations process.
The US does not spend nearly as much on energy innovation as it does on other research areas. For example, federal R&D spending in the defense sector totaled nearly $58 billion in 2018, while federal R&D investment in the energy sector that year was less than a fifth of that amount, at just under $10 billion. Federal support was also much higher for the health sector R&D compared to energy-related investments by a factor of almost four.
To understand where the US stands on public sector support for clean energy innovation, we need quality data to characterize the full landscape of federal investments in clean energy innovation. To address this need, we developed the Federal Investments in Energy Innovation (FIEI) database, which tracks recent DOE-enacted spending levels for clean energy innovation by technology type and innovation stage. These spending estimates are based solely on congressionally appropriated dollars, and not the fiscal impacts associated with these investments.
In this note, we leverage our FIEI database to assess recent federal investments in energy innovation across DOE’s portfolio of programs, shedding some light on current federal priorities for technology development and deployment. We begin by discussing the different stages of the clean energy innovation process. We then describe the roles of both the federal government and the private sector as they relate to supporting clean energy innovation in the US. Lastly, we explain our approach to developing the FIEI database and provide a comprehensive snapshot of recent DOE spending on clean energy innovation.
The clean energy innovation process
The clean energy innovation process refers to the uncertain and competitive process that underlies the development and implementation of new clean energy technologies. Though we identify the key stages below, this process is generally iterative and nonlinear in nature as it involves rounds of developing, testing, analyzing, and improving new technological solutions based on findings from the previous round. Technology developers leverage knowledge gained from each iteration to update design modifications and adjust in subsequent iterations.
We estimate clean energy innovation funding in our FIEI database based on congressional appropriations to DOE and categorize the stage of innovation that funding targets into four main categories: research and development, demonstration, and deployment (collectively RDD&D), as well as any relevant program activities associated with commercialization support.
Research and development
Research activities focus on understanding the basic underlying scientific principles for a given topic and applying the newly gained knowledge to identify and conceptualize a new clean energy technological solution.
The research stage covers basic and applied research. Basic research focuses on gaining fundamental knowledge about a specific topic before considering practical applications. Applied research focuses on using the newly gained knowledge to develop practical solutions. Because we are tracking funding to identified technological solutions, we only consider appropriated dollars supporting applied research.
In the development stage, researchers construct and test a prototype of the new technology within a laboratory environment following the validation of the conceptual design developed during the research stage.
Demonstration
The demonstration stage involves taking the new prototype beyond the lab, testing out versions of the new technology at less than the intended final full size in real-world conditions for the purpose of addressing any remaining challenges or technical issues that potentially threaten its commercial viability.
In the demonstration stage, pilot-scale projects are meant to mimic commercial operations but at a much smaller scale. They serve as a technology proof-of-concept and are used to assess technology scalability, collect data, and identify potential issues and corresponding solutions under highly controlled settings. Demonstration-scale projects, also known as “first-of-a-kind” projects, are generally larger than pilots and closer to commercial scale. They are implemented and tested under real-world operating conditions to prove commercial and technical viability, as well as inform how the technology can be replicated at a commercial scale.
Deployment
After the technology has been meaningfully derisked, it is implemented by a small group of early adopters on a limited scale. Possible future redesigns will occur if ongoing evaluations of the technology during this stage reveal the need to do so.
Following early adopter success, the technology reaches market maturity, being available to a broader market and implemented by a wider audience.
Commercialization support
Besides successful completion of the stages discussed above, innovation also requires adequate commercialization support, which bridges the gap between the research and development (R&D) of a new technology and widescale market adoption by helping to address both the technical and market barriers that new technological innovations face when entering the market. Commercialization support also helps facilitate access to market research analysis, technical expertise, workforce development, testing facilities, and public-private partnerships. An example of federal commercialization support is DOE’s Lab-Embedded Entrepreneurship Program (LEEP). Managed by the Office of Energy Efficiency and Renewable Energy, LEEP is a two-year paid fellowship program that helps new clean energy tech developers move their innovation to market, offering mentorship opportunities, entrepreneurship training, seed capital, and access to a network of potential customers and investors. Similarly, the DOE Technology Commercialization Fund, stewarded by DOE’s Office of Technology Transitions, provides funding to help a pipeline of innovative new clean energy technologies move from DOE’s national labs to markets.
Federal agencies like DOE rely on frameworks to evaluate key adoption barriers and highlight commercialization support needs for different technologies. For example, Technology Readiness Level (TRL) frameworks are utilized to identify many key technical barriers facing new technologies at specific points in their development. Market barrier assessments have traditionally been more difficult to do given the lack of a consistent, widely acceptable approach like that of the TRL framework. To address this need, DOE’s Office of Technology Transitions recently developed the Adoption Readiness Level (ARL) framework to complement the existing TRL framework and help with identifying key market adoption barriers. ARL assessments are based on analyzing important market-based risk factors like product-market fit, workforce availability, and supply chain readiness. When implemented together, TRL and ARL assessments help DOE and other agencies pinpoint areas where technical and market barriers will potentially impede widespread acceptance of a new technology as well as reveal the forms of commercialization support that are needed to overcome them.
Public and private roles in innovation
The primary sources of RDD&D funding are the public and the private sectors, with each playing a critical but complementary role in funding clean energy innovation.
Public sector investments, like the federal clean energy support we discuss in this paper, happen because the federal government is largely responsible for providing public goods such as clean air and water. Ongoing investment in clean energy technologies by the government is critical to adequate provisions of these types of public goods—particularly public goods that are global in nature like protecting the climate. Government investment can also “crowd in” private sector funding, leading to greater investment. The private sector, on the other hand, is not generally incentivized to support the provision of these public goods as they cannot capture their full value, which is why the public sector often guides private sector investments in clean energy technologies.
The federal government has historically focused on research, development, and early-stage demonstration (RD&D) activities. But to achieve the goals outlined in this paper, the federal government must play a role in every stage of the innovation process to enable derisking, financing, and scaling of new technologies by the private sector. The federal government also invests in public-private partnerships to increase engagement (and funding) from the private sector and help overcome many remaining barriers to market adoption. In addition to RD&D funding, federal support also comes in the form of incentives such as tax credits, which have proven to help drive the deployment of new technologies.
Private sector investments are typically made in the pursuit of developing new products or technologies with nearer-term commercial viability. Like the federal government, the private sector invests across all stages of the clean energy innovation process. However, it plays its largest role in technology deployment and operation of the energy system as the perceived technical risks are reduced due to prior RD&D success.
DOE is the primary federal agency that receives and distributes funding for energy technology RDD&D. Other agencies like the Department of Interior and the US Department of Agriculture also receive congressional funding for clean technology innovation—but at much smaller levels than DOE. Since its inception, DOE has supported energy innovation to improve domestic energy security levels and make energy more accessible and affordable. But as concerns over energy insecurity and climate change have increased, Congress has charged DOE with increasing investments in clean energy innovation to develop solutions that help expand domestic clean energy supply and reduce climate pollution and GHG emissions. For years, DOE’s clean energy innovation budget mostly supported RD&D activities. Only in recent years have we seen a major shift in this trend with transformative investments by Congress in broader demonstration and deployment activities due to the IIJA and IRA.3 Consistent public and private sector support is and will continue to be critical for accelerating clean energy innovation in the US and abroad.
Unpacking federal RDD&D appropriations
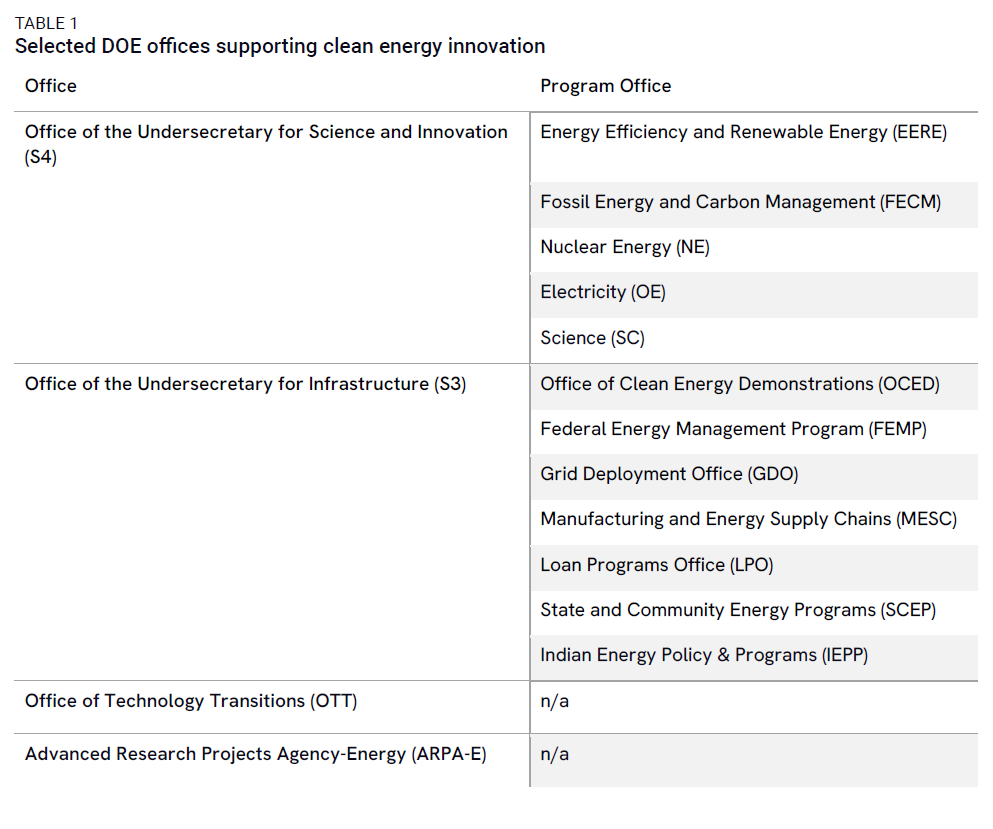
In this section, we describe our approach for estimating DOE’s recent spending on clean energy RDD&D activities. In the first step of our approach, we identify the offices within the department that receive congressional appropriations for advancing the innovation of clean energy technologies (Table 1).
For this analysis, we track spending for those offices and program activities that directly fund the innovation of clean technologies and supporting infrastructure. We also include spending for programs that help bolster the supply chains for clean technologies or provide some form of commercialization support. We only track spending and do not assess the effectiveness or impact of spending on accelerating technology innovation and progress towards commercialization.
We exclude offices and program activities for a few different reasons. Some offices and programs engage in clean energy research that is too early-stage to be able to be attributed to a specific technology, so we cannot map the investments to the technology taxonomy we discuss below. Examples of these types of programs include SC’s Basic Energy Sciences and Biological and Environmental Research programs. Some offices and programs have small budgets or have not been appropriated any funds between FY21 and FY23. We generally characterize budgets as small if budget levels are less than $10 million per year, though we sometimes relax this threshold.
We explicitly exclude funding specific to program operation (e.g., program direction). We also exclude funding that supports construction or operation of DOE facilities and infrastructure (e.g., routine site maintenance at DOE national lab offices and campuses). We do, however, include funding for DOE user facilities that innovators use to de-risk their new technologies. Lastly, we exclude funding that supports development of technologies other than clean energy technologies.
Though these methodological decisions necessarily mean we don’t present a fully comprehensive estimate of all clean energy innovation funding, we believe this approach still yields meaningful insights. The clean energy RDD&D spending we are tracking represents about 56% of the total RDD&D spending by the S3, S4, OTT, and ARPA-E offices. We also hope to refine our ability to include some of these offices and programs in future work.
Because our focus is on recent DOE spending, we collect data on enacted annual appropriations for FY21 through FY23, as well as data on one-time appropriations associated with the IIJA and IRA energy bills. Our key source of data for all enacted appropriations is the official DOE Congressional Budget Justifications. Budget justifications describe spending by program office, program, and program activity. For program offices like EERE and FECM, which are comprised of suboffices, budget justifications also describe spending by suboffice. These in-depth documents capture both a given year’s budget requests as well as historical data on previously enacted budgets. They also provide key information on IIJA and IRA appropriations across different program offices.
We use program and program activity information provided in budget justifications in conjunction with information from program office websites to categorize spending into technology categories. Because DOE invests in a wide range of clean technologies, we adopt a taxonomy that maps program funds first to a series of technology classes, allowing us to take a consistent approach to evaluating DOE’s spending on clean energy innovation (Table 2). For most technology classes, we also categorize funding at specific technology levels (e.g., solar photovoltaics or offshore wind as part of the renewable energy technology class).
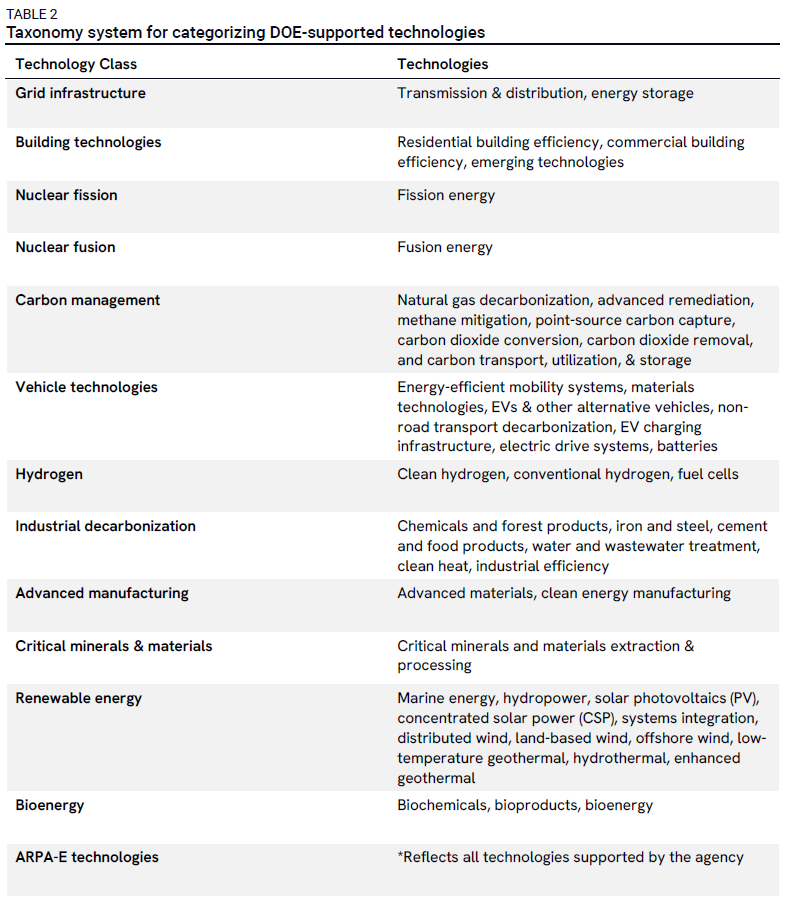
We chose our technology class designations based on the program/subprogram office and the specific set of technologies they support. For example, the Industrial Efficiency & Decarbonization Office—part of EERE—invests in technologies that reduce US industrial sector emissions. OCED is another major program office that supports the advancement of industrial sector decarbonization technologies through its Industrial Demonstrations Program. We assign all RD&D funding associated with industrial decarbonization technologies supported by these offices to the industrial decarbonization technology class. It is important to note that our technology class designations do not necessarily align with potential areas of application. For example, clean hydrogen can be used to power hydrogen fuel-cell vehicles as well as a replacement fuel for several industries like oil refining and ammonia production. However, based on our current taxonomy approach, all funding for clean hydrogen RDD&D is assigned to the hydrogen technology class.
We focus our reporting in this note mostly on the technology class, but more granular data is available on the ClimateDeck platform.
Because OCED and LPO funding mostly supports individual clean energy projects, we track funding for these offices based on what’s already been committed to specific clean energy technology projects as of July 1, 2024. For OCED, we reviewed the program office website to identify the different clean energy projects and their associated funding levels. Several of these projects involve multiple technologies. When possible, we leverage project details to inform how we should split project funding across the different technologies. Otherwise, we assume an equal distribution of funding across all relevant technologies. We assign all OCED project funding to the demonstration stage.
In the case of LPO, there are multiple ways to track the capabilities of the office, which include total loan authority, outstanding loans, and appropriated dollars. Following the passage of the IRA, LPO now has a lending authority totaling $412 billion. Because our database seeks to capture comparable spending estimates across all relevant DOE offices and programs, for LPO, we tracked the credit subsidy costs for all clean energy projects with active LPO loans and loan guarantees, as well as those that have been offered conditional commitments.4 LPO projects currently reflected in our database account for roughly $24.5 billion of its total lending authority. The primary responsibility of LPO is to provide debt financing for the commercial deployment of clean energy projects, therefore we assign all credit subsidy costs to the deployment stage.
To ensure the accuracy and completeness of our data, we validated our database against other existing databases that similarly track federal investments in energy innovation. These include Gallagher and Anadon’s DOE Budget Authority for Energy RD&D Database, ITIF’s US Energy Department RD&D Budget: Interactive Dataviz, and the Climate Innovation Funding Tracker developed by EDF. Our FIEI database spending estimates align well with the others. The majority of these resources do not track spending by technology and innovation stage, and those that do assign funding to only a small set of technology categories. We complement these resources by offering increased granularity mapping of DOE appropriations to a broader range of technologies and technology classes.5
Federal support for clean energy innovation
A major boost in funding for demonstration and deployment activities
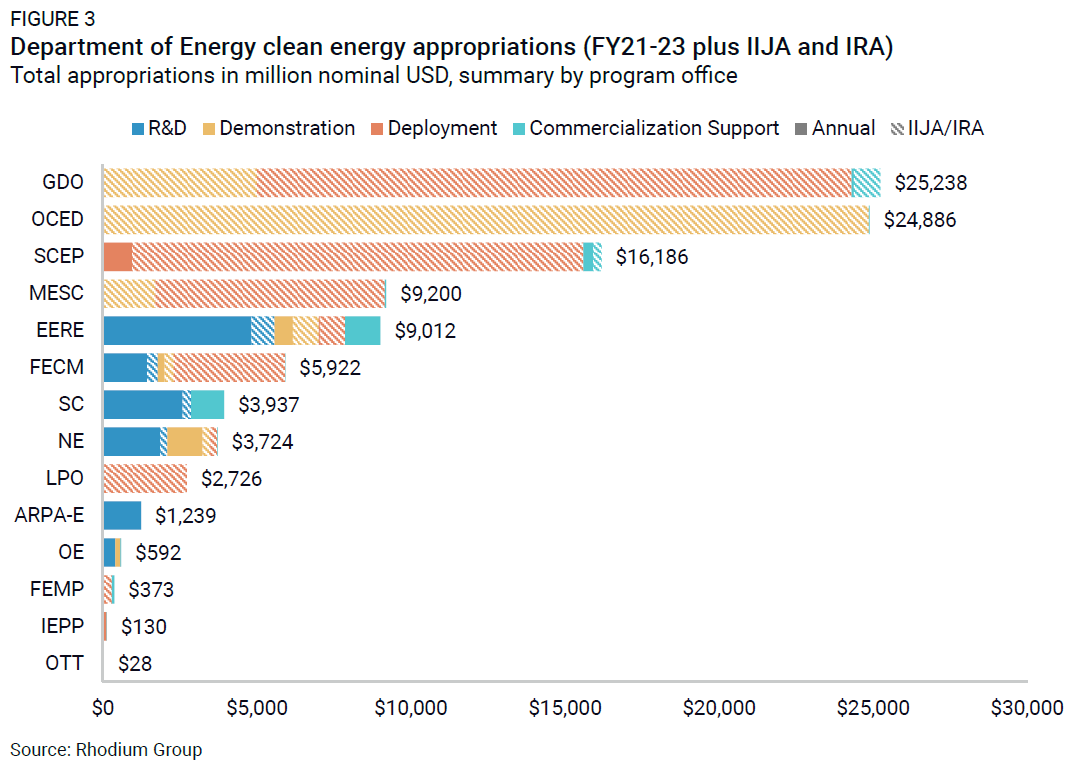
For years, annual DOE appropriations from Congress for clean energy innovation largely supported RD&D activities of the Office of Science and the applied energy program offices (i.e., EERE, NE, FECM, and OE)—all of which have traditionally focused on R&D and early-stage demonstration projects. But Congress added to the department’s priorities with a major new emphasis on later-stage activities, providing funding in the IIJA and IRA to significantly boost support for both demonstration and deployment activities relative to the annual appropriations process (Figure 3).
We find that clean energy technologies have seen major increases in appropriated dollars because of the IIJA and IRA. The largest increases came in funding for demonstration and deployment, which grew by a factor of 15 ($32.9 billion) and 43 ($49.0 billion), respectively. Though this represents a major boost in funding, applied offices have always received funding for technical assistance, standards development, workforce training, and other deployment activities. Accordingly, appropriations from the IRA and IIJA build on DOE’s work on supporting deployment of later-stage technologies.
There was also a boost in R&D funding because of the IRA and IIJA, with the applied energy offices seeing increases of 32-46% over their average annual congressional funding levels from the legislation.
Funding for commercialization support activities primarily comes from annual congressional appropriations, except in the case of GDO and SCEP, where one-time appropriations provided by the IRA and IIJA are largely responsible for the increases in commercialization support funding in these offices.
Grid resilience and reliability are top federal priorities
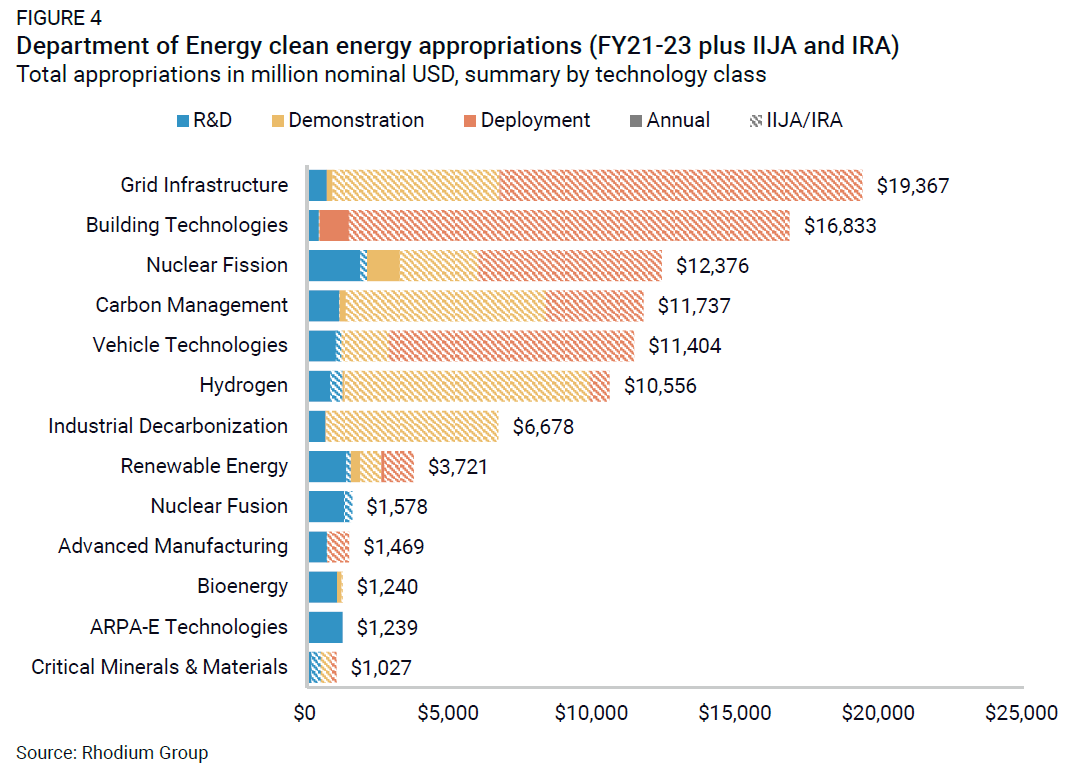
Many of the clean energy technologies that have received support through annual congressional appropriations also received major increases in overall innovation funding due to the IIJA and IRA. Across all sources of funding, the highest levels of support are for technologies associated with grid infrastructure, building technologies, and nuclear fission power generation (Figure 4).
In the case of grid infrastructure, about 65% of the total funding supports programs that help deploy technologies aiming to improve power system resilience and reliability. The largest of these programs is DOE’s Preventing Outages and Enhancing the Resilience of the Electric Grid Grants program. Funded through IIJA appropriations, the $5 billion program supports a wide range of project technologies needed to modernize, strengthen, and enhance the resiliency of the US electricity grid. Examples of eligible technologies include monitoring and control technologies, adaptive protection technologies, and weatherization technologies and equipment. The Smart Grid Investment Matching Grant program is another major DOE program that utilizes its $3 billion of IIJA-appropriated funding to support the installation of smart grid technologies like fiber and wireless broadband technologies, which are critical to expanding smart grid operations.
Roughly 85% of building technologies funding supports expanding the use of energy-efficient technologies (e.g., heat pumps) for residential buildings. For example, Congress appropriated $3.5 billion in the IIJA to expand DOE’s Weatherization Assistance Program (WAP), which helps low-income households permanently lower their energy costs by making their homes more energy efficient. The remainder is a mix of grants available to states and Tribes for home energy rebate programs, rebates for whole-house (i.e., single family or multi-family homes) energy-saving retrofits, and technical assistance programs that help state and localities implement that latest series of residential building codes.
Congressional appropriations for nuclear fission largely focus on demonstration and deployment activities, with about half of the overall funding (~$6.4 billion) supporting DOE’s Civil Nuclear Credit Program. Funded through the IIJA, the Civil Nuclear Credit Program provides financial support for existing US nuclear reactor plants to help keep them deployed and prevent premature closures due to various economic issues. Congress also made significant investments in nuclear fission through the IRA, appropriating roughly $700 million in support of the High Assay, Low Enriched Uranium (HALEU) availability program—a DOE program focused on establishing domestic supply chains for HALEU, a material needed to power advanced fission reactors.
A deeper dive: investments by technology
We provide much more granular data for these investments in our FIEI database and dashboard, available on the ClimateDeck. To demonstrate the value of this more granular data and to make these results more concrete, we provide two case studies that use technology-level data within a given class, focused on carbon management and renewable energy. We selected these classes because they both capture a wide range of technologies at different stages of development.
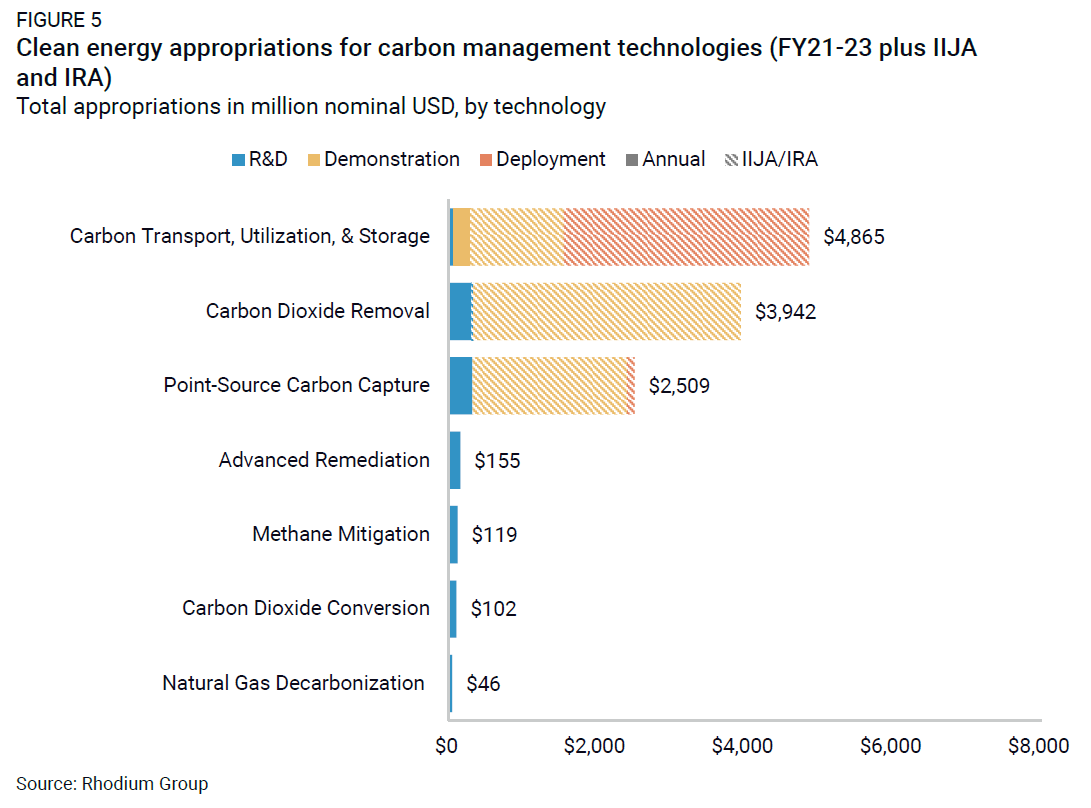
Carbon management technologies are one of the many areas within the clean energy technology space in which the US is currently a global leader. In the last few years, DOE spent close to $13 billion of congressional funding on carbon management RDD&D. DOE congressional appropriations prioritize the development and deployment of carbon transport, utilization, and storage (CTUS) technologies, along with carbon dioxide removal (CDR) technologies like direct air capture, which removes carbon dioxide directly from the atmosphere (Figure 5). CTUS funding mostly supports demonstration and deployment activities, while funding for CDR largely supports demonstration projects. For example, FECM’s Carbon Storage Validation and Testing program uses its $2.5 billion provided by the IIJA to develop new or expand existing commercial-scale carbon sequestration projects and supporting CO2 transport infrastructure. OCED’s Regional Direct Air Capture Hubs program is a major financier of CDR demonstration projects with a particular focus on direct air capture technologies. Collectively, these technologies receive almost 70% of the total appropriations supporting carbon management RDD&D.
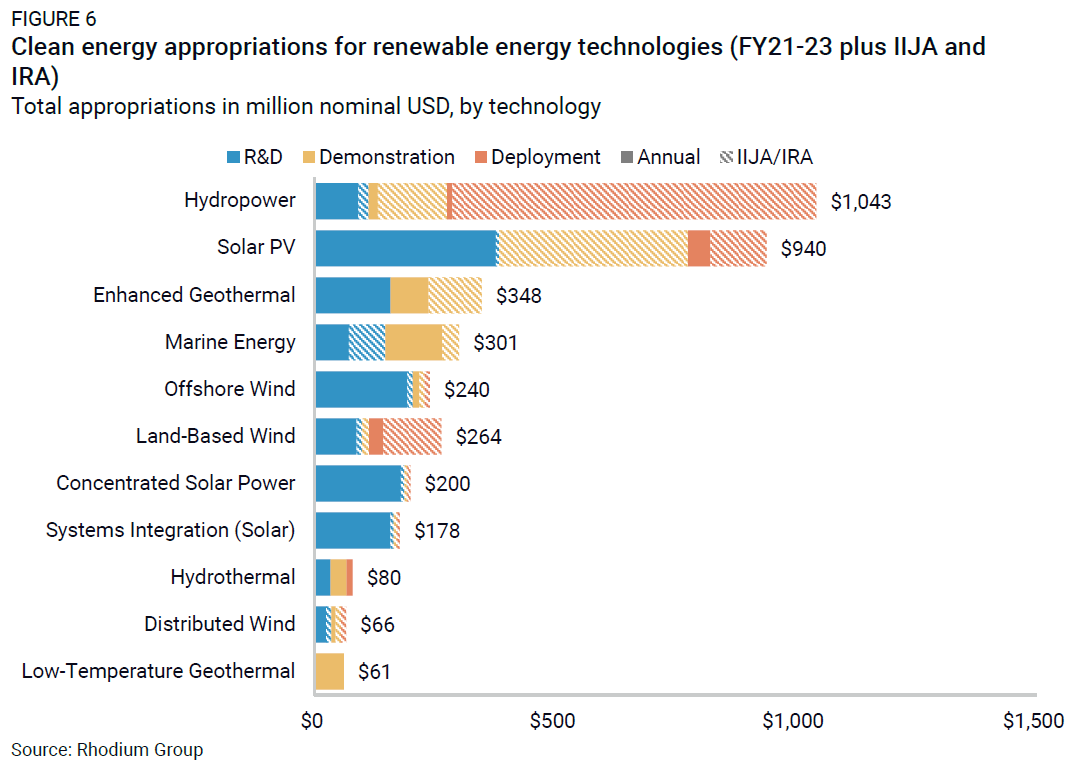
Renewable power-generating technologies received around $4 billion in investments in our data set—less congressional funding than other technology classes. Within the class itself, there is a heavy concentration of funding in the more commercially mature hydropower and solar PV technologies (Figure 6). The IIJA provides more than $800 million in hydropower RDD&D support with an emphasis on boosting funding for hydroelectric incentives originally authorized under the Energy Policy Act of 2005. These incentives are geared towards maintaining and enhancing existing hydropower facilities, improving the operational efficiency of existing facilities, and expanding clean electricity production from hydroelectric facilities.
In the case of solar PV, roughly 40% of total funding is from annual congressional appropriations and focuses on R&D activities. One-time energy bill investments in solar PV largely target later-stage activities, supporting programs like OCED’s Energy Improvements in Rural or Remote Areas (ERA) program, which provides funding for advancing clean energy demonstration projects in rural or remote areas, many of which integrate solar PV technologies.
The remaining renewable technologies, which include various types of wind and geothermal as well as marine energy and concentrated solar power, collectively receive less funding than hydropower and PV, with larger shares focused on the earlier research and development stages of innovation. Some of these technologies, like land-based wind and hydrothermal geothermal, are already available at commercial scale, while others, like enhanced geothermal systems (EGS) and marine energy, are more nascent.
Key insights on federal priorities
The passage of both the IIJA and IRA has increased DOE’s overall funding to support clean energy innovation as well as its ability to engage more in later-stage innovation activities. We find that congressional investment priorities for the department differ depending on the innovation stage, the funding source, and the technology. Much of DOE’s recent clean energy R&D funding continues to come from annual appropriations. Although the agency uses this funding to support the R&D activities across all technology classes, there is a high concentration of investment in clean power generation (i.e., nuclear fusion, nuclear fission, and renewable energy). These technologies have been major recipients of DOE funding going back to the founding of the department. It is therefore appropriate to take a step back and examine whether the current allocation of funding is best suited to support the expansion of US leadership across a wide range of clean energy technologies.
This analysis provides insight into the types of clean energy technologies currently being supported by the federal government, as well as to what degree they are being supported. Ongoing support will be needed going forward to get many of these technologies to commercial scale at a pace that aligns with the Trump administration’s long-term energy dominance strategy. However, it is unclear where this additional funding support should be targeted. We seek to provide some clarity on this issue in an upcoming follow-on analysis. In this forthcoming analysis, we develop and test a new framework to estimate, for a given clean energy technology, the additional federal investment needed at each stage of the innovation process to reach commercialization. We will leverage our findings in this analysis in conjunction with the results from our future prospective work to help characterize the potential funding gaps for various clean energy technologies.
Footnotes
FY22 and FY23 budget numbers include Infrastructure Investment and Jobs Act of 2021 appropriations for energy RD&D.
The IIJA included roughly $88 billion in funding for clean energy, transportation, and fuel and charging infrastructure. The latest Congressional Budget Office estimates suggest that spending from the IRA clean energy provisions has increased to nearly $666 billion.
We do not include the CHIPS and Science Act of 2022 because the bill itself does not directly provide funding for developing and deploying clean energy technologies.
Credit subsidy costs are effectively the cost of the loan or loan guarantee to the federal government. We estimate the credit subsidy cost for each project based on the procedures prescribed by the Federal Credit Reform Act of 1990 for energy programs.
EDF’s Climate Innovation Funding Tracker is the only database of the three mentioned that captures federal spending on climate innovation across multiple federal agencies. However, a significant amount of congressional funding that is being tracked in their database beyond DOE is not related to clean energy technology innovation. We find alignment between our estimates and theirs as it relates only to congressional appropriations to DOE in support of clean energy technologies.