Global Greenhouse Gas Emissions: 1990-2020 and Preliminary 2021 Estimates
Rhodium Group provides the most up-to-date global and country-level GHG emissions estimates each year. In 2021, as countries and economies began to recover from the worst of the pandemic, global emissions bounced back—rising 4.6% from 2020 levels.
Tracking greenhouse gas (GHG) emissions across the 190+ Parties to the Paris Agreement provides valuable data for decision-makers in both public and private sectors as they develop strategies to meet global net-zero emissions goals. This data can inform policies and interventions that target the most carbon-intensive industrial and economic activities.
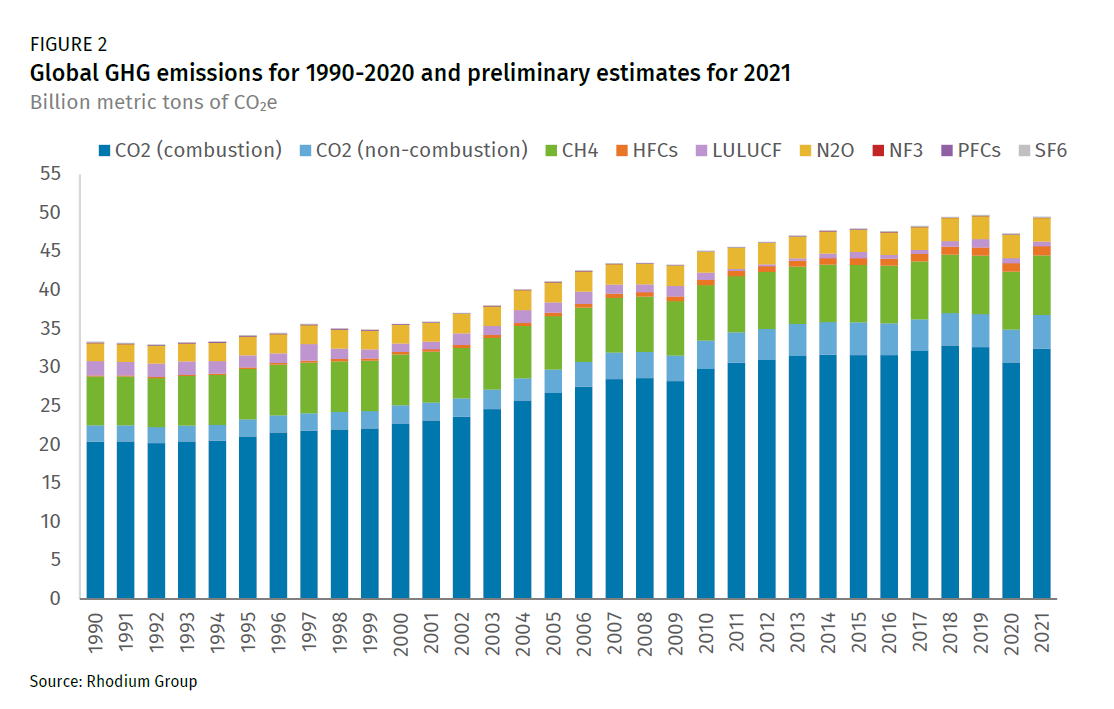
Every year, Rhodium Group provides the most up-to-date global and country-level GHG emissions estimates through the ClimateDeck. This year’s update features final emissions estimates from 1990-2020 and preliminary estimates for 2021. This data includes estimates for all six Kyoto gases from across all sectors of the economy, consistent with UN reporting guidelines. In addition, this year, we add a new level of disaggregation in our emissions from industry by including historical estimates for process and thermal emissions from cement production by country.
Total global emissions increased 4.6% in 2021 based on preliminary estimates
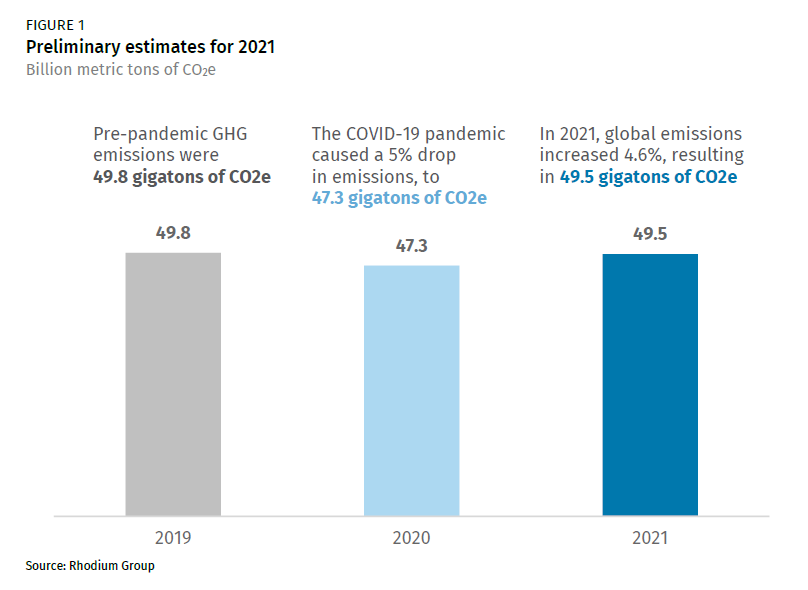
In 2021, as countries and economies began to reopen and recover from the worst of the COVID-19 pandemic, global GHG emissions bounced back, but not quite all the way to pre-pandemic levels. Based on our preliminary estimates, global emissions—of the six Kyoto greenhouse gases for all sectors, including land-use and forests as well as international bunkers—increased from 47.3 gigatons of CO2e in 2020[1] to 49.5 gigatons in 2021 (Figure 1). This marks an increase of 4.6% from 2020 levels, getting close to but not fully rebounding from the 5% reduction caused by the COVID-19 pandemic in 2020. The 2021 rebound was driven in part by a rise in the carbon intensity of the economy.
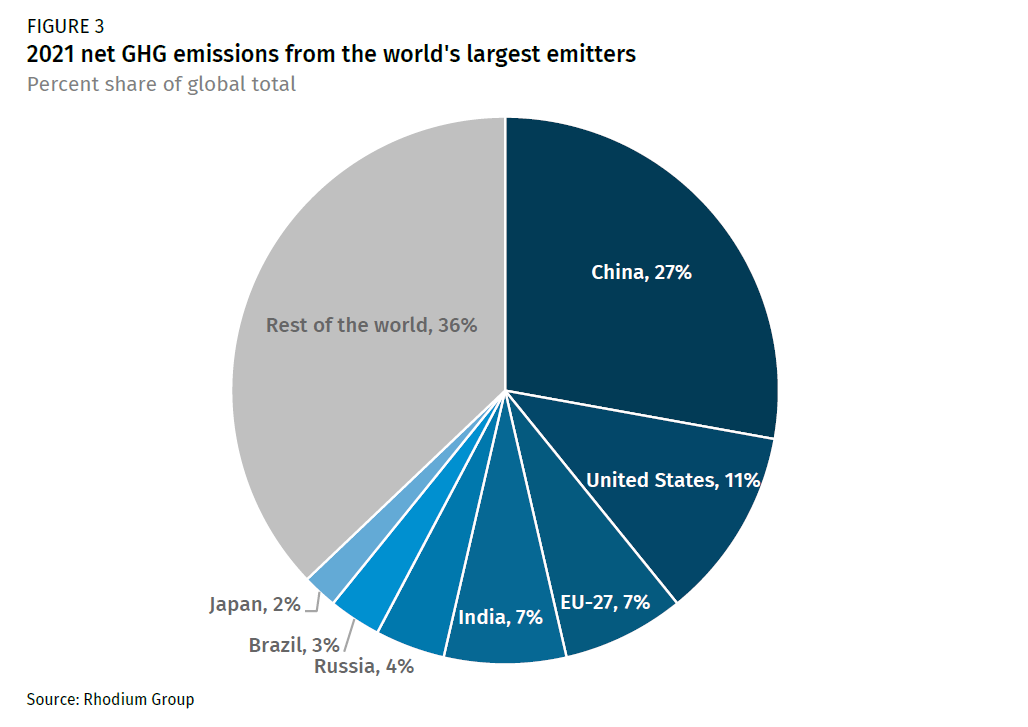
At the country level, nearly two-thirds of global emissions in 2021 came from only eight major economies (Figure 3). China remained the largest single-country contributor to global GHG emissions, with an overall share of 27% of global emissions, followed by the US at 11%, and the EU and India at 7%.
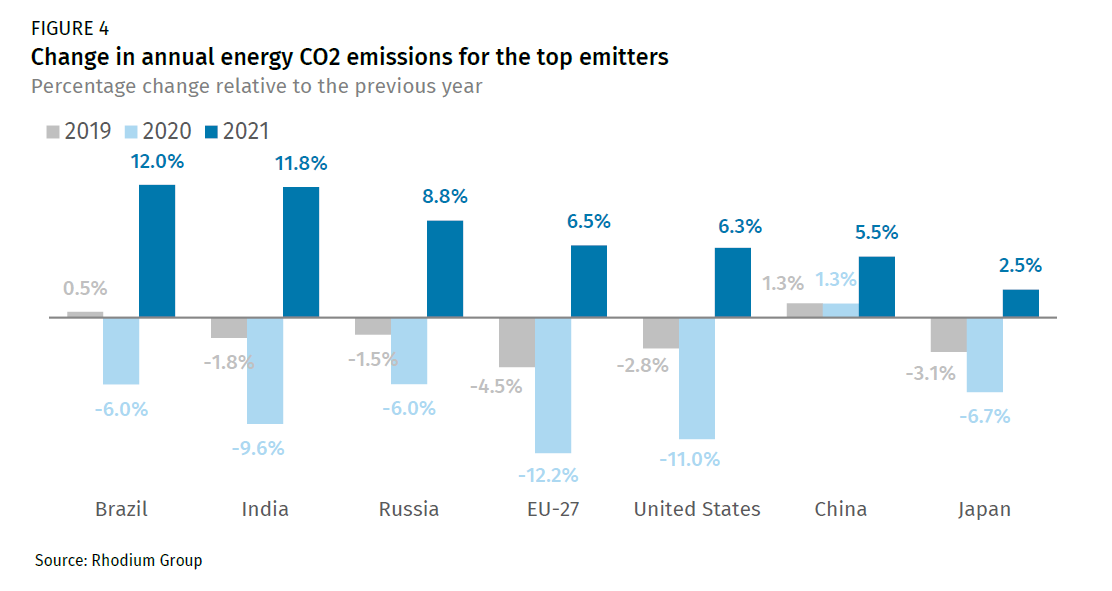
CO2 emissions from the combustion of fossil fuels increased in every major economy in 2021 compared to 2020 (Figure 4). In four major economies—Brazil, India, Russia, and China—emissions from fossil fuels rebounded above pre-pandemic levels in 2021. China, the only major economy where CO2 emissions increased in 2020, increased its emissions again in 2021 by an estimated 5.5%. The most significant increase in CO2 emissions from fossil fuels among major emitters was in Brazil, where emissions increased by 12% in 2021, compared with a 6% drop in 2020. Although emissions increased in both the US and EU-27 in 2021, by 6.5% and 6.3%, respectively, they did not fully reach pre-pandemic levels.
The major drivers of increased emissions in countries that bounced back to pre-pandemic levels differ across regions. Last year, Europe and Asia experienced a colder-than-average winter followed by a warmer-than-average summer, which increased the demand for coal and natural gas. Without a significant increase in supply, coal and natural gas prices rose around the world.
In India and China, where coal is cheaper than natural gas, coal consumption was the primary driver of their CO2 emissions rebound in 2021. According to BP Statistical Review, coal consumption in dropped by 6% in 2020, but increased by 15% in 2021. In China, where coal comprises 66% of its fossil fuel consumption, coal consumption increased by 0.7% in 2020 and 4% in 2021.
Russia decreased its oil and natural gas consumption in 2020 (4.7% and 5.6 %, respectively) and rebounded with a 5.8 % increase in oil consumption and a 12% increase in natural gas in 2021. In Brazil, where 90% of its fossil fuels consumption comes from oil and gas, consumption dropped in 2020 (by 12% and 12.3%, respectively) and rose by 5.6% and 28% in 2021.
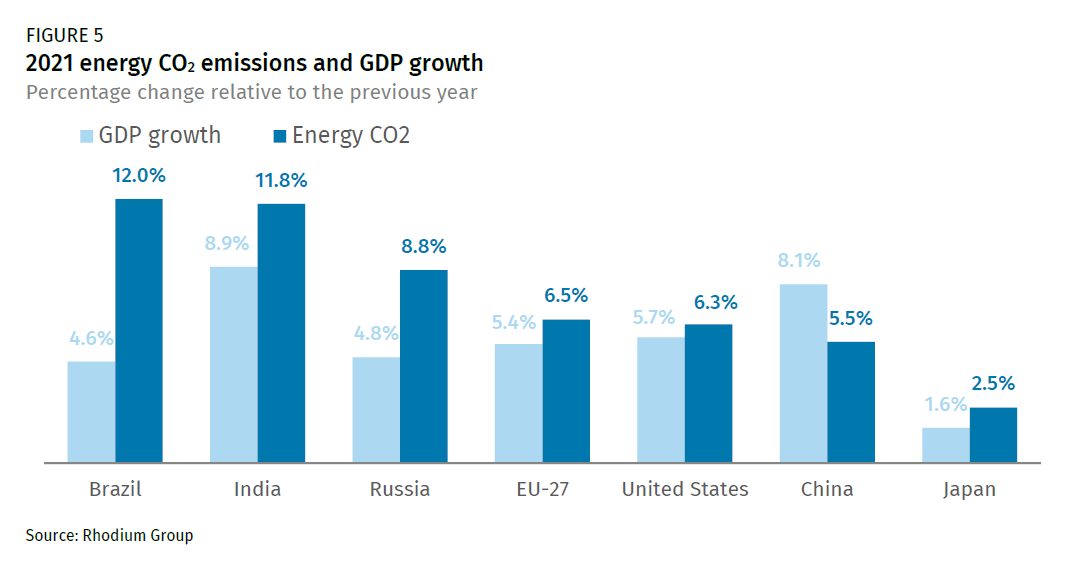
For every major emitter except for China, the 2021 rebound was driven by a significant rise in the carbon intensity of their economies, as fossil fuel demand rose faster than the economy as a whole. In Brazil, fossil fuel demand (and associated CO2 emissions) increased nearly three times faster than GDP growth in 2021 (Figure 5). Similarly, Russia’s CO2 emissions grew 8.8%—nearly double the pace of overall economic growth (4.8%). India, where CO2 emissions from fossil fuels increased by 11.8% in 2021, experienced an economic rebound of 8.9%. In the US and the EU, emissions increased roughly one percentage point higher than their economic growth. By contrast, China’s CO2 emissions from fossil fuels increased by 5.5%, while its economy grew 8.1%, driven primarily by the shift in consumption from coal to natural gas, a less carbon-intensive fossil fuel.
Emissions by sector: Industry and electric power generate more than half of global emissions
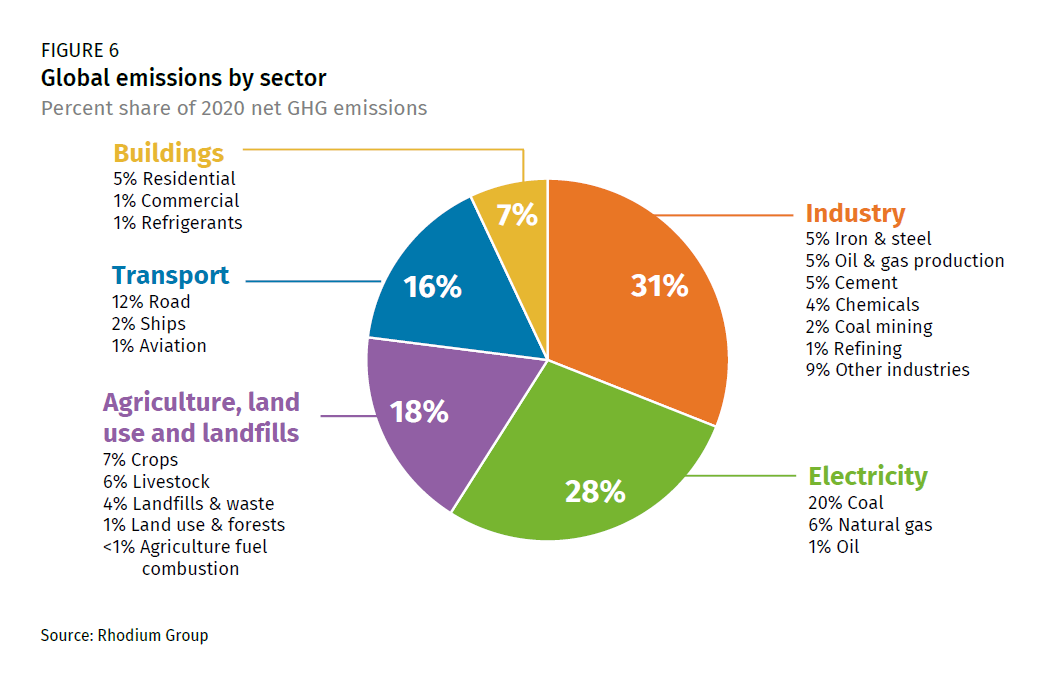
In 2020—the latest year for which there is sufficient data to provide sectoral level detail—industry remained the largest emitting sector, generating 31% of global emissions (Figure 6). Emissions from the electric power sector contributed 28% of global emissions, the vast majority of which came from coal combustion. Combined emissions from land use, agriculture and waste made up 18%, followed by transportation at 16% and buildings at 7% of the global total.
All the data described here are available in Rhodium’s ClimateDeck data platform. The ClimateDeck features GHG and energy data for all 190+ countries in the world and all 50 US states and provides users the ability to filter by region, GHG, sector and sub-sector, as well as socioeconomic indicators (e.g., emissions per capita and per GDP), and full inventory tables for each country.
[1] Changes in magnitude differ from previous versions of our estimates for global greenhouse gas emissions data due to methodological improvements to account for methane from coal mines, HFCs, and agricultural emissions.