Justice40 Initiative: Mapping Race and Ethnicity—Updated
The final version of CEQ's Climate and Economic Justice Screening Tool identifies environmentally and socioeconomically disadvantaged communities eligible for federal resources under the Justice40 initiative.
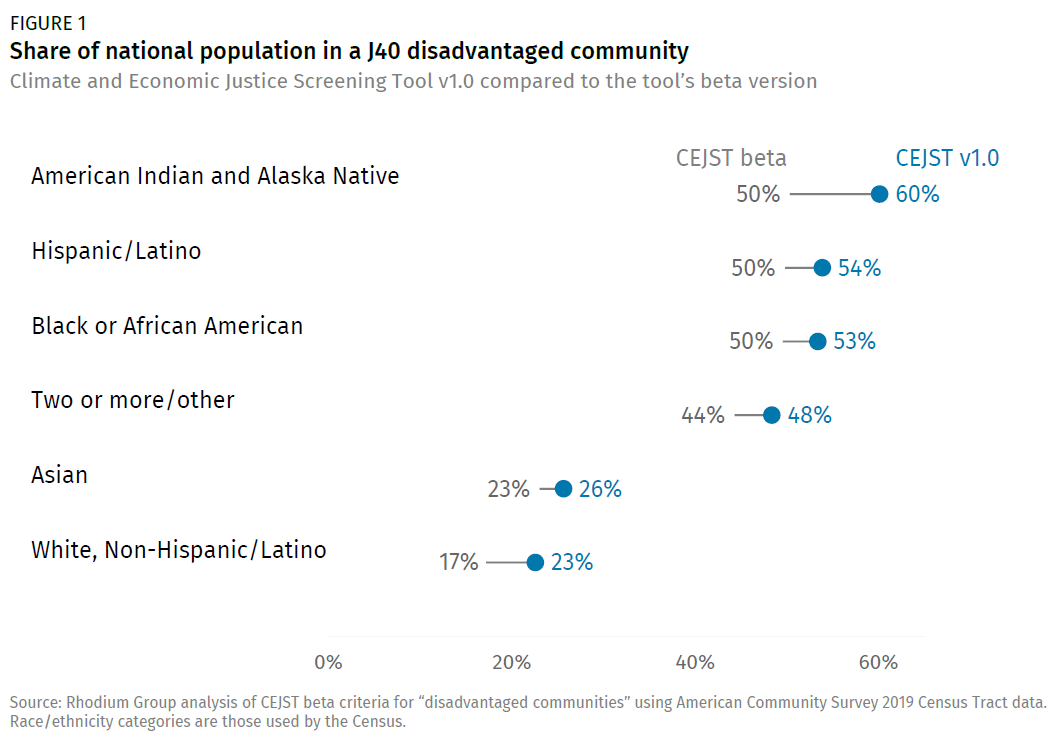
In February 2022, the White House Council on Environmental Quality (CEQ) released the beta version of their Climate and Economic Justice Screening Tool (CEJST), which identifies environmentally and socioeconomically disadvantaged communities eligible for federal resources under the Justice40 initiative. Notably, the tool did not explicitly consider race and ethnic demographics when determining if a community qualifies for the Justice40 initiative. Using 2019 census data, previous Rhodium analysis of the beta tool found that over 50% of Hispanic/Latino, Black, and American Indian/Alaska Native individuals reside in census tracts considered disadvantaged under the screening tool criteria.
On November 22, 2022, the final version (V1.0) of the CEJST was released. This version includes several new environmental and socioeconomic criteria which could establish eligibility for the Justice40 initiative. In this note, we update our analysis to include the criteria in the final version of the tool, and find that the number of communities eligible for benefits under the Justice40 initiative has increased overall. Further, we show that the final criteria dataset highlights the increased burden of compounding environmental, health, and socioeconomic barriers on Black, Hispanic/Latino and American Indian/Alaska Native communities. These communities make up 30% of the US population and 49% of the population of communities eligible for the Justice40 program, but they make up 60% of the population exceeding at least five threshold screening criteria in the tool and 71% of the population exceeding 10+ screening criteria.
Final updates to the Climate and Economic Justice Screening Tool
In this analysis, Rhodium Group combined the CEJST beta and V1.0 datasets in order to quantify the eligibility impacts of new criteria added for the final version of the tool. Developed by the White House Council on Environmental Quality, the CEJST identifies disadvantaged communities which have been historically burdened by climate change, pollution, and environmental hazards. The tool covers census tracts across all 50 US states, the District of Columbia, and the US territories. Data on climate, environmental, and socioeconomic indicators are combined with census data to identify which communities are disadvantaged. The CEJST is updated annually to reflect changes spurred by new public comments and the availability of new data.
In the beta version of the tool, released in February 2022, a community is identified as disadvantaged if: (1) it is within a census tract that meets at least one of the thresholds of the tool’s burden categories; or (2) it is within a census tract that is above the threshold for the socioeconomic indicators. Data on indicators mapping to eight different threshold categories are included in the initial version.[1] Not included are data on any demographic indicators such as race. The latest version (V1.o), however, does include data on race, ethnicity, and age from the 2019 American Community Survey for each census tract, as well as data on nine new indicators of climate, housing, legacy pollution, transportation, and wastewater risks.[2] Rhodium Group applied the same demographic data to the beta version of the CEJST in our earlier analysis.
Any census tract which meets these or the beta version criteria and are also low income[3] qualify for Justice40 resources. In addition, the screening criteria in V1.0 were updated to designate any census tracts within the boundaries of a federally recognized tribe and any middle income tracts surrounded by tracts designated as disadvantaged as disadvantaged as well, for a total of 11 new criteria. As a result of these changes, the number of individuals living in tracts designated as disadvantaged and qualifying as Justice40 communities increased across all demographic groups (Figure 1). The largest increase in eligibility was in American Indian and Alaskan Natives communities—an additional 11% of that population was identified as Justice40 communities under the new criteria.
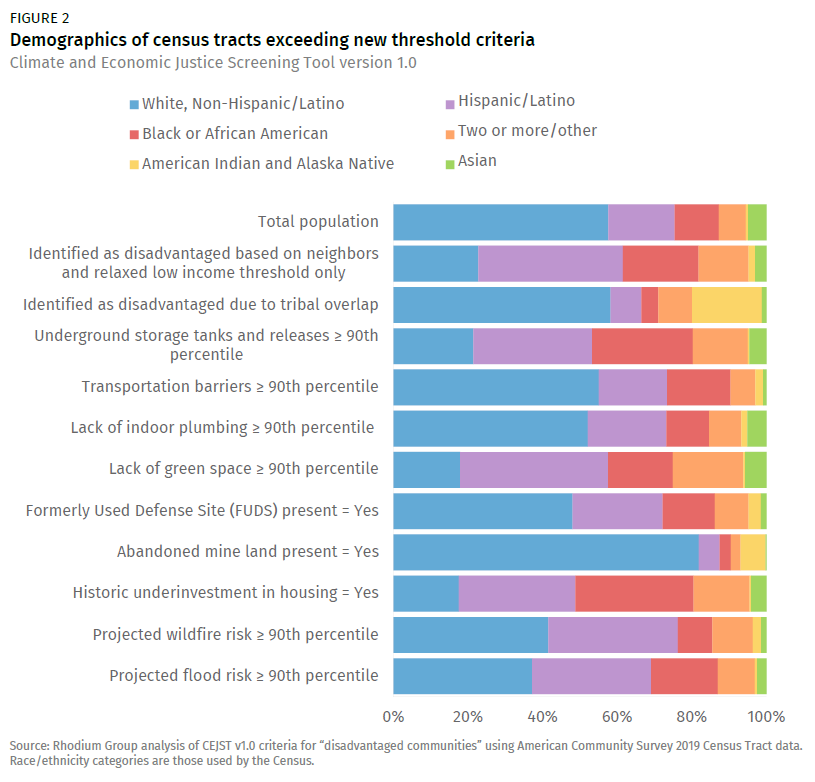
In order to paint a more detailed picture of the varying impacts of the addition of new criteria in the updated CEJST, we calculated the demographic breakdowns of census tracts which meet the threshold for each new criteria. Hispanic/Latino and individuals of two or more races make up a larger fraction of the population of the set of census tracts exceeding a given criteria than their fraction of the total US population for nine of the new criteria; Black and African American and American Indian/Alaskan Native individuals do so for seven of the new categories; Asian individuals for two of the new categories; and White Non-Latino communities for one new category. Figure 2 shows each demographic group as a fraction of the total US population as well as each demographic group as a fraction of the population identified as disadvantaged for each of the 11 new threshold criteria.
Tracking compounding effects
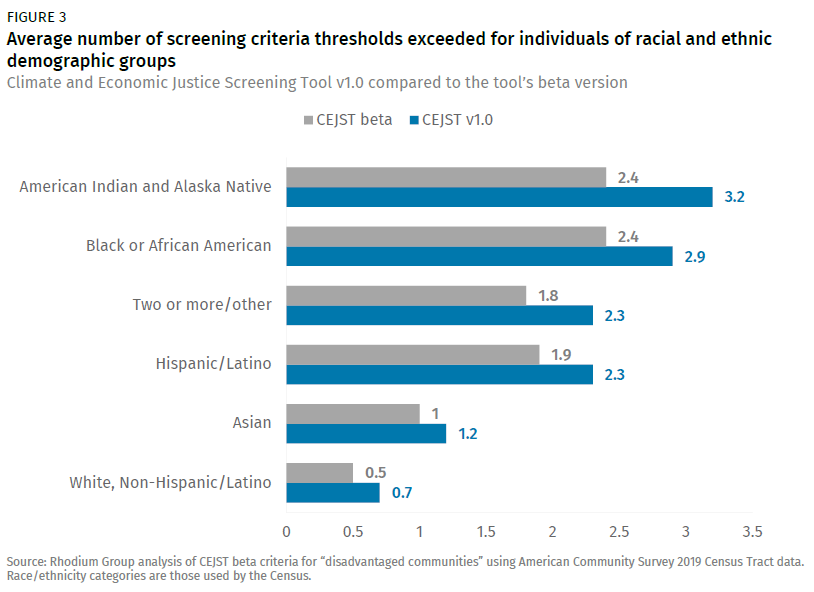
Examining the average number of CEJST threshold criteria faced by individuals of different demographic groups reveals disparities in the number of threshold criteria exceeded. The final version of the CEJST includes 30 different environmental, health and infrastructure criteria paired with considerations for whether a community is also low-income or facing low educational attainment. Black or African American, American Indian and Alaska Natives, Hispanic/Latino and individuals of two or more races on average are exposed to more criteria burdens than the overall average for the population. The addition of new criteria in the final tool version increased the average count of burdens an individual is exposed to across all racial demographics; in the beta tool dataset, the average census tract weighted by population exceeds 1 threshold criteria, and in the V1.0 dataset the average tract exceeds 1.3 criteria. The increase was most pronounced for American Indian and Alaska Native communities.
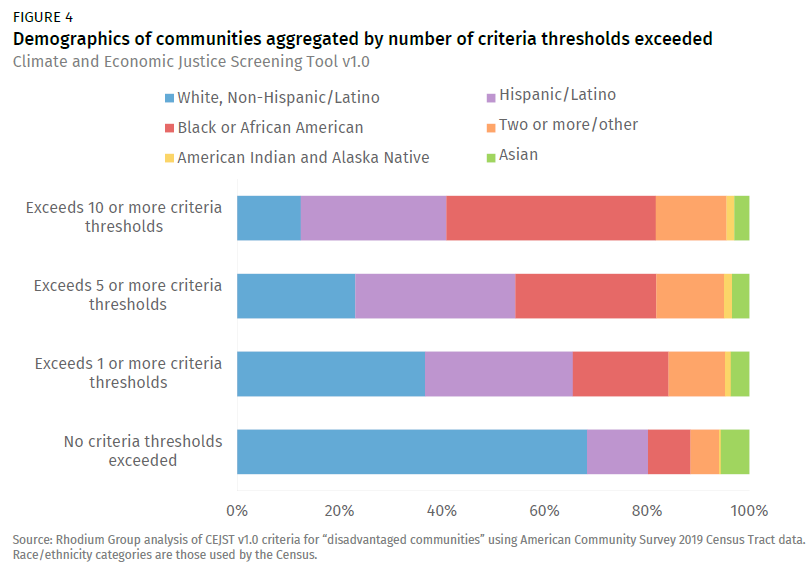
The CEJST provides a binary output; a community is labeled as either disadvantaged or not based on whether it meets one of the tool criteria and is considered low-income. Under the CEJST V1.0 criteria dataset, 34% of the US population is living in census tracts labeled as disadvantaged. However, the criteria utilized in the tool lends insight into the burden of compounding environmental and socioeconomic effects across different communities. The communities which face multiple burdens make up a smaller portion of the population than those qualifying as Justice40 communities—only 11% of the US population meets five or more of the CEJST threshold criteria, and 1.4% meets 10 or more. However, the communities which face multiple environmental and socioeconomic burdens are disproportionately non-white compared to both the US population as a whole, and all those qualifying as Justice40 communities. Of the individuals living in communities which exceed 10 or more threshold criteria, 39% are Black or African American, 1.1% are American Indian or Alaska Native, and 24% are Hispanic/Latino, although these communities only make up 11%, 0.5% and 16% of the US population, respectively.
The CEJST is an important first step for identifying disadvantaged communities for targeted infrastructure funding. However, consideration of the burden of compounding effects lends insight towards identifying and uplifting historically underserved communities.
[1] The eight categories include: (1) climate change, (2) clean energy and efficiency, (3) clean transit, (4) affordable and sustainable housing, (5) reduction and remediation of legacy pollution, (6) health burdens, (7) critical clean water and wastewater infrastructure, and (8) training and workforce development.
[2] See Figure 2 for list of all new indicators added in CEJST version 1.0.
[3] “Low income” communities are defined as census tracts which are in the 65th percentile or above for number of households with income less than twice the federal poverty level, excluding students enrolled in higher education.