Assessing the Greenhouse Gas Emissions of the US Petrochemical Industry
One key driver of sustained industrial emissions is the growth of emissions associated with petrochemical manufacturing in the US, which we estimate could rise by 6-32% by 2030 over today's levels.
Though US economy-wide greenhouse gas (GHG) emissions are on track to decrease by 2030 under current policy, emissions from the industrial sector remain stubbornly high at the end of the decade. One key driver of sustained industrial emissions is the growth of emissions associated with petrochemical manufacturing in the US. Petrochemicals are chemicals derived from fossil fuels that are used to manufacture a wide range of everyday products, including plastics. We estimate that the US petrochemical sector contributed 306-343 million metric tons (MMT) of GHG emissions across its total lifecycle in 2023. These emissions estimates are inclusive of upstream emissions from the production of fuels and feedstocks, production emissions from petrochemical manufacturing itself, and end-of-life emissions associated with the utilization and disposal of petrochemical products. Taken together, the petrochemical industry is responsible for around 5% of total US GHG emissions. Despite the imperative to decarbonize across the economy, we find that GHG emissions from petrochemicals could increase by 6-32% by 2030 over today’s levels. The key drivers of future emissions growth are how much new ammonia and ethylene production capacity ultimately come online by decade’s end and the level of methane emissions associated with the production and transmission of natural gas and oil—two primary inputs into petrochemical production. Course-correcting the petrochemical industry’s current emissions trajectory is not a straightforward task, but it’s critical to the US achieving deep decarbonization.
What are petrochemicals and why are they significant?
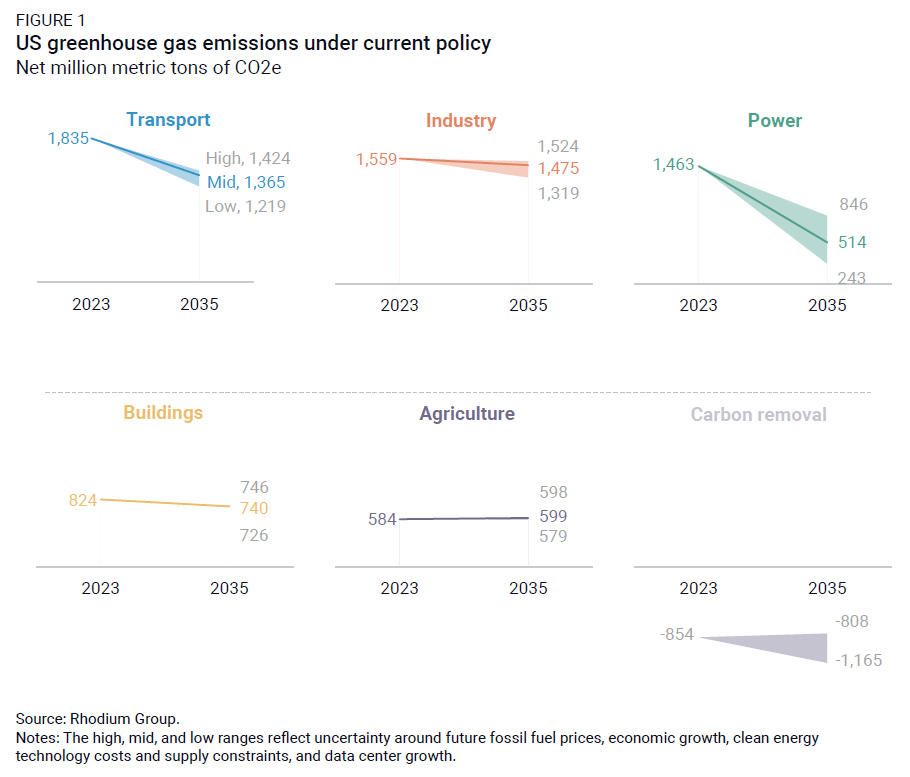
Under current policy on the books as of June 2024, the US is on track to achieve a 38-56% reduction in greenhouse gas emissions below 2005 levels in 2035. The results of November’s elections call this path into question, but one fact remains across all future emissions trajectories: emissions from the industrial sector remain stubbornly high at the end of the decade. As emission reductions accelerate in the electric power and transportation sectors, the US industrial sector is on track to be the largest emitting sector by the mid-2030s—and the emissions growth from petrochemical production is a meaningful contributor to this growth (Figure 1).
While there are currently options for decarbonizing other parts of the economy, there has been far less attention paid to reducing emissions from the production of petrochemicals—either by reducing demand for end products, developing substitutes, or cleaning up the current production processes. However, reducing emissions from the petrochemical industry is critical to the US achieving deep decarbonization.
Petrochemicals’ ubiquitous nature
Petrochemicals are chemicals derived from fossil fuels, generally petroleum and natural gas. Petrochemical products often go unrecognized since few people are aware of how pervasive the industry has become in modern life. They are combined with other inputs to produce a surprising range of everyday products including plastics, paints, cleaners and solvents, synthetic resins and rubbers, fertilizers, and certain pharmaceuticals. With increased consumerism, demand for goods containing these inputs—such as plastic packaging, electronics, and synthetic fibers in clothing—is also increasing. This trend is particularly evident at the global level with continued economic and population growth in developing countries.
Before being converted into petrochemicals, fossil fuels are first processed, usually at refineries and natural gas processing plants. These facilities produce a wide variety of products, including transportation fuels like gasoline and diesel fuel as well as petrochemical feedstocks, including ethane, propane, and butane. Next, these fossil-based feedstocks are refined further into primary petrochemicals, a group of eight key chemicals that are the building blocks for the rest of the petrochemical industry: ammonia, methanol, ethylene, propylene, benzene, toluene, butadiene, and mixed xylenes. These building blocks are further processed and combined with other inputs to create thousands of other chemicals, which we collectively refer to as derivative petrochemicals. From there, these petrochemicals are used as inputs into a vast array of products, including those listed above. Our analysis includes all primary petrochemicals and the highest-emitting derivative petrochemicals—a list of those in scope is provided in the appendix.
In this analysis, we focus on the lifecycle GHG emissions of the US petrochemical industry. The emissions impact is an important aspect of quantifying the effect of petrochemical production on public health and the environment, but there are a host of other impacts that are also critical to consider. Though beyond the scope of this analysis, a full accounting of the industry’s externalities must include the human health and environmental effects of the harmful water, air, and plastic pollution that results from petrochemical production. These impacts are particularly important to understand as they are largely occurring—and projected to grow—in communities that have already been historically overburdened by pollution from a host of industrial and fossil fuel sources, leading to high levels of cancer and respiratory disease, among other conditions.
Why this analysis?
In recent years, the research community has paid increasing attention to the emissions impact of petrochemicals. Notable studies include the International Energy Agency’s 2018 report The Future of Petrochemicals, which projected global production-phase chemical sector emissions in a baseline scenario. In 2022, Lund University researchers estimated global, cradle-to-grave lifecycle petrochemical emissions with regional and sectoral detail. These estimates were generated using environmentally-extended, global, multi-region, input-output (EEGMRIO) modeling. In the past year, C-THRU Project published a dashboard of global, cradle-to-gate lifecycle petrochemical emissions estimates with country, chemical, and emissions source granularity, as well as uncertainty bounds. Additionally, Lawrence Berkeley National Laboratory released global, cradle-to-gate lifecycle emissions estimates for nine key plastics in 2024. Most recently, the Center for International Environmental Law released cradle-to-gate lifecycle emissions estimates for US planned petrochemical facilities. The estimates were generated based on facility tracking data from Oil and Gas Watch, chemical emissions factors from the C-THRU project, and reported chemical production volumes and carbon capture rates.
With this research note, we aim to enhance the growing understanding of the GHG emissions implications of US petrochemical production by combining the following modeling approaches in a novel way. We derive the growth in production and emissions from both a top-down approach based on macroeconomic projections, as well as a bottom-up approach based on announced petrochemical facilities. We also incorporate the full range of lifecycle emissions inclusive of upstream and end-of-life emissions, in addition to the emissions from the direct manufacturing of these chemicals. We outline our methodology for this lifecycle assessment in the next section.
Quantifying the lifecycle emissions footprint of the US petrochemical industry
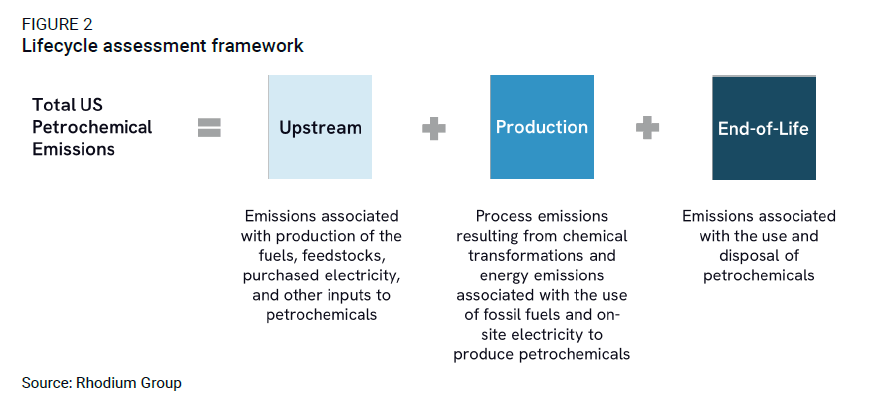
To capture the full GHG emissions impact of the US petrochemical industry, we conducted lifecycle assessments for a range of petrochemical commodities, which quantify the emissions that result from three stages of a petrochemical’s lifetime. We estimate the production emissions—the emissions that occur directly at petrochemical manufacturing plants resulting from chemical transformations, as well as energy emissions associated with the on-site combustion of fossil fuels to generate heat and power. We also estimate upstream emissions, which are the emissions associated with the inputs to manufacturing, like the production and transportation of oil and natural gas and the generation of electricity. We separately estimate end-of-life emissions, which are the emissions that result from the use and disposal of major petrochemical products. Taken together, these individual chemical assessments and our end-of-life analysis quantify the total carbon footprint of the US petrochemical industry (Figure 2).
As this analysis focuses on the US, we do not estimate the emissions from petrochemicals that are produced elsewhere and imported into the country. However, the emissions impact of petrochemicals that are produced in the US and then exported are included in our upstream and production emissions. We report our results using 100-year global warming potential (GWP100) conversions for non-CO2 GHGs to align with US government standards. Given that 20-year global warming potential (GWP20) conversions are often used when discussing short-lived climate pollutants like methane, we also note GWP20 emissions estimates for context.
Upstream and production emissions
We estimate emissions for each chemical in our analysis by multiplying production volumes by upstream and production emissions factors. We determine the 2023 production volume of each petrochemical using data from GlobalData Industry Outlook, the US Geological Survey (USGS), academic literature, and other available estimates. We construct chemical-specific emission factors primarily using Argonne National Lab’s 2024 R&D Greenhouse gases, Regulated Emissions, and Energy use in Technologies (GREET) lifecycle analysis model. We also incorporate data from the American Chemistry Council and the US Lifecycle Inventory in specific cases.
GREET provides a useful framework for quantifying petrochemical emissions, but we make several modifications. We first disaggregate upstream emissions from production emissions for each chemical. To avoid double-counting, we also remove emissions associated with primary chemical inputs to derivative chemicals from the derivative totals, as these emissions are already accounted for.
In addition, we vary the fugitive methane emissions rate from oil and gas production to construct low and high scenarios. Fugitive methane emissions occur in the production of oil and natural gas, as well as in the processing, transmission and storage, and distribution of natural gas. There are many reasons for these emissions at each step of the process, including venting of methane produced at oil well sites without connections to natural gas infrastructure, leaks from equipment such as pneumatic devices that occur as part of the intended design of the equipment, and leaks from malfunctioning equipment. Quantifying the exact level of these emissions is an evolving science, as bottom-up approaches that measure emissions from individual processes and pieces of equipment and top-down approaches that use atmospheric measurements have often come to different conclusions. Some analysts use fugitive methane emissions rates developed in the Environmental Protection Agency (EPA)’s Inventory of Greenhouse Gas Emissions and Sinks as it facilitates easy comparison with official government figures. However, there is growing evidence in the academic and advocacy world that the actual current fugitive rate may be considerably higher. Our low case uses GREET’s default, EPA-aligned rate (0.69%), while the high case uses a higher rate (2.5%) based on our literature review.
End-of-life analysis
Emissions from the use and disposal of petrochemicals and their end products are generally less understood than their upstream and production emissions. It is widely recognized, however, that nitrogenous fertilizer application and plastic waste incineration are two major sources. Given the paucity of literature and data on other contributions to end-of-life emissions, we focus on these two sources in our analysis. To quantify current fertilizer application emissions, we look to EPA’s latest US Greenhouse Gas Inventory. For plastic waste, we take EPA data on the quantity of plastic waste by plastic type that is incinerated and landfilled and multiply by plastic-specific GREET incineration and landfilling emissions factors. We apply the same end-of-life emissions to our low and high scenarios.
Projecting future emissions
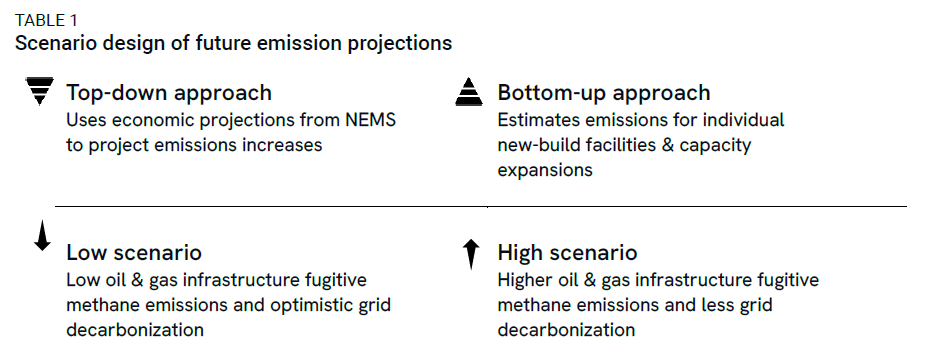
In this analysis, we also explore how US petrochemical emissions are projected to change between now and 2030. Important factors that will influence future petrochemical emissions include how much of any given petrochemical will be produced, how technological changes might influence the amount of GHGs produced in manufacturing a given petrochemical, and the extent to which policy might incent or require emission reductions. To incorporate this uncertainty, we vary two major facets of emissions uncertainty to estimate petrochemical’s footprint in 2030 (Table 1):
- top-down and bottom-up chemical production volume estimation methodologies, and
- low versus high emissions factors that account for uncertainty in fugitive methane emissions rates and grid decarbonization.
Our top-down approach is based on the projected growth of petrochemicals as part of the US economy. We pull chemical-specific growth rates based on macroeconomic growth projections from our Taking Stock 2024 report and apply them to the 2023 chemical production volumes from the current emissions component of this analysis.
The bottom-up approach holds production from existing facilities flat, creates individual facility estimates for each new facility, and aggregates them together. For new facilities, we identified the proposed, under construction, and on-hold facilities producing in-scope chemicals in the Environmental Integrity Project’s Oil and Gas Watch (O&GW) database. We then multiply capacity information for each facility by a capacity utilization rate.
In addition to commodity production estimates, oil and gas production fugitive methane emissions and grid emissions will also be major determinants in future petrochemical emissions levels. To account for these two major sources of uncertainty, we project future emissions using low and high emissions scenarios. The underlying details of these scenarios can be found in the technical appendix.
Current US petrochemical lifecycle emissions comprise 5% of total US emissions
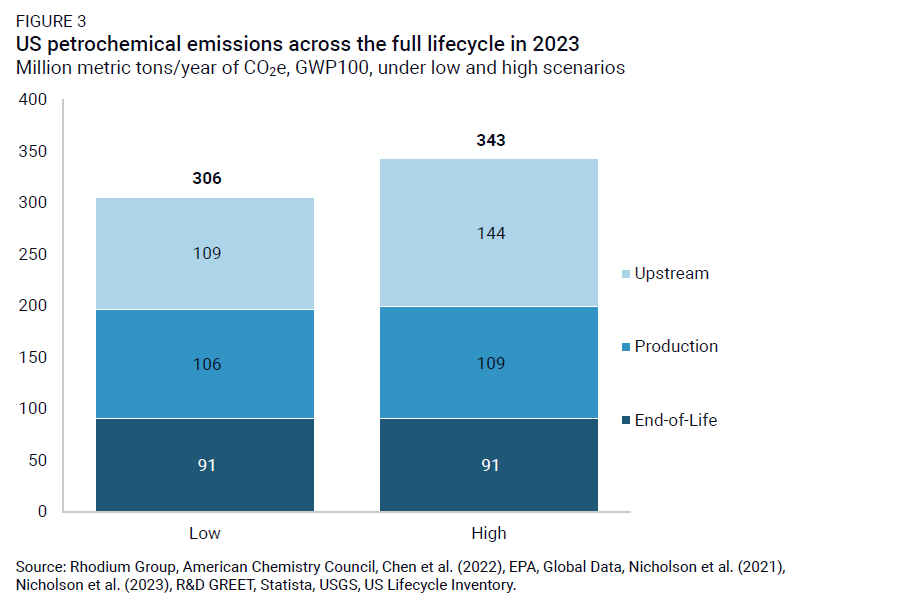
Like any lifecycle analysis, total US petrochemical emissions estimates vary depending on the underlying sensitivities. Assuming GWP100 and EPA’s fugitive methane emissions rates, we find that US petrochemical emissions totaled 306 million metric tons (MMT) of CO2e per year in 2023 (Figure 3). Under higher fugitive methane emissions rates, US petrochemical emissions totaled 343 MMT per year. 1
All together, this means that petrochemical emissions were responsible for around 5% of total US emissions in 2023—a significant impact. To put this into perspective, petrochemical emissions are slightly greater than the direct annual emissions from the country of Poland and greater than the direct annual emissions from Florida (the third highest-emitting state in the US).
As shown in Figure 3, upstream emissions are as important, if not more important, to this total than emissions at the point of production. Moreover, since both GWP and fugitive methane emissions rates influence how methane is accounted for in the lifecycle analysis, we see upstream emissions changing the most under varying scenarios as this is where the bulk of methane emissions occur.
The footprint of primary and derivative petrochemicals
In tracing the flow from fossil fuels to petrochemical end products, the group of eight primary chemicals are the first stop. These chemicals are directly derived from petroleum fractions and natural gas liquids. Primary chemicals are also the key chemical building blocks required to produce tens of thousands of other chemicals, which we refer to as derivatives.
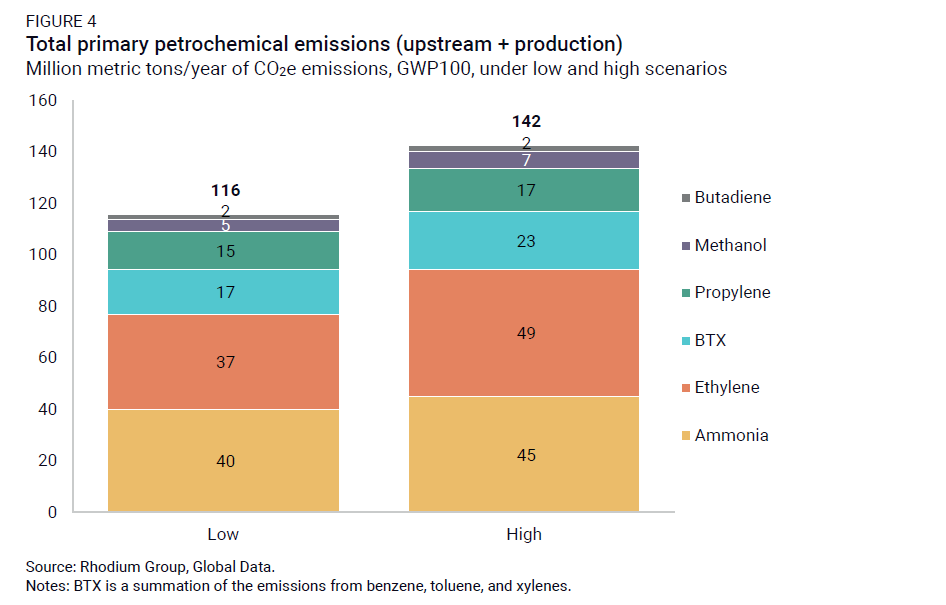
Depending on the fugitive methane emissions rate applied, primary petrochemicals account for 116 to 142 MMT of CO2e emissions per year under GWP100 (Figure 4).2 Within primary petrochemicals, emissions associated with producing ammonia and ethylene are responsible for roughly two-thirds of all primary petrochemical emissions. Ammonia is primarily used in the production of fertilizers, but it has a host of other uses in chemical production, refrigeration, and water treatment. Ethylene is used in the production of plastics, rubber, and myriad other chemical products.
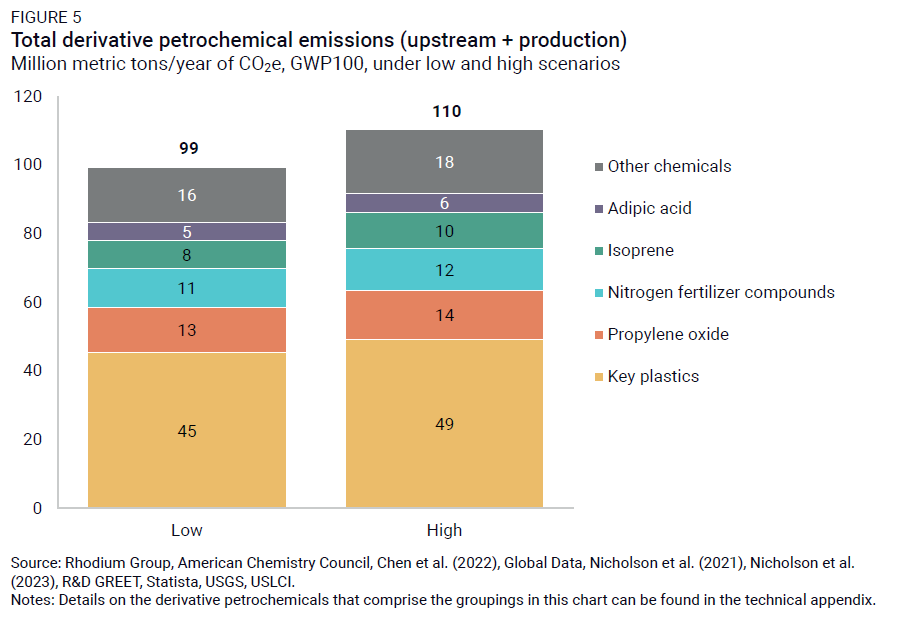
In this analysis, we also explore the emissions associated with derivative petrochemicals with the highest combined emissions intensities and production volumes. Assuming GWP100, derivative petrochemicals’ upstream and production emissions account for 99 to 110 MMT of CO2e per year, depending on the fugitive methane emissions rate applied (Figure 5).3 Among derivatives, emissions from turning primary petrochemicals into key plastics drive the largest portion of emissions, but the sources of emissions are less concentrated than in primary petrochemicals.
Petrochemical emissions are set to rise by 6 to 32% by 2030
As part of this analysis, we also explore how US petrochemical emissions are projected to change by the end of the decade. Our findings show emissions associated with US petrochemical production will rise across all approaches and scenarios we consider. Assuming GWP100, the range of petrochemical emissions in 2030 is 324 to 451 MMT of CO2e (Figure 6), representing a 6-32% increase from 2023 levels.4 This puts petrochemical emissions at 6-7% of total US emissions in 2030—up from 5% in 2023. Even with gains of emissions-reducing regulations and efforts to clean up the grid, these efforts do not counteract the growth of the petrochemical industry, resulting in an increase in emissions.
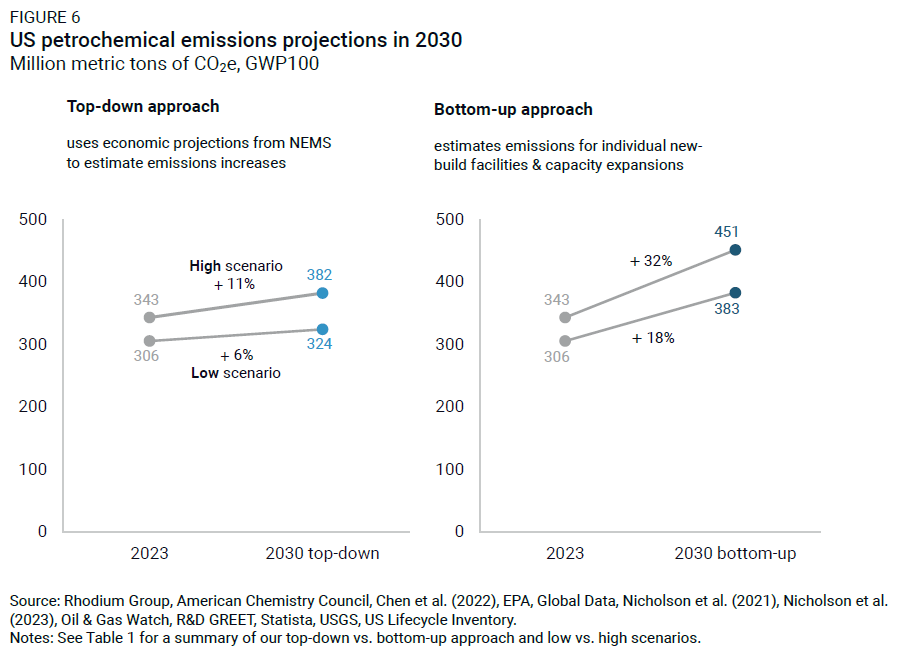
The bottom-up results factor in the capture of 62 MMT of CO2 through the use of point-source carbon capture at petrochemical production facilities. In our emissions estimates, we also net out increased emissions from the use of fossil fuels and electricity to power those capture processes. As Figure 6 shows, emissions increase meaningfully more using the bottom-up approach; we unpack these differences in greater detail in the following sections.
Key drivers of projected petrochemical growth
The largest sources of uncertainty in our future petrochemical emissions estimates are how much new ammonia and, to a lesser extent, ethylene production capacity ultimately come online by decade’s end and the level of methane emissions associated with the production and transmission of natural gas and oil—two primary inputs into petrochemical production.
Ammonia & ethylene drive differences in top-down vs bottom-up estimates
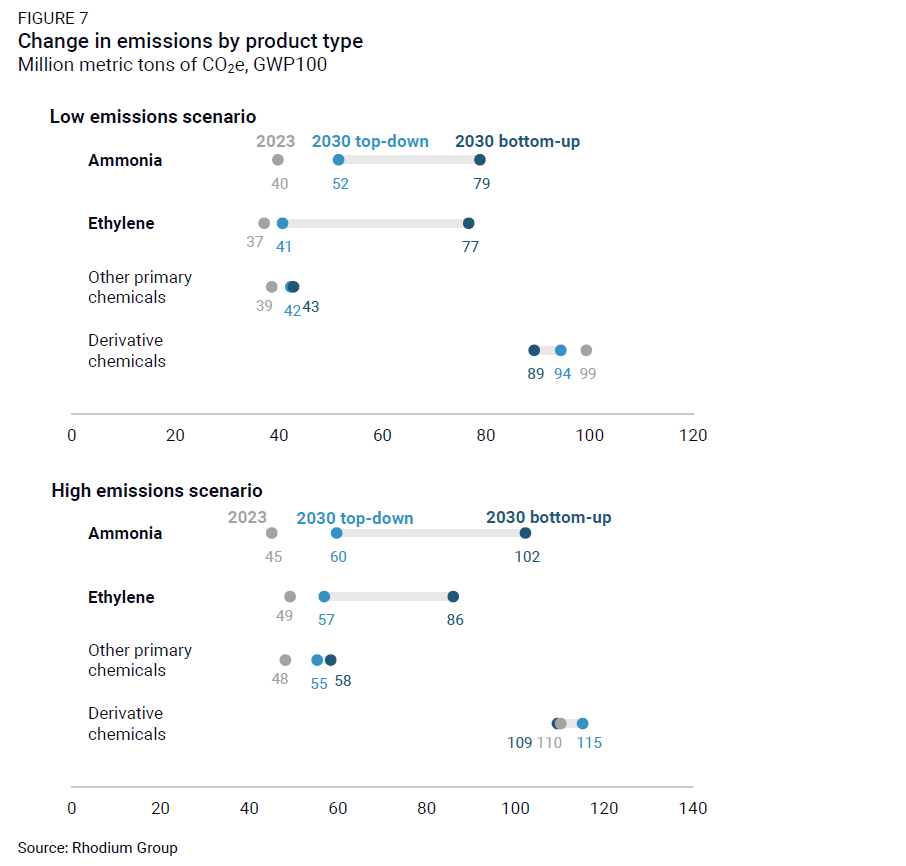
We find the single largest driver of increased annual petrochemical emissions is ammonia production. Ammonia alone could contribute an increase of 12 to 57 MMT of CO2e per year in 2030 (Figure 7). As shown in Figure 4, ammonia is one of the most GHG-intensive petrochemical processes and one of the largest sources of GHG emissions in the petrochemical industry currently. Today, it is mainly produced for use in fertilizers. However, global growth in the market for hydrogen as a low-carbon fuel (along with challenging economics for transporting hydrogen) is leading to interest in ammonia as a hydrogen carrier. Ammonia itself can be combusted for energy without emitting CO2, and there is growing interest in using ammonia as a fuel in shipping, power generation, and other applications.
Some of the proposed ammonia facilities in the O&GW database that we use include these new applications in their stated end uses, but not all facilities report intended uses and many state multiple uses. It is also not clear how many of these facilities will ultimately get built, and to what degree they will replace production at existing facilities versus add to ammonia demand. As a result, ammonia is the petrochemical product with the greatest level of uncertainty in terms of its future emissions impacts.
New ammonia applications come with the risk of significant end-of-life emissions. Based on a literature review and analysis of proposed ammonia facilities in the O&GW database, we find that this buildout could lead to an additional 54-138 MMT of N2O emissions as converted to CO2e from ammonia combustion and leakage. The primary source of these estimated emissions is that a small portion of ammonia fuel will incompletely combust, leading to unwanted chemical reactions that yield N2O. The other source of these emissions is the atmospheric conversion of leaked ammonia to N2O. Much like methane, ammonia can leak during production and in supply chain infrastructure. Accounting for these emissions would result in 2-3x higher emissions from the O&GW ammonia facilities than we currently account for in our lifecycle assessment. Because there is a paucity of data on ammonia leakage and combustion emission rates and the market for ammonia as a fuel and hydrogen carrier does not yet exist, these estimates are highly uncertain. As a result, we do not include them in our topline emissions estimates. These emissions could be significantly reduced or avoided altogether through optimal system and policy design.
Behind ammonia, the second biggest driver of growth and uncertainty in annual petrochemical emissions is ethylene. We see an increase of 4 to 37 MMT of emissions per year attributable to ethylene production in 2030. The US has a pricing advantage in producing ethane and ethylene because of cheap domestic natural gas. Therefore, domestic producers see a big opportunity for expanded production and see it as strategic to build out ethylene capacity. We have already seen increases in ethane and ethylene exports consistent with this dynamic. The buildout of ethylene facilities in our bottom-up scenario based on O&GW data likely reflects this dynamic; however, it may be less well-captured in our top-down scenario based on US macroeconomic projections. While we capture the cradle-to-gate emissions impact of US-produced ethylene that is exported in our analysis, we do not characterize emissions that result abroad from the cracking of US ethane. We estimate that these emissions are likely on the order of 2 to 3 MMT per year. Because ethylene is a globally traded product, it is unclear just how much additional exportation the market can support.
Assumptions around upstream emissions also drive differences between scenarios
To identify which factors had the largest impact on emissions outcomes within our top-down and bottom-up scenarios, we explored the leading contributions to differences between our low and high results. These insights can help identify areas in which targeted policy efforts could be most successful in abating future petrochemical emissions.
We found that in addition to the chemical production volumes discussed above, upstream emissions assumptions also drive differences between scenarios. In Figure 8, we use a waterfall chart to illustrate the magnitude individual upstream factors may have on emissions outcomes. The bookend bars in this chart are the low and high emissions totals in 2030 from our top-down approach; however, the relative magnitude of the factors’ contributions to uncertainty is the same in our bottom-up approach.
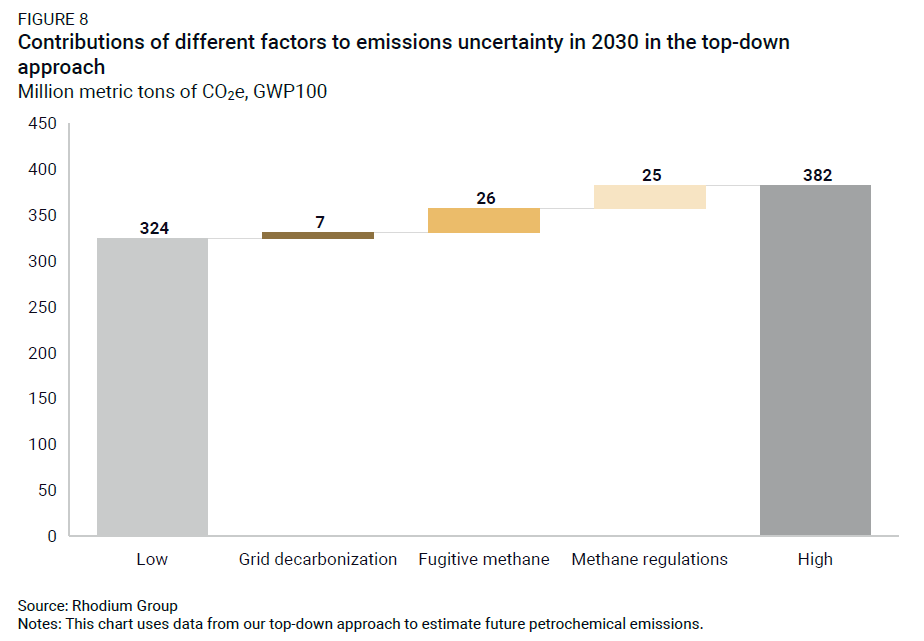
In terms of upstream factors, uncertainty around the future of methane emissions has the biggest impact on the 2030 emissions range. Fugitive methane emissions in the production and transportation of fossil fuel contribute significantly to the overall emissions footprint of petrochemicals due to the industry’s reliance on natural gas and oil as both fuels and feedstocks. In our top-down approach, we see an increase of 26 MMT in emissions in 2030 between our high and low fugitive methane emissions rate scenarios.
Furthermore, the Biden administration finalized regulations in December 2023 aimed at pushing down this fugitive emissions rate further. If these regulations are successfully enacted, they would account for an emissions reduction of 25 MMT of CO2e in 2030 in our top-down approach. However, the fate of those regulations is quite uncertain. The Trump administration could repeal these finalized regulations and potentially replace them with their own version that results in fewer emission reductions. Regardless of action in the executive branch, the federal judiciary could also opt to invalidate the finalized regulations.
A dirtier grid can also increase petrochemical emissions, though to a lesser extent. While most electricity consumed in the manufacture of petrochemicals is generated on-site, a significant amount comes from the grid. The grid has been trending cleaner and cleaner over the past decade, and we have previously estimated that trend to continue given support in the Inflation Reduction Act for clean electricity generators like wind and solar as well as new EPA regulations aimed at reducing emissions from new and existing coal plants and new gas plants. But precisely which pathway the US is on in the power sector remains unclear.
Reducing petrochemical emissions is critical to long-term decarbonization
Petrochemicals are ubiquitous across the US (and global) economy today, and our analysis suggests they are likely to grow in their contribution to GHG emissions over the rest of this decade. The production of petrochemicals emits GHGs in creating the heat and power needed for these industrial processes as well as, in some cases, chemical reactions inherent in today’s common production processes. Petrochemical production is also reliant on fossil feedstocks, specifically natural gas and crude oil in the US, which have emissions associated with their extraction, transportation, and processing. Lastly, the use and disposal of petrochemical products contribute further to the emissions footprint of this industry.
Despite a growing amount of interest and literature in this space, data availability remained a challenging barrier to overcome throughout our analysis. Overall, this field of research would benefit from increased transparency and regularly updated reporting on petrochemical production levels and associated GHG emissions. There is sparse public reporting of facility-level petrochemical production volumes; some proprietary data is available but is generally limited and subject to use restrictions. Moreover, petrochemical manufacturing facilities are generally quite complex and often produce a variety of products with multiple sources of GHG emissions. Clear, granular reporting of the sources of emissions within a facility would help improve our ability to more precisely comment on future emissions growth. In addition, as we’ve discussed throughout the report, newly released research often drives a reassessment of assumptions on key sources of emissions, including oil and gas system methane and ammonia leakage and combustion emission rates. Continued work in this space can further improve emissions estimates associated with these sources. Finally, given the small but increasing level of exports of petrochemicals and their feedstocks, leveraging the work of groups like C-THRU and others can help improve our understanding of emissions for which the US petrochemical industry is at least partially responsible.
Reducing GHG emissions from the petrochemical industry is not a straightforward exercise. Demand for many of these items is growing, and today there are commonly few viable, demonstrated substitutes for them. However, progress could be made by reducing demand for end products, developing substitutes for these chemicals, and cleaning up the current upstream, production, use, and disposal processes. While it may be challenging, the US cannot decarbonize without reducing GHG emissions in the industrial sector more broadly, and in petrochemical production in particular. Additional policy action targeting emissions reductions across the entire petrochemical lifecycle will be critical to any effort for the US to reach deep decarbonization.
This nonpartisan, independent research was conducted with support from the Resources Legacy Fund as part of Beyond Petrochemicals. The results presented reflect the views of the authors and not necessarily those of the supporting organization.
Footnotes
Assuming GWP20, US petrochemical lifecycle emissions total 340 to 445 MMT of CO2e per year in 2023.
Under a GWP20, primary petrochemical emissions total 140 to 214 MMT of CO2e per year.
Assuming GWP20, derivative emissions total 110 to 140 MMT of CO2e per year.
Assuming GWP20, the range of 2030 emissions is 351 to 603 MMT of CO2e.