Preliminary US Greenhouse Gas Emissions Estimates for 2020
Throughout 2020, we've been tracking real-time energy and emissions implications of COVID-19. Based on preliminary economic and energy data, we estimate that this historic shock to economic activity led to a 10.3% drop in US emissions in 2020.
2020 was an unusual year—in more ways than we can count—with lives upended by a global pandemic and its economic fallout. Across the US, measures put in place to slow the pace of infection affected all aspects of American life, reducing travel, altering demand for goods and services, and resulting in record-high unemployment. Throughout 2020, Rhodium Group has been tracking real-time energy and emissions implications of COVID-19 in our Green Stimulus and Recovery Tracker. Based on preliminary economic and energy data, we estimate that this historic shock to economic activity led to a 10.3% drop in US greenhouse gas (GHG) emissions in 2020. That is the single largest drop in annual emissions in the post-World War II era, outpacing the Great Recession of 2009 when emissions dipped 6.3%. This puts US GHG emissions below 1990 levels for the first time. With emissions down 21% below 2005 levels, this means the US is expected to far exceed its 2020 Copenhagen Accord target of a 17% reduction below 2005 levels. However, 2020 should not in any way be considered a down payment toward the US meeting its 2025 Paris Agreement target of 26-28% below 2005 levels. The emission reductions of 2020 have come with an enormous toll of significant economic damage and human suffering. With coronavirus vaccines now in distribution, we expect economic activity to pick up again in 2021, but without meaningful structural changes in the carbon intensity of the US economy, emissions will likely rise again as well.
COVID-19’s economic and emissions impact
The United States has been hit hard by the COVID-19 pandemic. In 2020, over 20 million Americans were infected, and over 350,000 have died. A patchwork of stay-at-home orders instituted by state and local officials in March and April were lifted in May and June, only to be reinstated as numbers began rising in advance of the winter holidays. Unemployment hit an all-time high of 14.7% in April at the peak of the lockdowns, declining to around 6.7% in November, but rising again in December, with an additional 787,000 Americans filing for unemployment by mid-month.
As a result, the US economy has taken a major hit. In October, the International Monetary Fund (IMF) forecasted that US GDP would decline 4.3% in 2020. End-of-year estimates by Bloomberg and Goldman Sachs put that number at around -3.5%. While significantly less drastic than the IMF’s April forecast of an 8% contraction, it goes well beyond the 2.5% contraction the US experienced during the Great Recession of 2009.
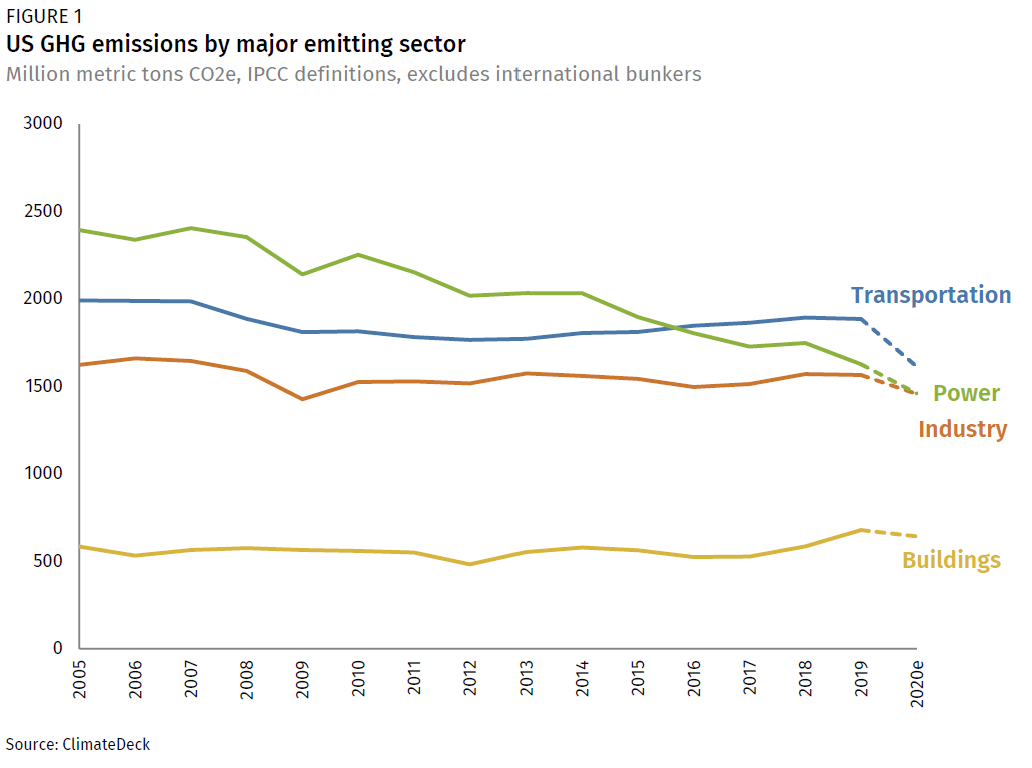
Several of the hardest hit economic sectors—including transportation, electric power, and industry—are also the leading sources of US GHG emissions. With the possible exception of the power sector—where coal’s decline has been driving a steady reduction in power sector emissions over the past decade—emission reductions in 2020 resulted largely from reductions in overall economic activity. Travel demand faced the steepest drop-off this year, leading to a 14.7% decline in transportation sector emissions between 2019 and 2020 (Figure 1). Power sector emissions dropped 10.3%—driven by a nearly 19% reduction in emissions from coal generation, year-on-year. That’s the largest year-on-year decline in recorded history, breaking last year’s record fall. Industrial emissions were down 7.0% and emissions from buildings were down 6.2%, year-on-year.
Since the early days of the pandemic, Rhodium has been tracking developments in how COVID-19 has impacted the US economy and the implications for energy and emissions. Details on the swings in energy and transportation demand, industrial production, and other metrics are available in our July Taking Stock 2020 report, as well as from our September report (Road to Recovery?), tracking impacts by major economic sectors for the US and other major economies, and our Green Stimulus and Recovery Tracker dashboards (with data for the US, EU, China and India). In the sections below, we summarize the overall impact on US emissions in 2020 for three key sectors: transportation, electric power, and industry.
Transportation
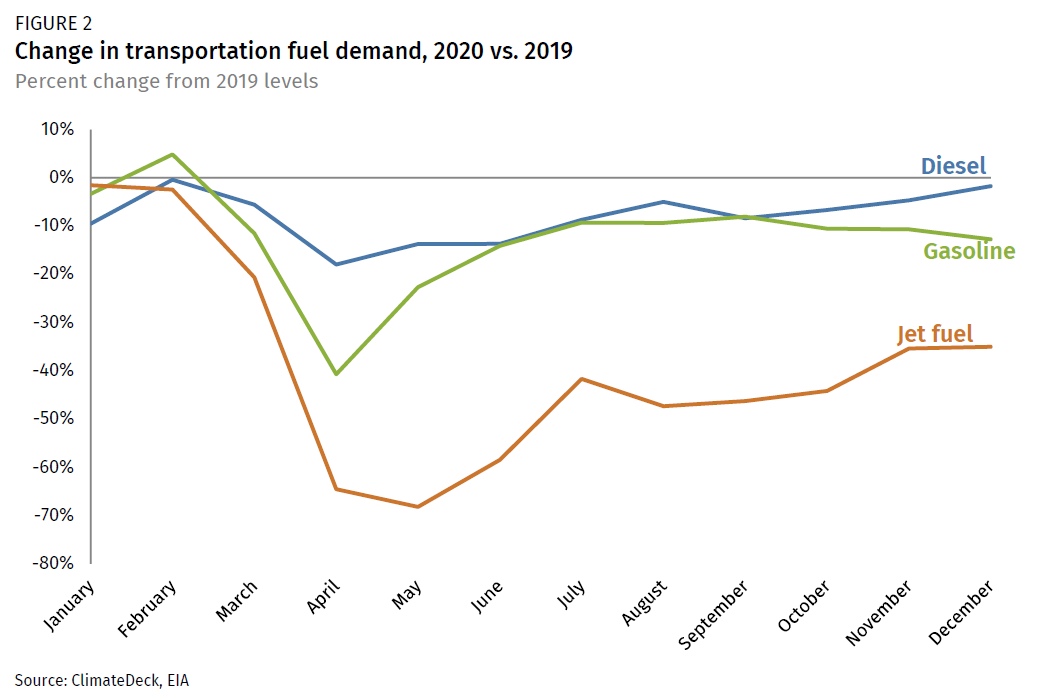
At the onset of the pandemic, many governors restricted non-essential travel, and bans on international flights were instituted to limit transmission of the virus. As a result, COVID-19’s most dramatic immediate effect was in the transportation sector. At the peak of lockdowns in April and May, jet fuel demand had dropped 68% from 2019 levels, with gasoline (primarily from passenger vehicles) down 40% and diesel (used in shipping and trucking) down 18% (Figure 2). Jet fuel demand has recovered somewhat but not yet fully—bouncing back to around 35% below 2019 levels in December based on preliminary data. Diesel—likely spurred by holiday deliveries—returned to near 2019 levels in December (Figure 2).
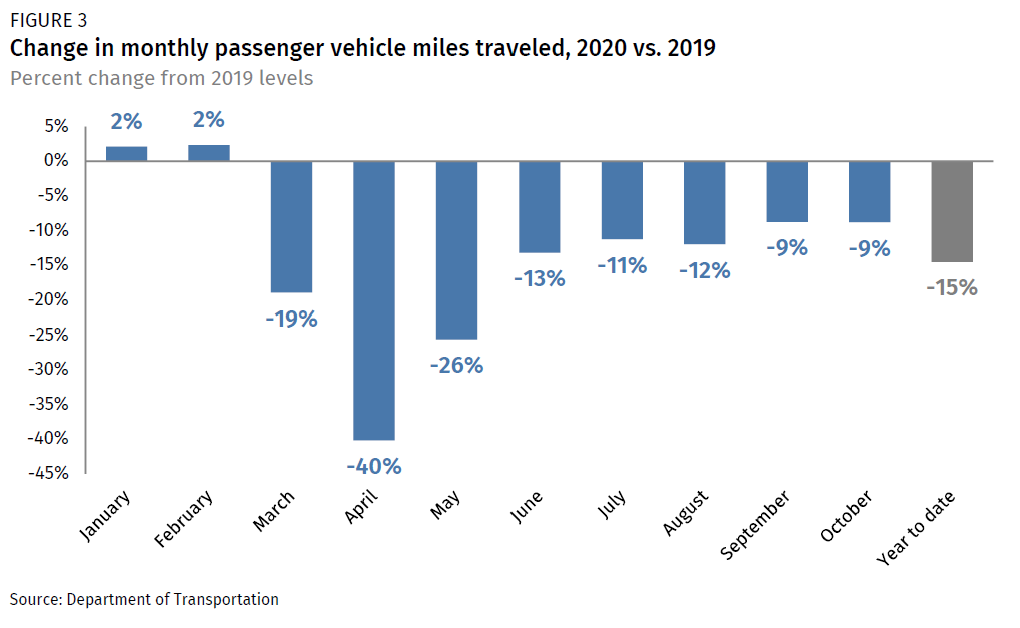
Passenger travel bounced back very quickly after travel restrictions were lifted in May and June in most regions. The first round of shelter-in-place orders led to a sharp decline in passenger vehicle travel (measured by vehicle-miles-traveled or VMT), dropping 40% year-on-year at its peak in April. But travel recovered quickly by June (down only 13%) with a more gradual recovery through October (the last month of available data). Average VMT for the period between January and October was down 15% from 2019 levels (Figure 3).
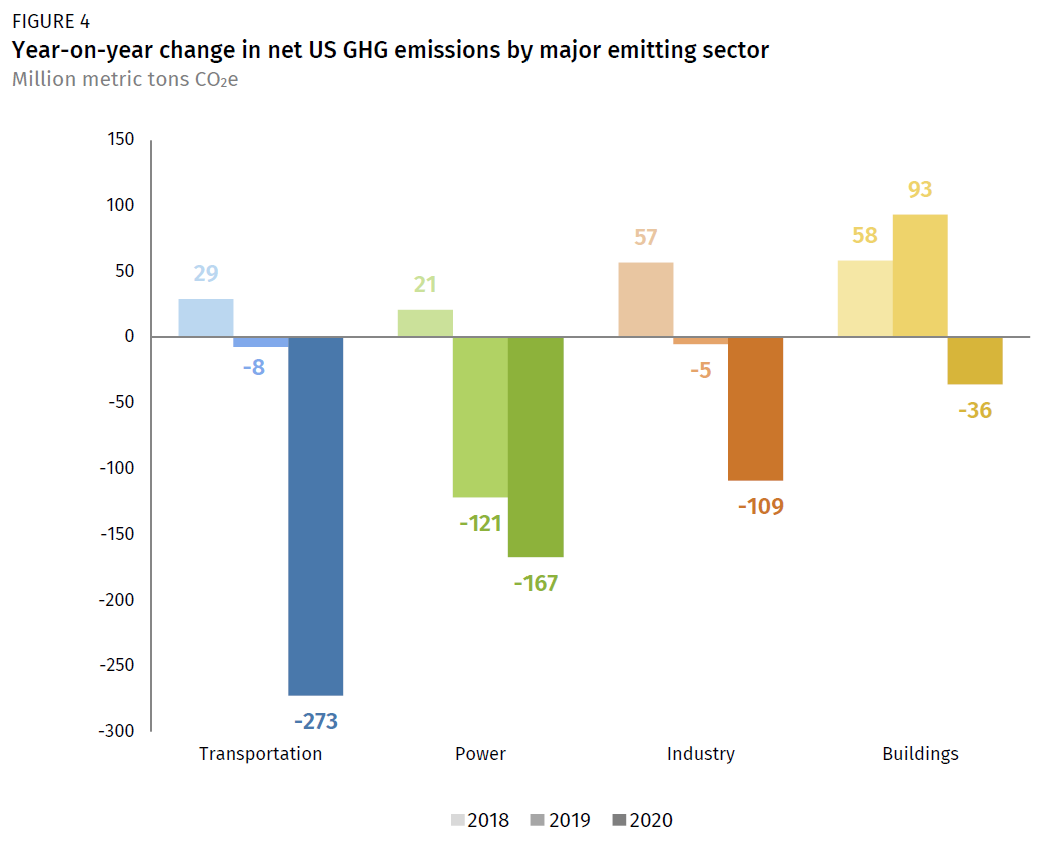
As a result, the transportation sector, which accounts for 31% of net US emissions, experienced the largest decline in GHG emissions, dropping 273 million metric tons below 2019 levels, dwarfing the modest decline between 2018-2019 of 8 million tons of CO2e (Figure 4).
Electric power
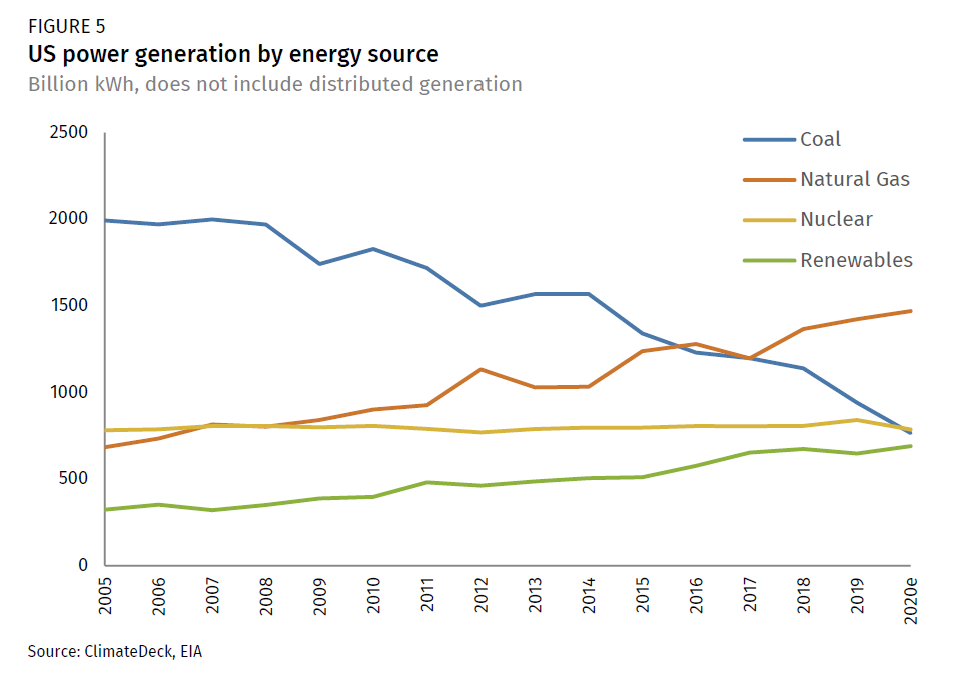
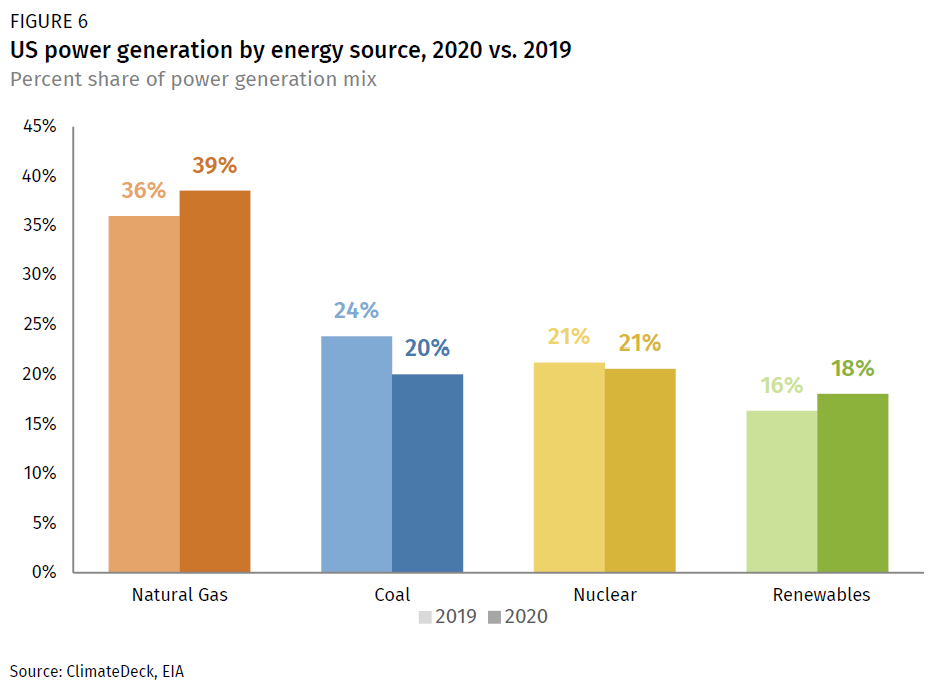
The electric power sector (which accounts for 28% of net US emissions) saw the second largest decline in GHG emissions from 2019 levels, dropping 167 million metric tons (or 10.3%) below 2019 levels (Figure 4). This was driven almost exclusively from the continued rapid decline of coal-fired power generation, rather than a drop in electricity demand (which was down only 2% year-on-year). In a Rhodium report from July (Taking Stock 2020), we projected that power sector emissions were on track to drop as much as 7% this year before the pandemic hit due to changing market dynamics. This momentum behind coal’s decline was only accelerated by weakened electric power demand during the course of the pandemic. After decades as the predominant fuel for US electric power, in 2020 coal became only the third largest fuel source after natural gas and nuclear, with renewables close behind (Figure 5). In 2020, coal’s share of US power generation dropped from 24% to 20%, with natural gas and renewables picking up most of the slack, rising to 39% and 18%, respectively (Figure 6). The uptick in natural gas generation offsets more than 10% of the reduction in emissions from coal-fired power.
Industry
The impact on US industrial activity (which accounts for 27% of net US GHG emissions) has been mixed. In March, overall US industrial activity was down 5% year-on-year. In April and May, the decline grew to 16%—just short of the 18% year-on-year decline experienced during the worst of the Great Recession. But production recovered through the summer and flattened out around 6-7% down for the second half of the year. With production likely to pick up next year, industry is poised to surpass power as the second largest source of emissions in the US in 2021 behind transportation.
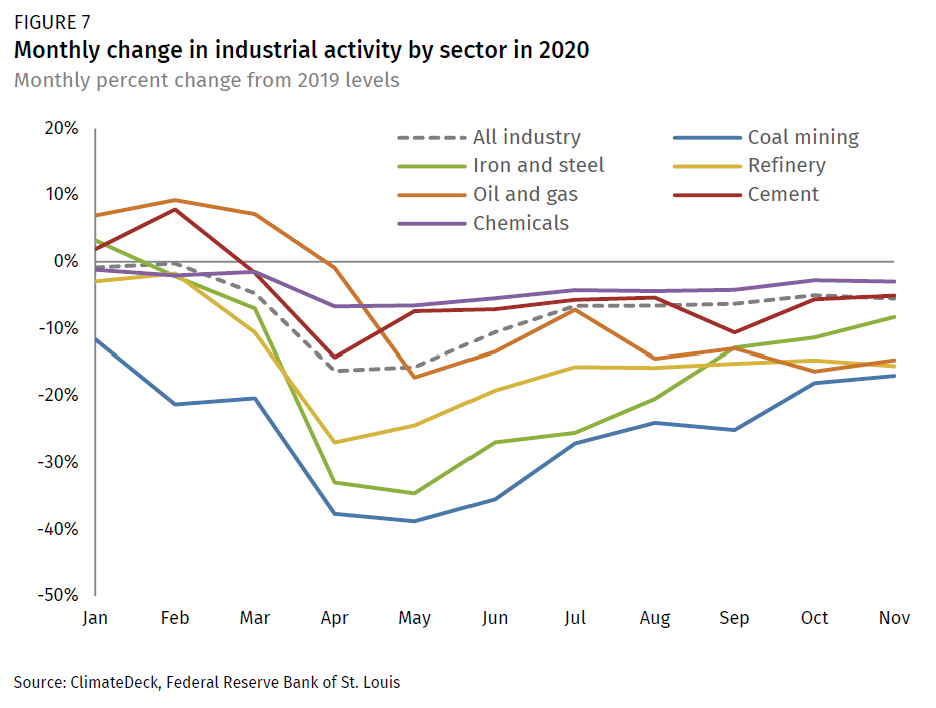
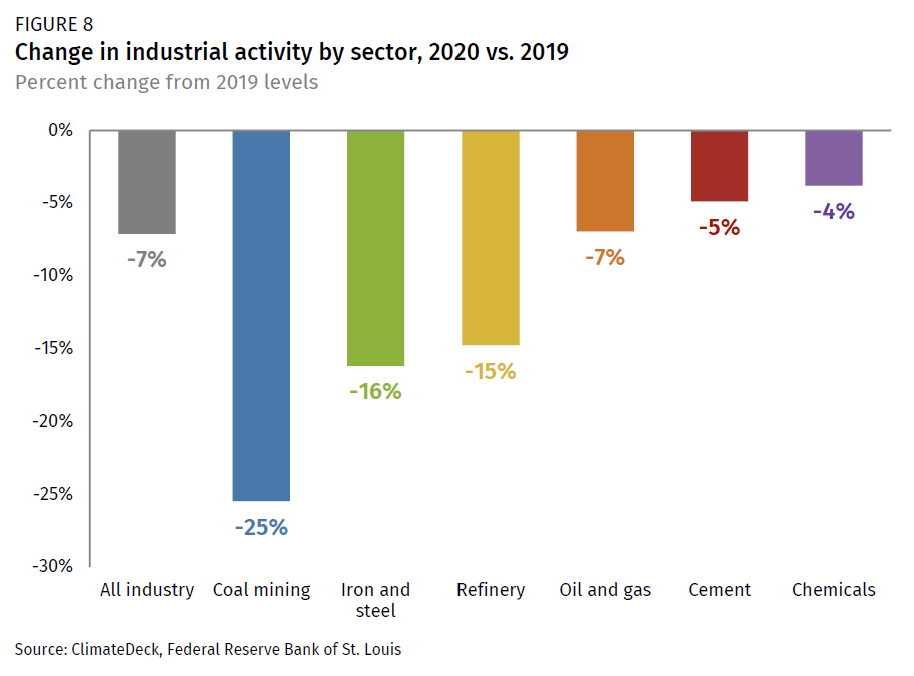
Overall, industrial activity was down about 7% from 2019 levels, but output of some energy-intensive goods has fallen even faster than overall industrial production. Coal mining, for example, was down 38% in April, iron and steel production fell 33% and refinery activity was down 27%, year-on-year (Figure 7). Cement production did not fall as fast as iron and steel and recovered more quickly by May. Oil and gas production hit peak decline in May at 17% below 2019 levels but has been slow to recover. Chemicals were largely unaffected. Oil and gas, cement and chemical production all ended the year down only 4-7% from 2019 levels (Figure 8). Coal mining, iron and steel, and refinery activity were down 25%, 16% and 15% year-on-year, respectively.
US meets Copenhagen Accord target, but no down payment on Paris Agreement target
Based on preliminary 2020 data, we estimate that net economy-wide US GHG emissions fell by 10.3% in 2020, to 5,160 million metric tons of CO2-equivalent.[1] That represents the single largest drop in annual emissions in the post-World War II period, and far outpaces the record 6.3% drop in emissions in 2009 during the Great Recession. As a result, US emissions drop below 1990 levels for the first time in three decades. Compared to 2005 levels, the US reduced emissions by 21.5%, exceeding its Copenhagen Accord commitment of 17% below 2005 levels by 2020 (Figure 9).
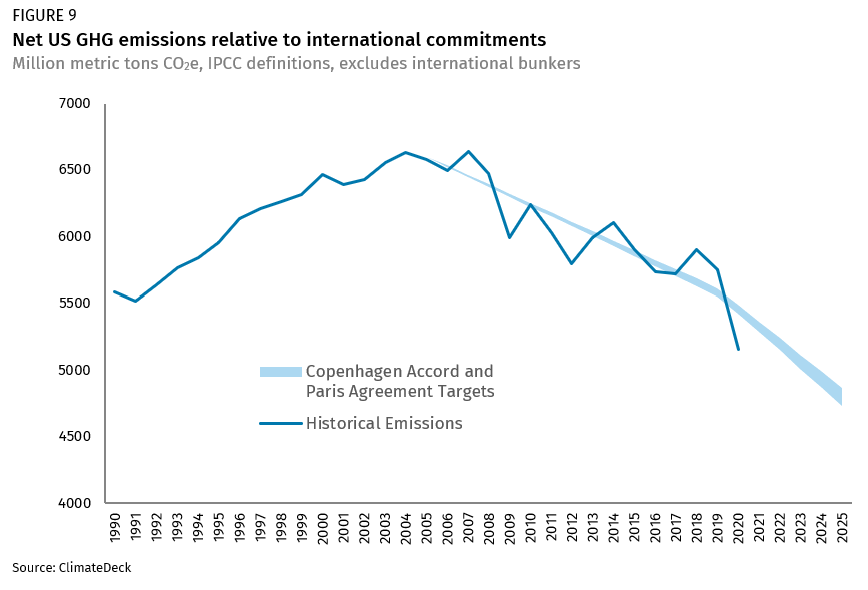
Unfortunately, 2020 tells us little about what we can expect to see in 2021 and beyond. It certainly shouldn’t be considered a down payment toward meeting the 2025 US target under the Paris Agreement of 26-28% below 2005 levels. The enormous toll of economic damage and human suffering as a result of the pandemic is no cause for celebration. The vast majority of 2020’s emission reductions were due to decreased economic activity and not from any structural changes that would deliver lasting reductions in the carbon intensity of our economy. If COVID-19 and the resulting recession hadn’t happened, we estimate that US emissions would have declined by only around 3% this year, driven in large part by the decline of coal-fired power generation and to a lesser extent the reduction in heating demand due to warmer winter weather. With growth expected to bounce back in 2021 (most forecasts currently project GDP growth of 3 to 4%), emissions will likely increase as well absent a concerted effort.
[1] Data on emissions and removals from land use, land use change and forestry (LULUCF) and agriculture for 2019 and 2020 are not available. To estimate net GHG emissions in 2019 and 2020, we assume US LULUCF and agricultural emissions remain flat at 2018 levels.