Preliminary US Greenhouse Gas Emissions Estimates for 2024
Since peaking in 2004, US emissions have trended downward in a bumpy fashion. But after a significant decline in 2023, we estimate that 2024 emissions were down by just 0.2% year-on-year while the economy grew by 2.7%.
In 2024, US greenhouse gas (GHG) emissions did something a bit unusual—they stayed nearly unchanged from last year. Since peaking in 2004, emissions have trended downward in a bumpy fashion. But after a significant decline in 2023, we estimate that 2024 emissions were down by just 0.2% year-on-year while the economy grew by 2.7%, continuing a decoupling of emissions and economic activity. Emissions are still below pre-pandemic levels and remain about 20% below 2005 levels, the benchmark for US commitments under the Paris Agreement.
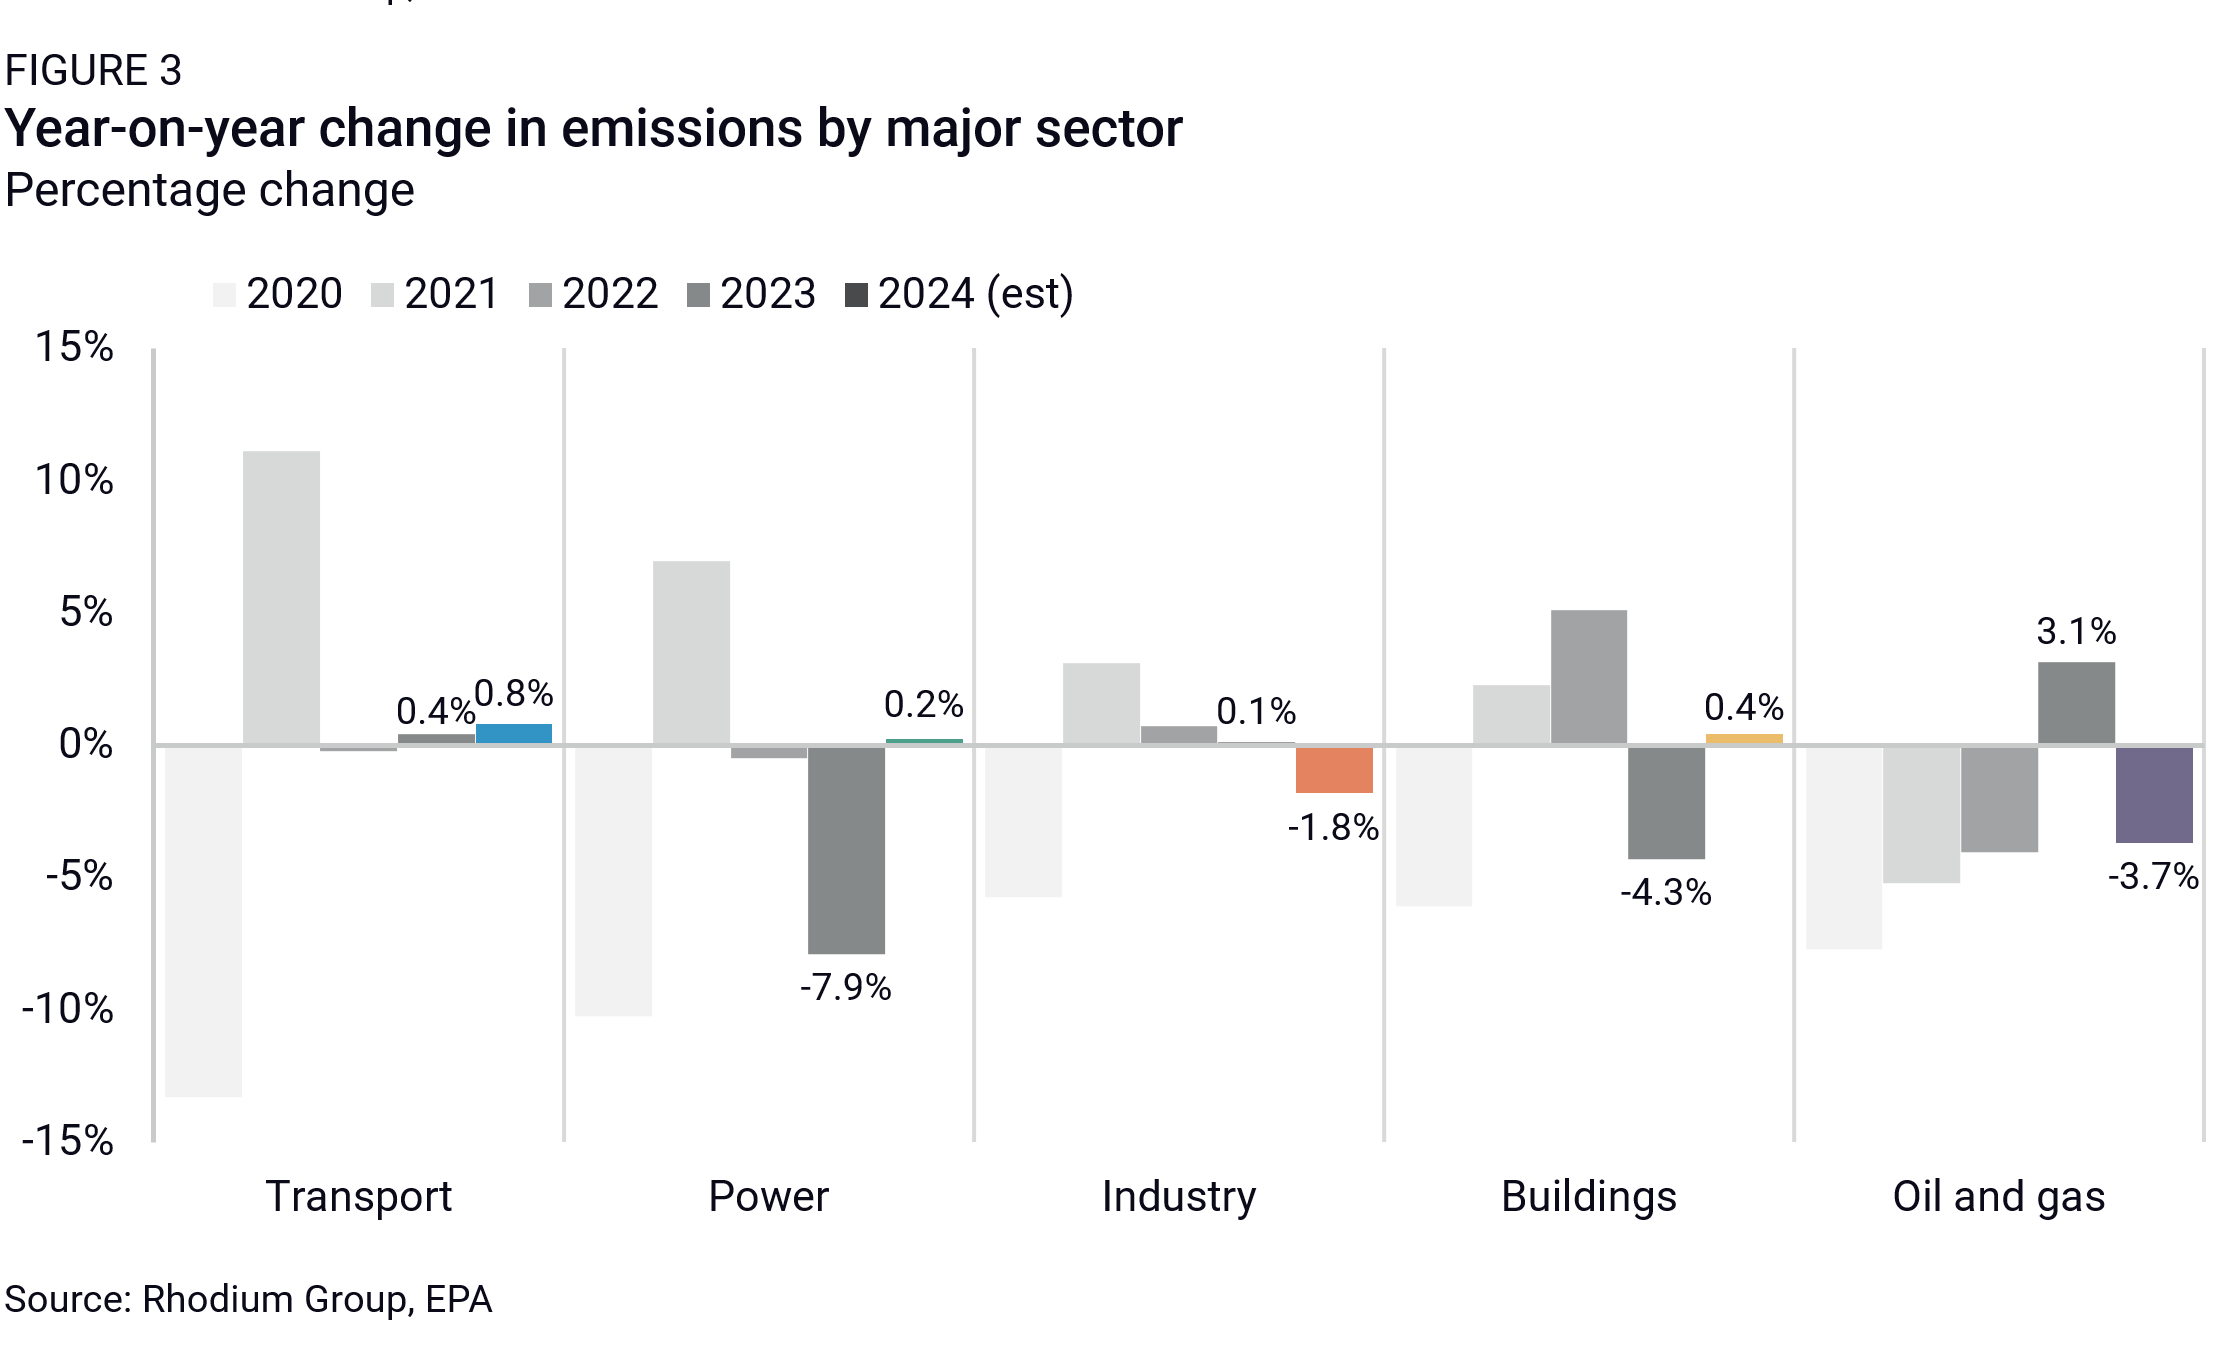
Lower manufacturing output drove the overall decrease in 2024 emissions, with industrial sector emissions falling by 1.8%. In the oil and gas sector, continued reductions in methane emissions intensity led to a 3.7% drop in emissions. Increased air and road travel partially offset these reductions, which drove up transportation sector emissions by 0.8%. Demand for electricity—led by the residential sector—also rose by 3% and was met by higher natural gas, wind, and solar generation, while coal generation saw just a slight decline. For the first time, combined solar and wind generation surpassed coal, although overall power sector emissions increased by a slight 0.2%. In the buildings sector, emissions crept up 0.4% due to slightly elevated fuel use. The modest 2024 decline underscores the urgency of accelerating decarbonization in all sectors. To meet its Paris Agreement target of a 50-52% reduction in emissions by 2030, the US must sustain an ambitious 7.6% annual drop in emissions from 2025 to 2030, a level the US has not seen outside of a recession in recent memory.
Economic growth and slightly lower emissions in 2024
Economic growth is one of the major determinants of GHG emissions, and in 2024, the US gross domestic product (GDP) expanded at a projected annual rate of 2.7%. This growth was driven by strong consumer spending as well as public and private investment, despite persistent inflation, high interest rates, and elevated labor and materials costs. Clean technology played a significant role. Record-high investment in the manufacturing and deployment of clean technologies accounted for 5% of total private investment in structures, equipment, and durable consumer goods in Q3, according to the latest data from the Clean Investment Monitor, a joint effort between Rhodium Group and MIT’s Center for Energy and Environmental Policy Research (CEEPR).
While the economy grew, we estimate that US GHG emissions fell slightly in 2024. The US will get its final GHG report card for 2024 when the EPA finalizes its annual GHG inventory in spring 2026. However, using preliminary economic and energy activity data, we project that economy-wide emissions declined by just 0.2% in 2024 (Figure 1). This puts US emissions at about 20% below 2005 levels, and down by 8% from pre-pandemic levels.

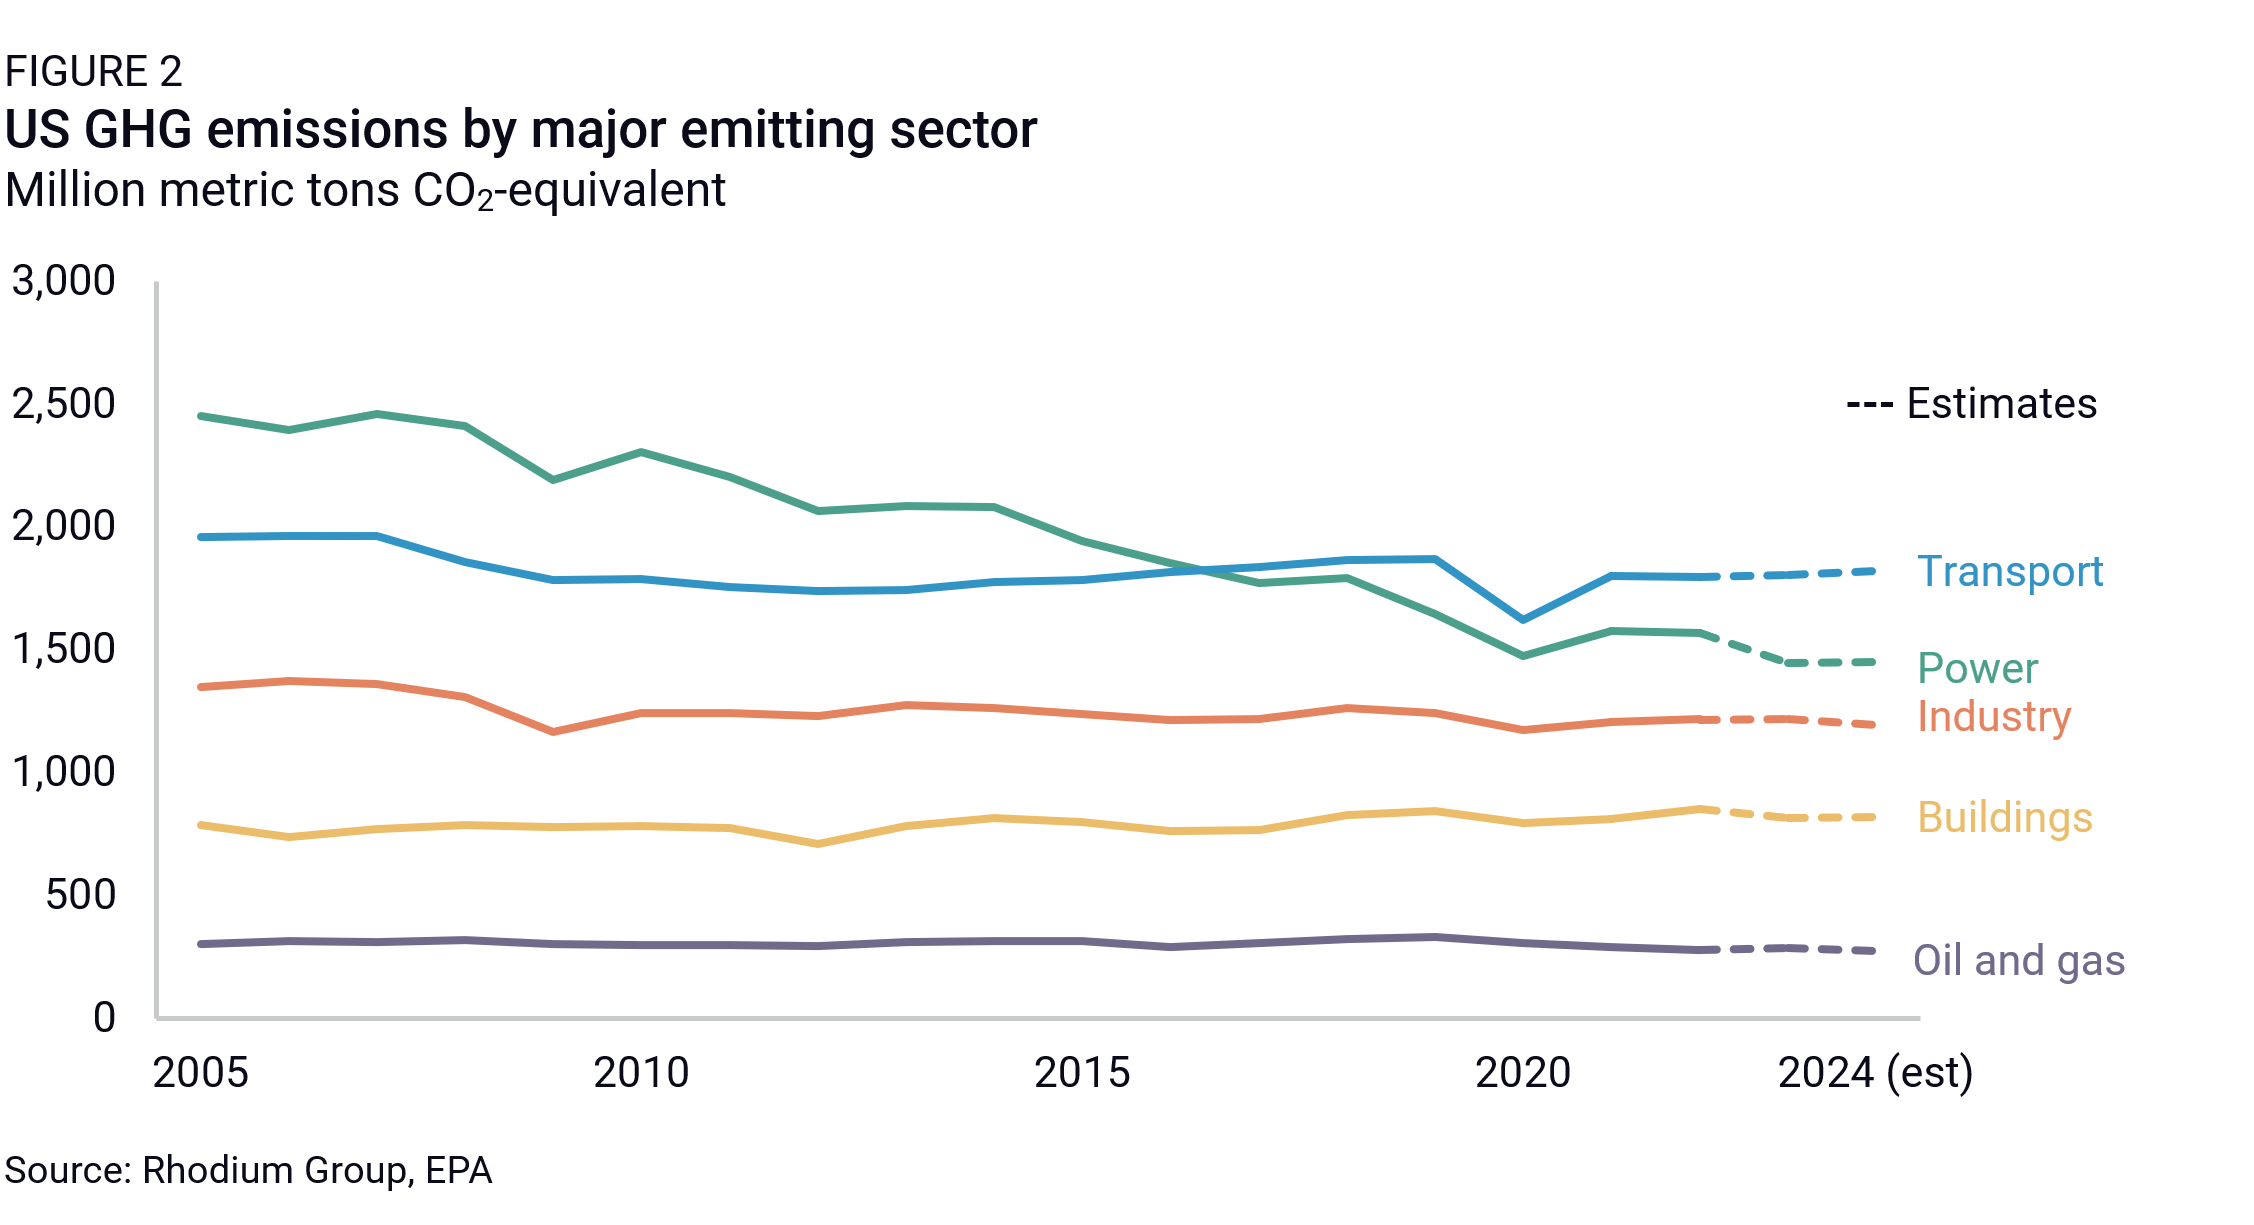
This reduction in emissions was driven by declines of 1.8% in the industrial sector and 3.7% in the oil and gas sector (Figures 2 and 3). Transportation remained the highest-emitting sector, as emissions rose by 0.8% from 2023 levels. Emissions also crept up by 0.2% in the power sector and 0.4% in the buildings sector. We discuss the individual dynamics contributing to these sectoral outcomes later in this note.
US GHG emissions tend to be bumpy year-to-year due to variations in weather, economic activity, and power sector decarbonization, so it is helpful to look at longer-term trends. Rewinding 15 years to the 2009 recession, US emissions rebounded in 2010 then began a 9-year stretch of decline, falling an average of 0.8% annually from 2011 through 2019 (Figure 4). A steep drop due to the pandemic then led to an 8% rebound by 2022. The 3% decline in 2023 provided the first indication of a modest post-pandemic acceleration in the pace of decarbonization. A bigger drop in emissions in 2024 would have strengthened that case—as it is, emissions continue to be roughly in line with the 2011-2019 trend.

Lower industrial activity and cleaner oil and gas systems
In a year of little movement for US GHG emissions, the industrial sector recorded the most significant absolute change, decreasing by 22 million metric tons (MMT) or 1.8% relative to 2023. This decline was principally driven by reduced manufacturing output and historically low coal mining activity. The other drop in emissions came from the oil and gas sector, where emissions fell by 11 MMT (3.7%) relative to 2023.
The topline decline in manufacturing output masked significant variation among key subindustries. While chemicals, computers & electronics, and paper grew production in 2024, declines in food & beverages, mining, and machinery offset these gains. External factors, including Hurricanes Beryl, Milton, and Helene, along with labor disruptions further constrained production in the second and third quarters, according to the Federal Reserve Board.
Coal production fell by 12% in 2024 to its lowest level in decades, as coal power plants continued to retire and lose market share to natural gas and renewables. This reduced production lowered industrial methane emissions, as the process of mining coal results in the emission of methane from the extracted coal and surrounding rock.
For the oil and gas sector, declining methane emission intensity and a slight reduction in gas production drove down emissions in 2024. Crude oil production was up 2.4% in 2024, while natural gas production fell 0.6%, a slightly larger drop than in 2020, as some producers responded to lower natural gas prices by not drilling new wells and curtailing production. Over the past decade, state and federal regulations combined with a trend toward cleaner production practices, especially due to reductions in methane venting, have steadily reduced methane emissions per barrel of oil and per cubic foot of natural gas. We estimate that the methane intensity of oil and gas systems declined by 60% and 40%, respectively, between 2014 and 2024.
Increased transportation activity and a growing power sector
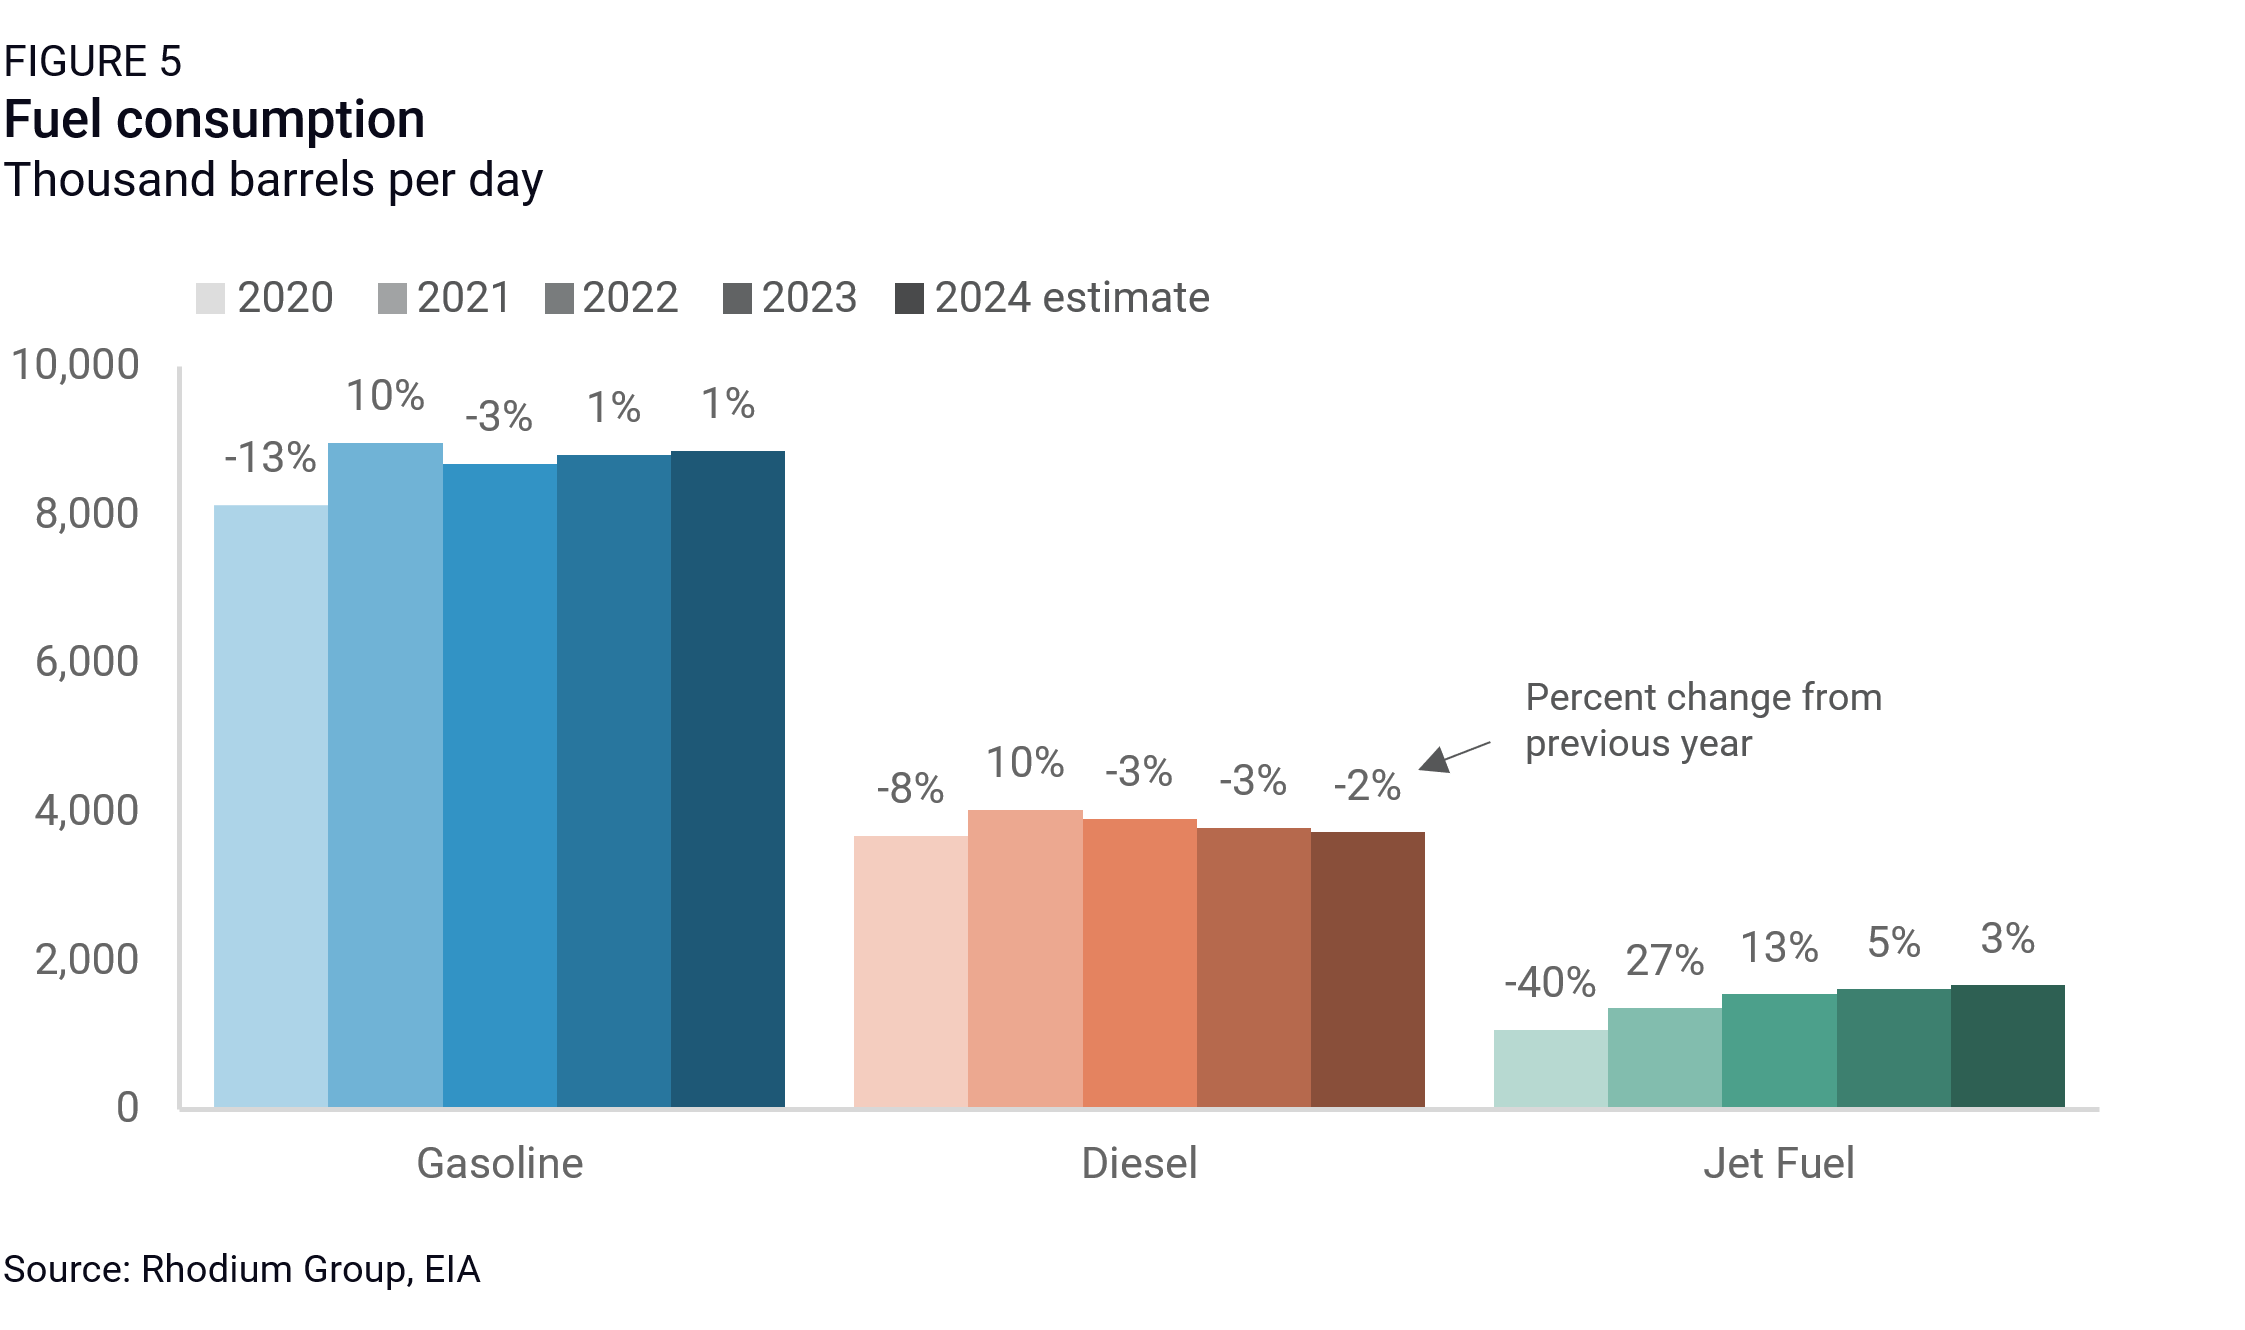
The transportation sector strengthened its lead as the highest emitting sector in 2024, climbing 14 MMT (0.8%) relative to 2023. This growth was fueled by continued post-pandemic rebounds in jet fuel and gasoline consumption, though overall transportation emissions remain 2.5% below 2019 levels (Figure 5). Aviation saw significant activity with available seat miles—a measure of passenger flight capacity—on track to set a record in 2024, based on available data from the first three quarters showing the metric up 6% year-on-year.
The US is also on track for record-high road activity with a 1% increase in road traffic volumes through October 2024 compared to the same period in 2023. Gasoline consumption increased, while diesel consumption continued to decline in 2024, dropping nearly to 2020 levels after a small post-pandemic rebound. Increasing adoption of non-gasoline vehicles mitigated some of the impact of this growth in travel. Electric vehicles (EVs) and plug-in hybrid vehicles made up nearly 10% of all passenger car and light truck sales in 2024 and traditional hybrids were another 10% of sales, based on data through November 2024. Despite this surge in sales, though, EVs and hybrids still only make up about 2% and 3% of all vehicles on the road, respectively. The decline in diesel, used in both the transportation and manufacturing sectors, was driven by both lower manufacturing activity and increased use of biofuels.
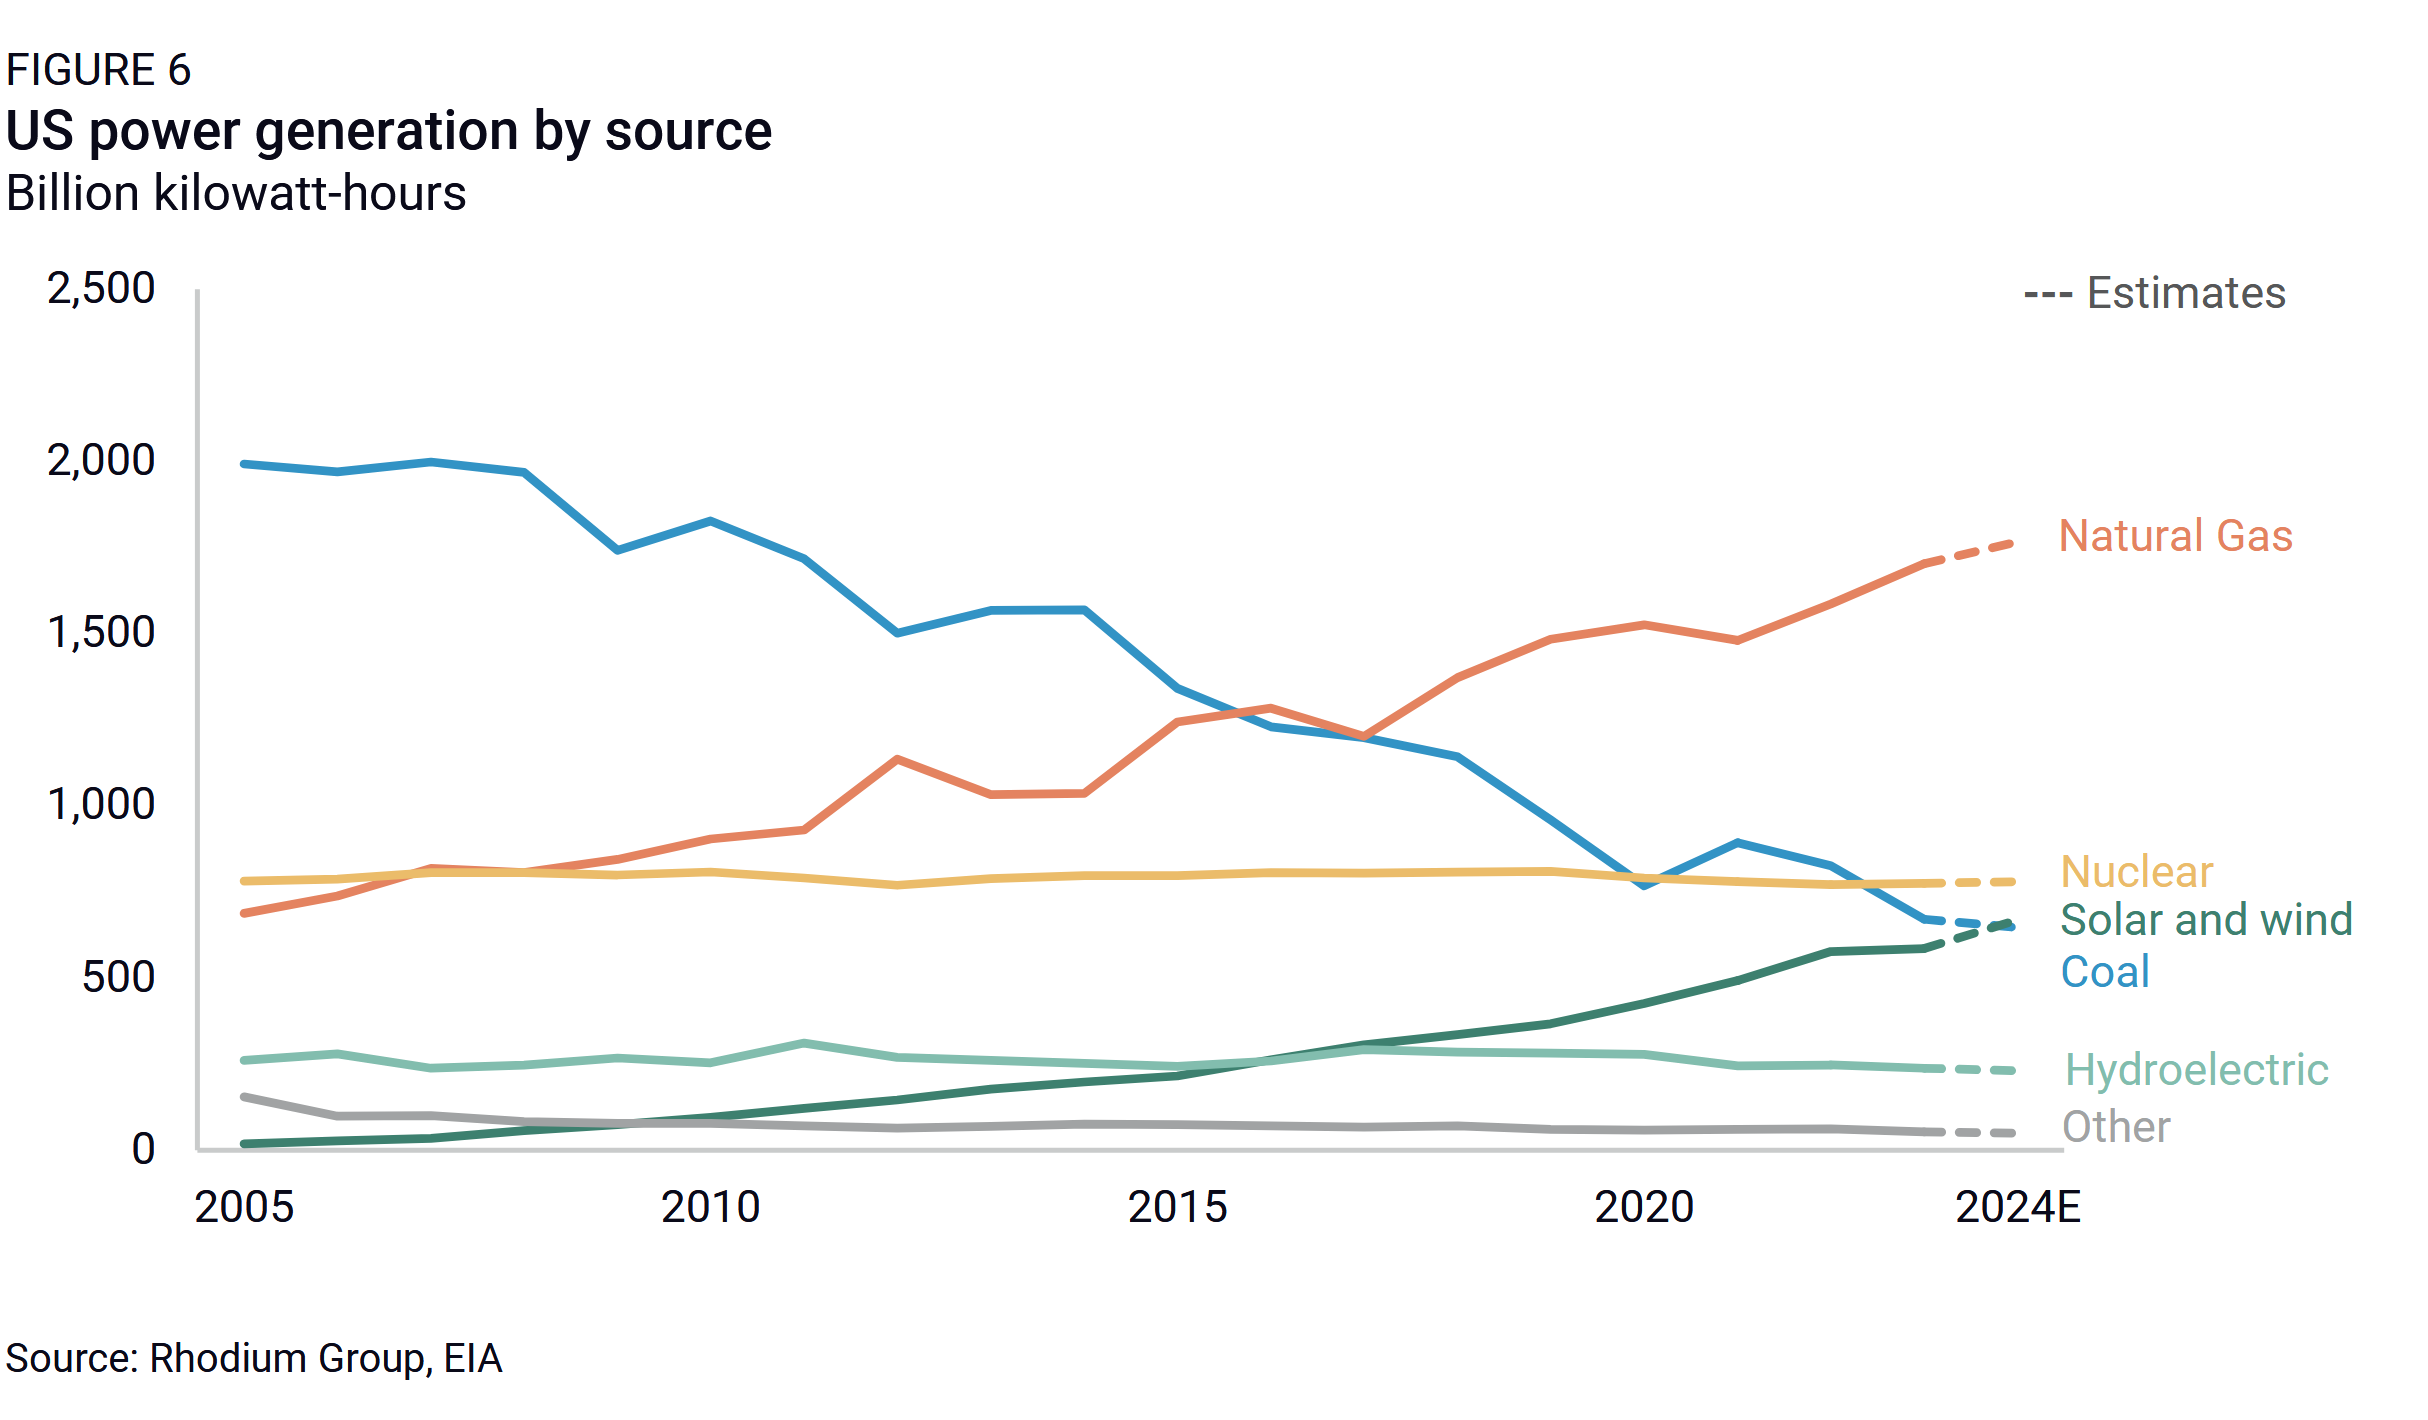
The power sector also contributed to emissions growth, with a 3% uptick in electricity generation relative to 2023, resulting in an increase of 3 MMT (0.2%). Despite higher emissions, the grid’s generation mix got slightly cleaner in 2024. Coal continued its long-term decline, falling by one percentage point to 16% (Figure 6). In absolute terms, coal provided about as much power to the grid in 2024 as it last did in 1967. The share of solar and wind energy combined accounted for 16% of the grid mix, marking a nearly two percentage point increase from 2023. Solar generation surged by 32% and wind generation rose by 7% over 2023 levels, outpacing the 4% growth in natural gas generation. For the first time, solar and wind exceeded coal in the US generation mix. However, natural gas remained the largest single source of electricity, ticking upward by less than one percentage point to 43% of the mix, and the emissions increase from higher gas generation offset slight reductions from lower coal generation.
Based on available sectoral data through Q3, most of the increased demand for electricity came from residential buildings, where a 10% year-on-year increase in cooling degree days—a measure of weather-driven demand for cooling—drove up summer electricity use and increased annual demand by 3%. Industrial power demand, which accounts for a smaller share of total power demand, increased by 2%. Commercial building power demand increased by less than 1%, but EIA notes data centers are a small but rapidly increasing source of demand in the commercial sector.
Looking ahead
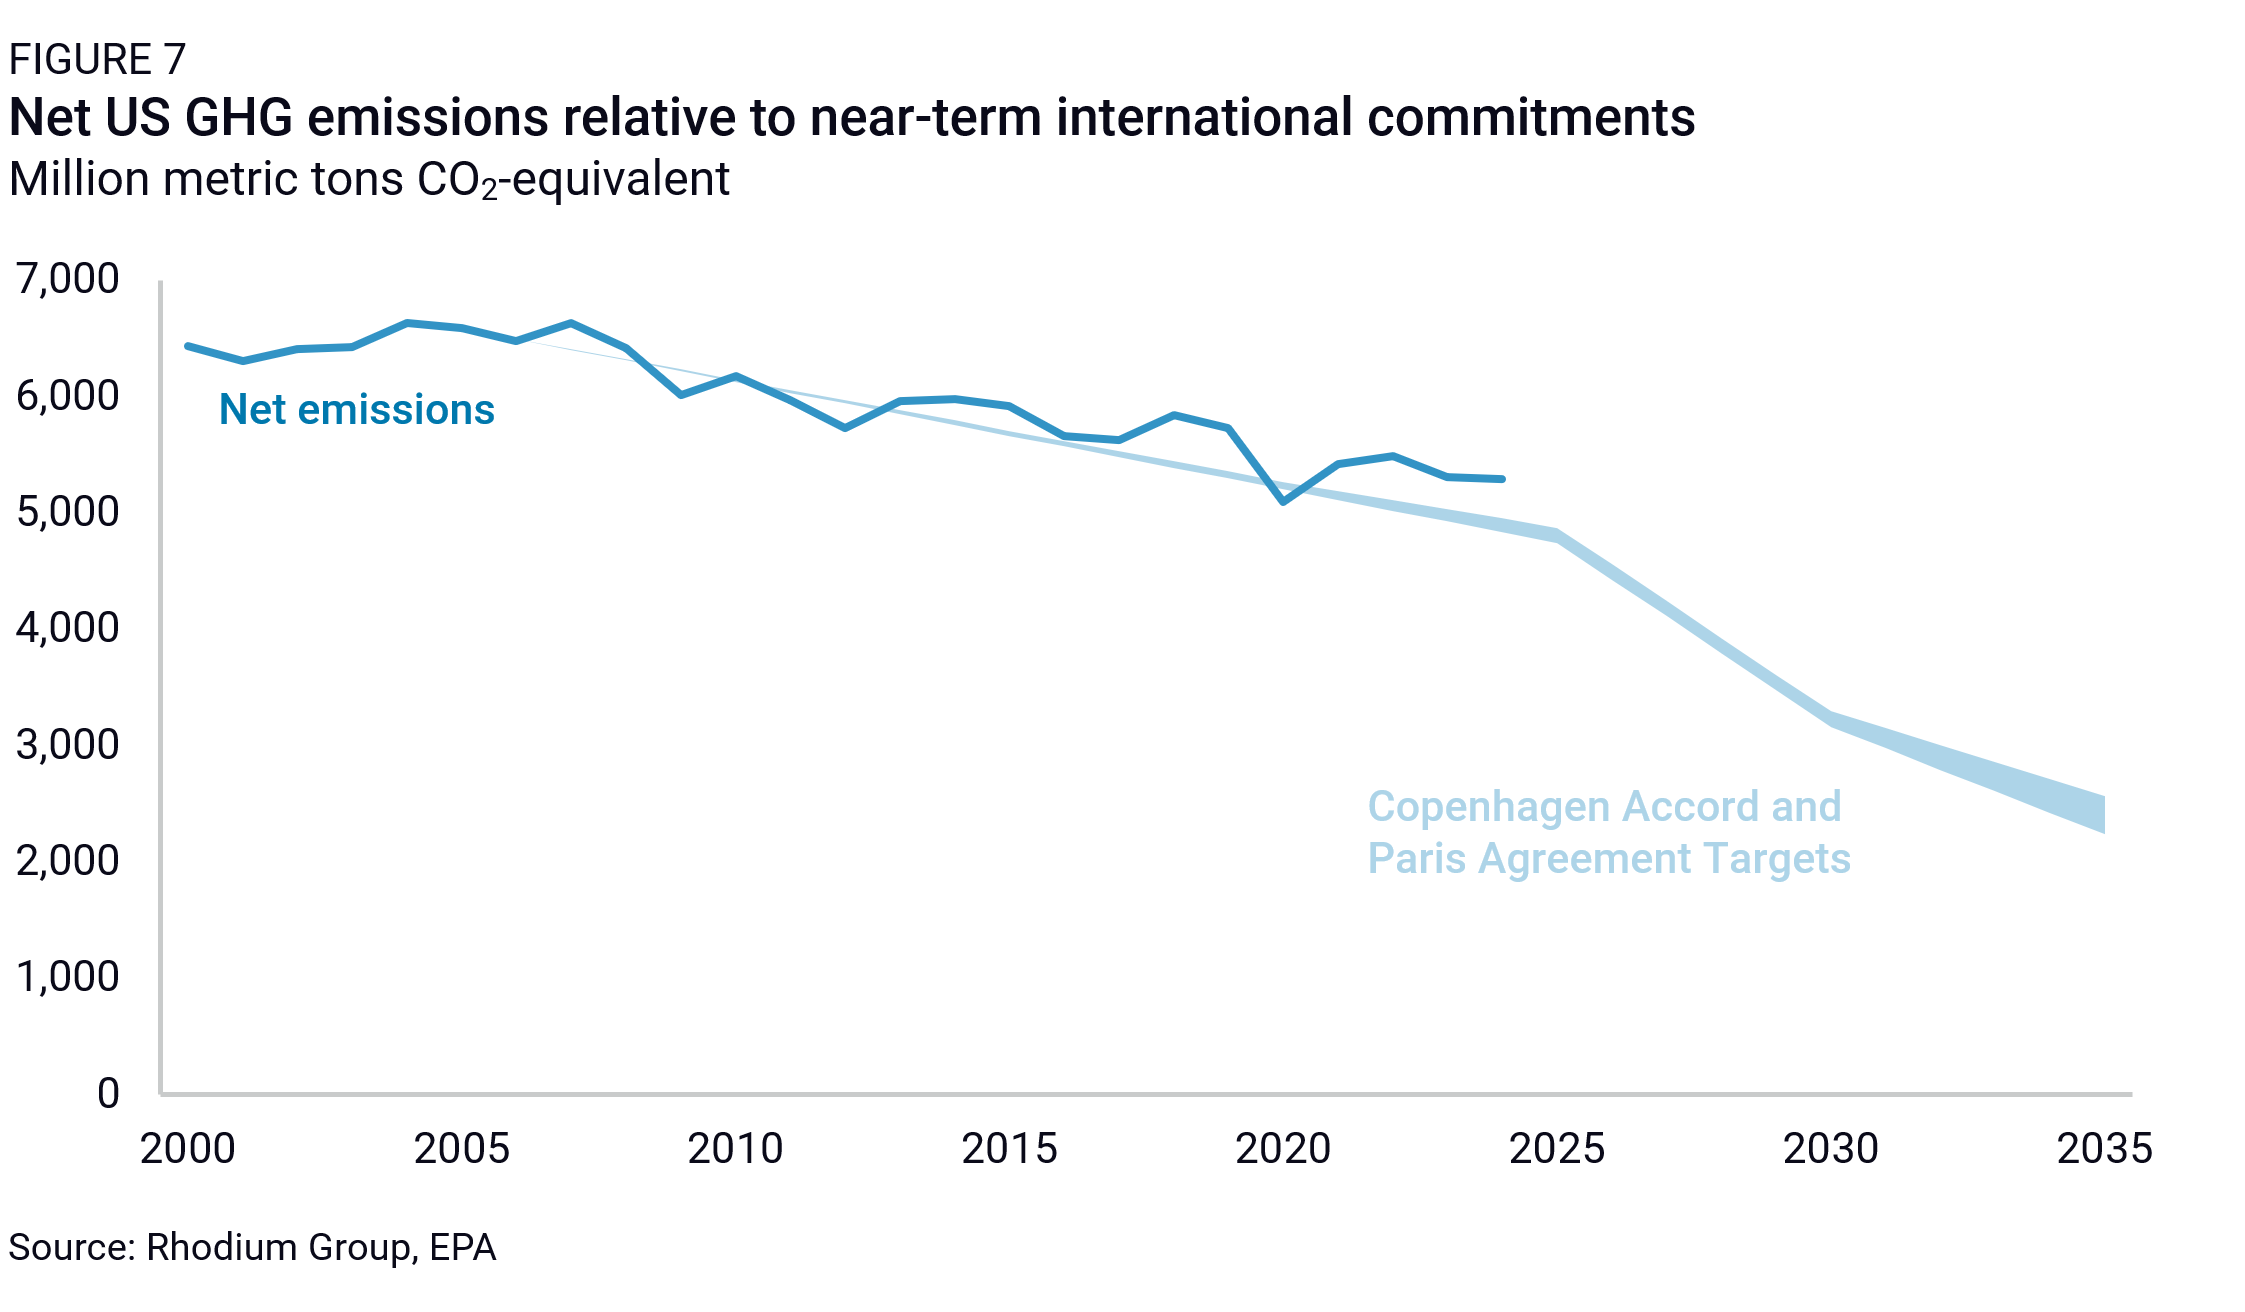
US emissions reductions are not on track to meet the 2030 Paris Agreement target of a 50-52% emissions reduction from 2005 levels or its newly set 2035 target of a 61-66% reduction. Meeting the 2030 target would require an average emissions reduction of 7.6% every year from 2025 through 2030. For comparison, emissions dropped by 11% in 2020 amid the harshest COVID-induced reductions in travel and economic output.
Many analysts, including us, project that the Inflation Reduction Act (IRA), Infrastructure Investment and Jobs Act, and EPA regulations on vehicles and power plants will accelerate the pace of emissions reductions in the coming years. The most recent data from the Clean Investment Monitor provides some promising early evidence on this front, showing actual clean energy and transportation investment reaching a new high of $71 billion in the third quarter of this year. This caps a nearly unbroken streak of quarter-on-quarter growth since the IRA’s passage, with clean investment now accounting for a record 5% of total US private investment.
Whether the acceleration in emissions reductions that we project in Taking Stock 2024 materializes depends on the extent to which the Trump administration and a Republican Congress roll back EPA regulations and repeal the energy and tax policies that were enhanced and expanded through the IRA. Both appear high on the target list. We estimate that a full rollback and IRA repeal scenario substantially reduces the pace of US decarbonization, leaving emissions at just 24-40% below 2005 levels in 2035. We will be watching these developments closely to understand their impact.