Preliminary US Greenhouse Gas Emissions Estimates for 2023
After two years of emissions growth, while the country rebounded from the pandemic, we estimate that emissions were down 1.9% year-on-year in 2023.
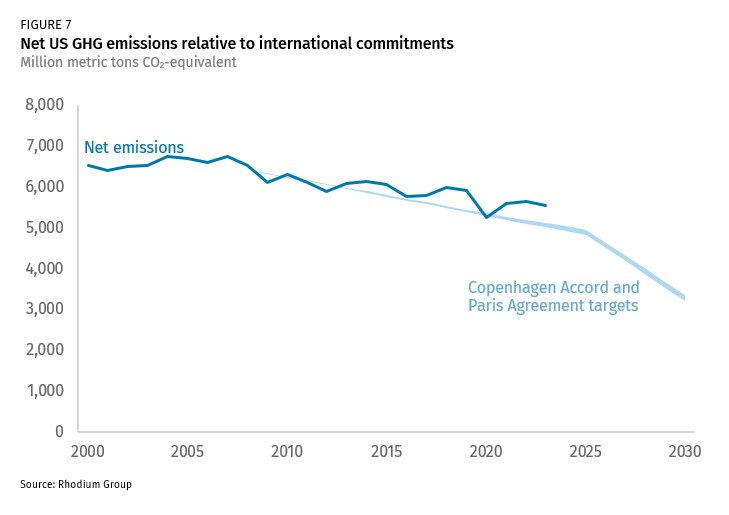
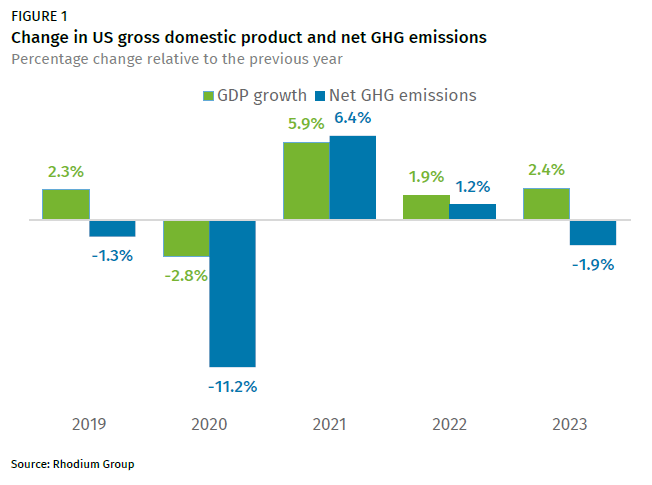
In 2023, the US experienced something it hasn’t since before the COVID-19 pandemic: a growing economy paired with shrinking greenhouse gas (GHG) emissions. After two years of emissions growth, while the country rebounded from the pandemic and its associated economic disruptions, we estimate that emissions were down 1.9% year-on-year in 2023, while the economy expanded by 2.4% over the course of the year. US emissions remained below pre-pandemic levels and dropped to 17.2% below 2005 levels.
A relatively mild winter and declining generation from coal power plants drove down emissions in the power and buildings sectors. Transportation sector emissions rose by 1.6%, though fuel consumption still held below pre-pandemic levels, while increases in domestic oil and gas production led to a 1% increase in industrial emissions. It’s still too early to say whether the Inflation Reduction Act (IRA) and the Infrastructure Investment and Jobs Act (IIJA) will fully achieve their projected emissions impacts. A decline in economy-wide emissions is a step in the right direction, but that rate of decline needs to more than triple and sustain at that level every year from 2024 through 2030 in order to meet the US’s climate target under the Paris Agreement of a 50-52% reduction in emissions.
Economic growth and shrinking emissions in 2023
The US economy continued its post-pandemic growth, with GDP expanding at a projected annual rate of 2.4% in 2023, buoyed by increases in consumer and government spending. Inflation remains elevated and, though lower than in 2022, is creating headwinds across the economy, but particularly in the energy sector.
Despite a growing economy, we estimate that US GHG emissions declined in 2023. The US will get its final GHG report card for 2023 when the EPA finalizes its annual GHG inventory in spring 2025. However, using preliminary economic and energy activity data, we project that economy-wide emissions declined by 1.9% in 2023 from 2022 levels—the largest decline in emissions since 2016, not counting the pandemic-influenced drop in 2020 (Figure 1). This puts US emissions at 17.2% below 2005 levels; emissions remain around 6% down from 2019 levels, before the pandemic.
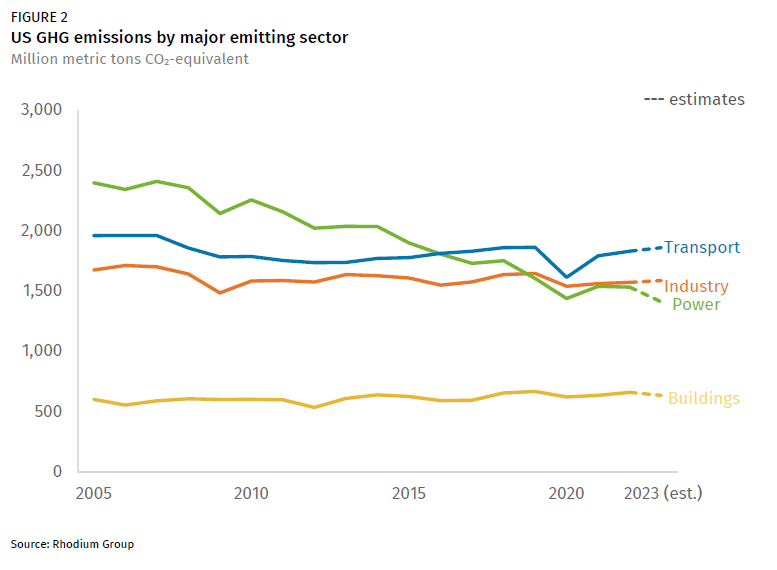
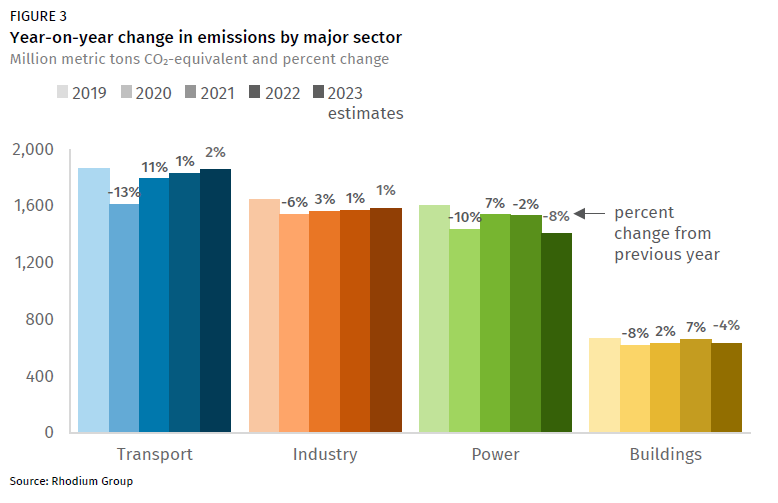
This decline in emissions was driven by an 8% drop in emissions in the power sector and a 4% drop from residential and commercial buildings (Figures 2 and 3). In the transportation sector, the highest-emitting sector, emissions rose by 1.6% from 2022 levels, and in the industrial sector, the second highest-emitting sector, there was a 1% increase in emissions. We discuss the individual dynamics contributing to these sectoral outcomes later in this note.
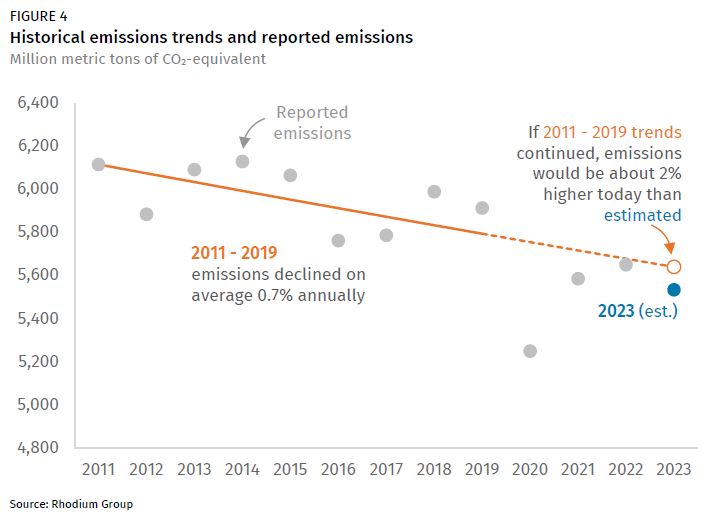
It can be tricky to disaggregate structural decarbonization from weather and economic drivers without substantial additional data, but longer-term trends can be revealing. US GHG emissions reached their peak after the 2009 recession in 2010, after which emissions declined on average 0.7% annually from 2011 through 2019, before the pandemic and its associated economic impacts yielded a steep drop in GHG emissions (Figure 4). If emissions had continued to decline at the same rate as 2011-2019 instead of the pandemic-induced turmoil of 2020-2022, emissions would be about 2% higher today than we’re estimating them to be—suggesting at least a modest acceleration in the pace of decarbonization. But we’ll have more proof of this if next year’s emissions continue the trend.
Cleaner power sector and lower energy use in buildings
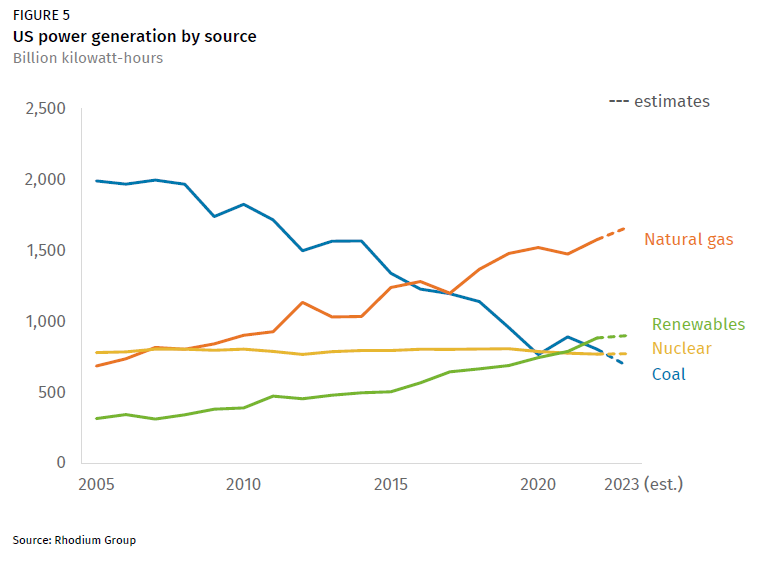
Underpinning the top-line 8% emissions decrease in the power sector is a familiar set of drivers: coal is playing less and less of a role on the grid, while both natural gas and renewable generators are filling the gap. After a brief uptick in generation in 2021, coal has continued its long-term decline and only made up 17% of generation in 2023—another new record low, with coal providing as much power to the grid in 2023 as it last did in 1969. In fact, we estimate that the nuclear fleet generated more power than the coal fleet for only the second time in US history in 2023—the other coming in 2020 during the pandemic.
Despite these promising developments, some ominous signs also began to appear in 2023. Natural gas generation grew more than twice as fast as renewable generation did, year-on-year. Though the solar sector was on track for another record year of installations and new utility-scale battery installations bested their full 2022 levels through just the first three quarters of 2023, installations of wind turbines appeared on track for perhaps just half of last year’s level and just a third of installation levels in 2021.
In the buildings sector, a milder-than-average winter reduced fuel demand and led to lower overall emissions, since the majority of homes still rely on natural gas, fuel oil, and propane for space heating.
Modest increases in transportation and industrial emissions
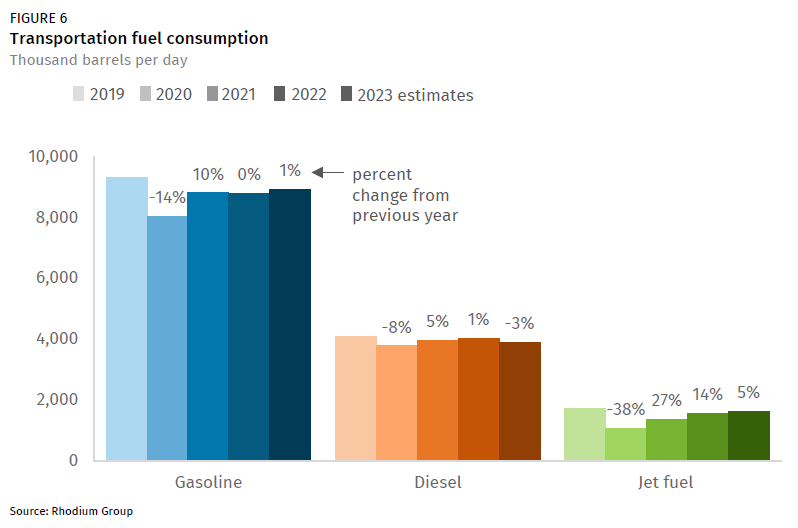
Changes to emissions in the transportation and industrial sectors were more muted this year than in power and buildings, as has generally been the case in the past (barring a major global pandemic). Transportation sector emissions increased by 1.6% in 2023 relative to 2022, mostly driven by a continued rebound in jet fuel consumption after the pandemic (Figure 6). Available seat miles, a measure of how many seats are available on commercial flights, have rebounded above 2019 levels comparing the first three quarters of each year and appear to be on track to set a new record. Through September 2023, road traffic volumes were also up 2.2% over 2022 levels, contributing to an increase in gasoline consumption.
We project industrial sector emissions increased by 1.2% over 2022 levels. The US is on track for record dry gas production in 2023, and crude oil production looks to rival if not exceed 2019 record levels as well. Leaking, venting, and flaring of methane and CO2 during production and transportation of these fuels drove the bulk of industrial sector emissions increases in 2023. This growing contribution should be staunched by the EPA’s newly finalized oil and gas methane rules, which they estimate will reduce GHGs from the oil and gas sector by nearly 40% of today’s levels in the late 2020s. But turning the tide on industrial emissions will also require meaningful decarbonization progress in other parts of the sector, like iron and steelmaking, cement manufacturing, and chemical production.
Looking ahead to 2024… and 2030?
Many analysts project that the Inflation Reduction Act and the Infrastructure Investment and Jobs Act will drive large reductions in GHG emissions over time, including us. The IRA in particular only passed in August 2022, and much of 2023 was spent figuring out how to implement many of its key provisions, especially policies like the clean vehicle and hydrogen production tax credits. It will take years for the full impacts of these pieces of legislation to be seen in emissions outcomes, though early investment data looks promising.
For now, a decline in emissions in 2023 is a step in the right direction. But the deadline for the US 2030 climate target under the Paris Agreement of a 50-52% reduction in GHG emissions below 2005 levels is rapidly approaching, and achievement of that goal looks ever more challenging absent a major new policy push. To meet the Paris target, the US needs to average a 6.9% emissions reduction every year from 2024 through 2030—more than triple the 1.9% drop in 2023. We’ll be watching to see if the US can sustain and accelerate its 2023 emissions decline in 2024 and beyond.