Preliminary US Greenhouse Gas Emissions Estimates for 2021
Based on preliminary data for 2021, Rhodium Group estimates that economy-wide GHG emissions increased 6.2% relative to 2020, though emissions remained 5% below 2019 levels.
After the global pandemic spurred a year of economic upheaval in 2020, many looked to 2021 as a year for recovery. Despite the political and financial measures to support recovery in the US, 2021 was characterized by continued uncertainty as the country navigated a patchwork of COVID-19 prevention measures, access to vaccines, and the emergence of new variants. Consequently, the US economy—and production of greenhouse gas (GHG) emissions—remained below pre-pandemic levels. Based on preliminary data for 2021, Rhodium Group estimates that economy-wide GHG emissions increased 6.2% relative to 2020, though emissions remained 5% below 2019 levels. We don’t have final estimates of overall economic growth for 2021, but current estimates put year-on-year GDP growth at 5.7%. This indicates that GHG emissions rebounded slightly faster than the overall economy in 2021, largely due to a jump in coal-fired power generation, which increased 17% from 2020, and a rapid rebound in road transportation (primarily freight). As a result, progress in reducing US GHG emissions was reversed in 2021, moving from 22.2% below 2005 levels in 2020 to only 17.4% in 2021, putting the US even further off track from achieving its 2025 and 2030 climate targets.
COVID-19’s economic and emissions impact in 2021
As 2020 drew to a close, expectations for a rapid recovery in 2021 were high. Even as late as October 2021, the International Monetary Fund was forecasting a 6% rise in US GDP, more than recovering from the drop of 3.4% in 2020. But with the rise of the Omicron variant and its expected drag on growth, experts have since modified expectations. As of January 7, 2021, Goldman’s estimate of GDP growth in 2021 was 5.7%.
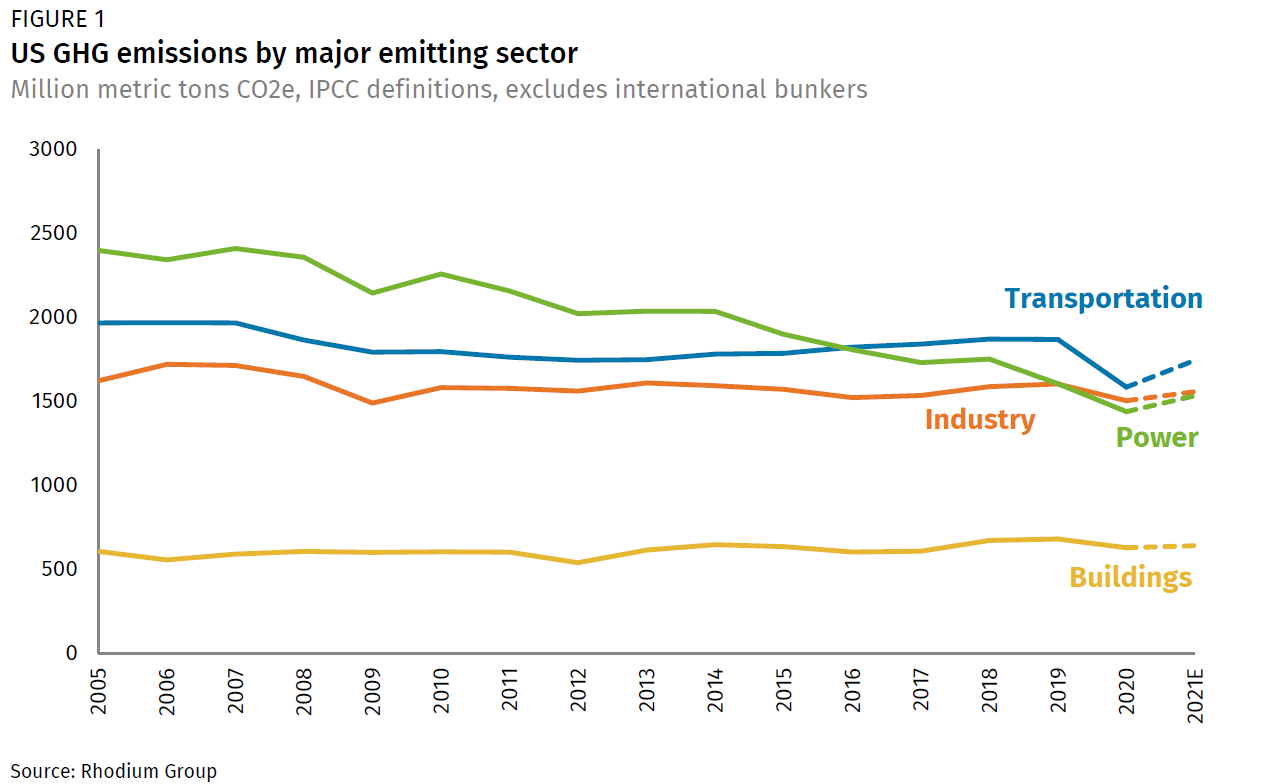
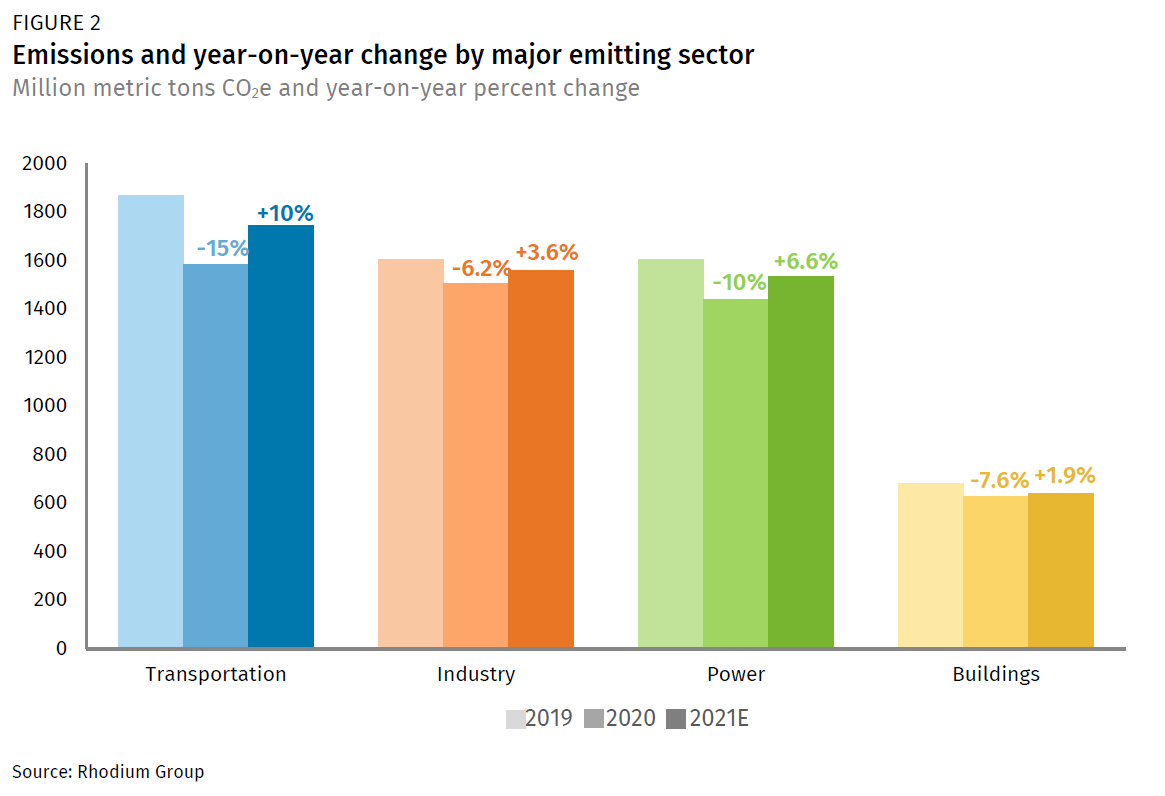
Although we will need to wait for final economic growth estimates, greenhouse gas emissions appear to have rebounded faster than GDP in 2021, bouncing back 6.2%. The transportation and electric power sectors experienced the steepest rise in emissions relative to 2020—10% and 6.6%, respectively—both claiming back about two-thirds of the drop from 2019 levels (Figure 2). Industry, which saw the most modest drop in emissions in 2020 at 6.2%, rebounded 3.6% in 2021—making up just over half the difference from 2019 levels. Buildings saw the smallest rise in GHG emissions in 2021, growing only 1.9% from 2020, returning only a quarter of the drop in emissions from 2020.
Modest rebound in transportation demand
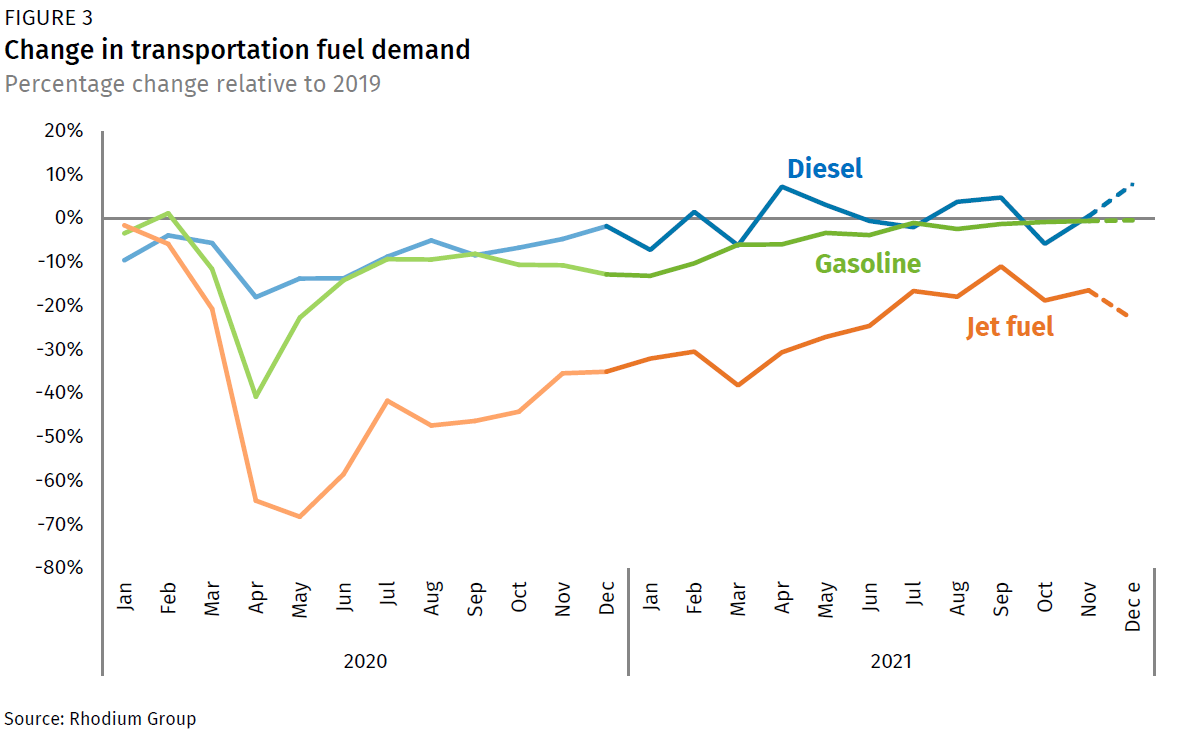
The largest increase in emissions in 2021 came from the transportation sector, reflecting high demand for freight transportation of consumer products and a modest recovery of passenger travel. The transportation sector—which accounts for 31% of net US emissions—experienced the largest decline in GHG emissions in 2020, dropping over 15% (283 million metric tons of CO2e) below 2019 levels (Figure 2). In 2021, despite seasonal rebounds, overall transportation fuel demand never fully returned to 2019 levels. During the first two quarters of 2021, fuel demand increased as COVID-19 vaccines became available (Figure 3). However, the appearance of new variants and breakthrough cases in late summer led to staggered fuel demand for the remainder of the year.
Despite hopes that life would get back to normal in 2021, passenger travel never fully recovered to 2019 levels. After falling 13% in 2020, gasoline demand—indicative of demand for on-road passenger travel—rose steadily through 2021, ending the year 10% above 2020 levels. Despite air travel’s dramatic surge in 2021 (rising 26%), it remained down 24% below 2019 levels. Road freight was the only transport mode that rebounded beyond 2019 levels in 2021. Continued demand for consumer goods kept freight demand high, even surpassing 2019 levels for several months of the year. On a year-on-year basis, aggregate diesel demand rose 9% from 2020 levels, putting it at 0.4% above 2019 levels.
Coal’s comeback
The electric power sector, which accounts for 28% of net US emissions, saw the second largest increase in GHG emissions from 2020 levels. In 2021, emissions increased 6% (95 million metric tons CO2e) above 2020 levels (Figure 2). Despite the bounce back from 2020, emissions remained 4% lower than 2019 levels.
With only modest growth in overall electric power demand in 2021 (up 3% from 2020), the more robust growth in power sector GHG emissions was due to a sharp rise in coal generation, jumping 17% in 2021. This marks the first annual increase in coal generation since 2014, according to the US Energy Information Administration (Figure 4).
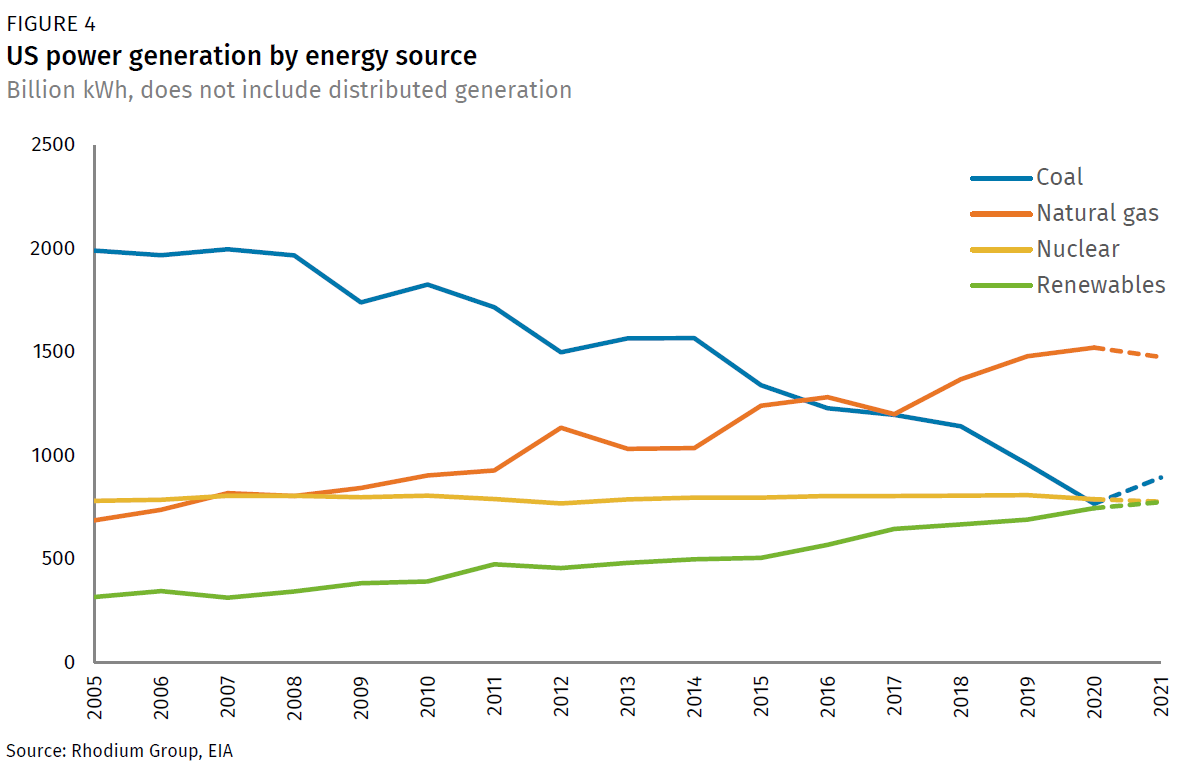
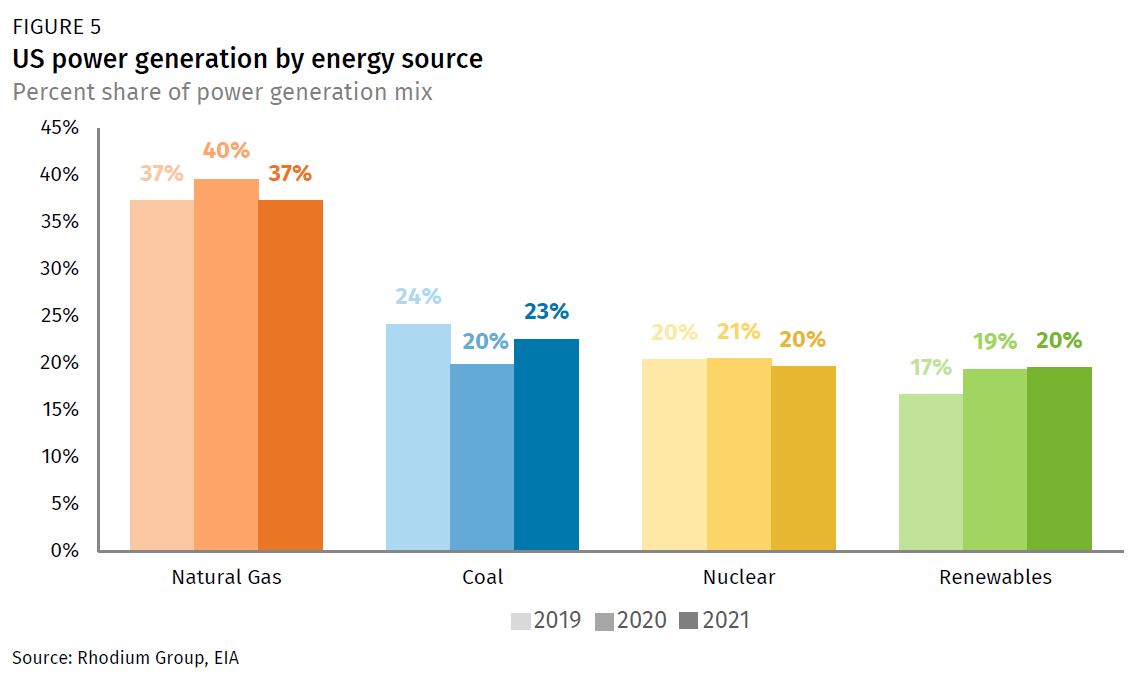
Coal’s rebound was driven largely by a run-up in natural gas prices, with Henry Hub spot prices averaging $4.93 per million Btu in 2021, or more than double their 2020 rate. Prices rose as oil and gas producers ramped down new production in 2021 in response to the COVID oil price collapse and ensuing slow growth in demand. High natural gas prices made gas-fired generation less economical in 2021, leading to a 3% decline in gas generation in 2021, dropping gas’s share of overall generation back down to 37% (Figure 5). Renewables continued their growth in 2021, with generation rising 4% (about half the rate of renewables growth in 2020), reaching 20% of US electricity generation for the first time.
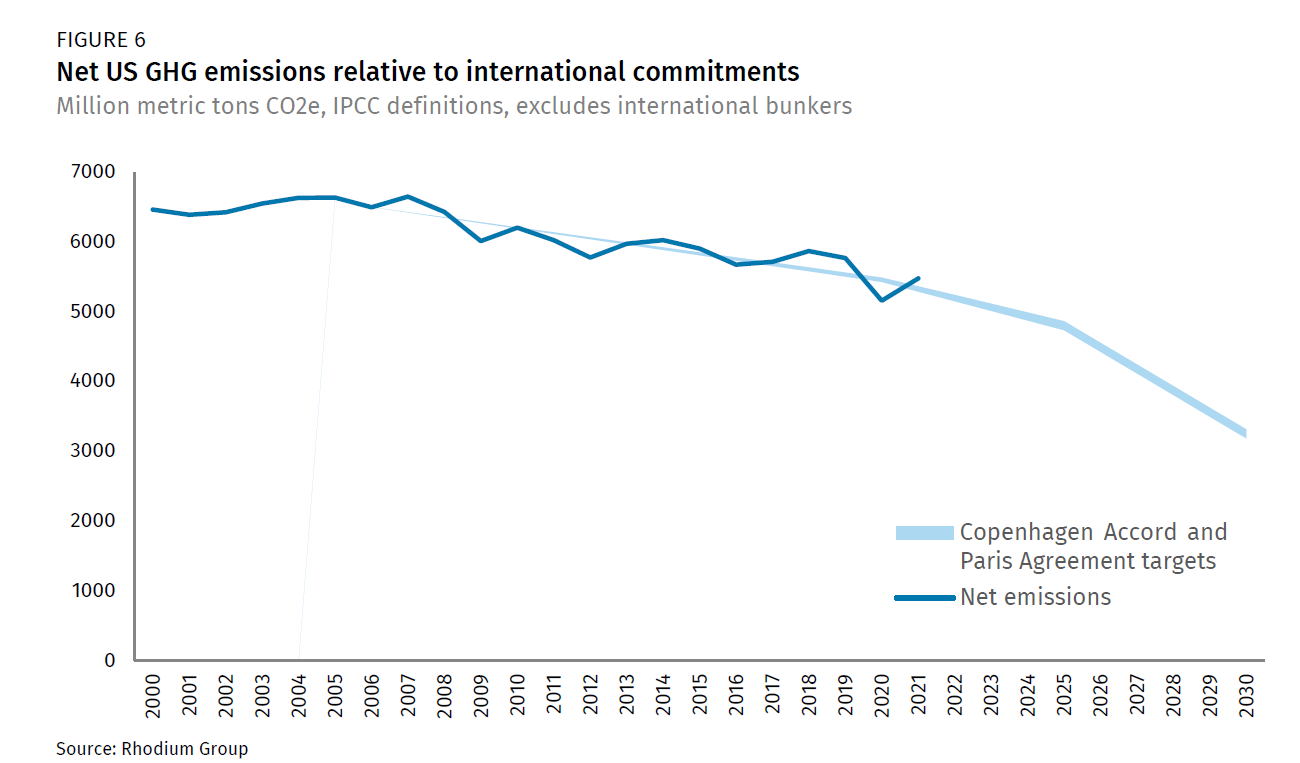
The 2021 emissions rebound puts the US further off track to meeting its Paris Agreement target
The uptick in GHG emissions in 2021 moves the country even further from meeting its Paris Agreement climate target of reducing emissions 50-52% below 2005 levels by 2030. In 2020, due to the economic impacts of the COVID-19 pandemic, emissions fell to 22.2% below 2005 levels. In 2021, US emissions ticked up to 17.4% below 2005 levels (Figure 6). As we discuss in our recent report, Pathways to Paris: A Policy Assessment of the 2030 US Climate Target, joint accelerated action by Congress, the federal executive branch, and leading states can put the 2030 target within reach, but all must act quickly in order to put the US on track.