Global Greenhouse Gas Emissions: 1990-2021 and Preliminary 2022 Estimates
Our preliminary estimates for global greenhouse gas emissions in 2022 show a 1.1% increase from 2021, rebounding back above pre-pandemic emissions levels.
Each year, Rhodium Group provides updated estimates for annual greenhouse gas (GHG) emissions at the global and every-country levels, including for all six main greenhouse gases and across all sectors of the economy. This regular tracking of greenhouse gas emissions provides valuable data for decision-makers in both the public and private sectors as they develop strategies to meet global net-zero emissions goals.
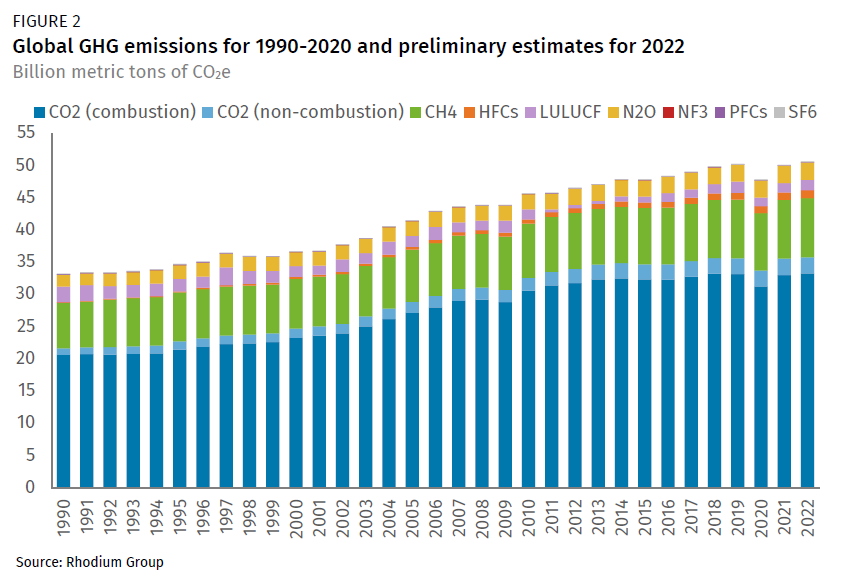
In our preliminary estimates for 2022, we find that global GHG emissions rose 1.1% from the previous year, to 50.6 gigatons of CO2-equivalent. Global emissions dropped steeply in 2020 due to the economic disruptions of the COVID-19 pandemic, followed by a nearly-equivalent rebound in 2021. In 2022, the rise in emissions was much smaller, but nonetheless emissions rebounded back to above pre-pandemic levels and reached a new high. Disruptions in global energy markets from the war in Ukraine resulted in a sharp decrease in natural gas consumption and growth in renewable energy consumption in several major economies in 2022, offset in part by increased coal consumption.
Preliminary estimates show emissions surpassed pre-pandemic levels in 2022
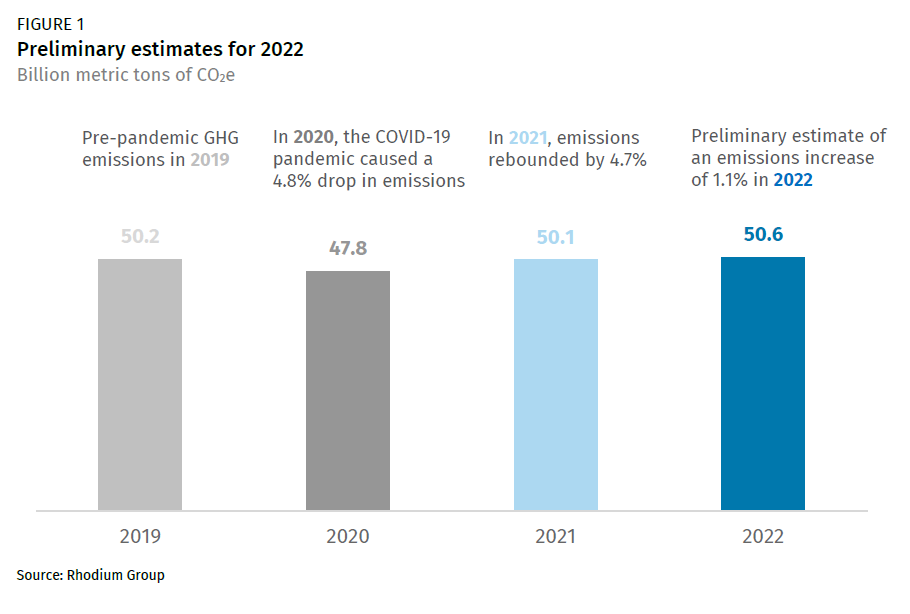
In 2022, just two years after the most marked decline in global GHG emissions seen in three decades, emissions rebounded back above pre-pandemic levels. Rhodium’s preliminary estimates indicate a 1.1% increase in global emissions—covering the six main greenhouse gases emitted from every sector of the economy, including land use, forestry, and international bunkers—from 50.1 gigatons of CO2e in 2021 to 50.6 gigatons in 2022 (Figure 1).
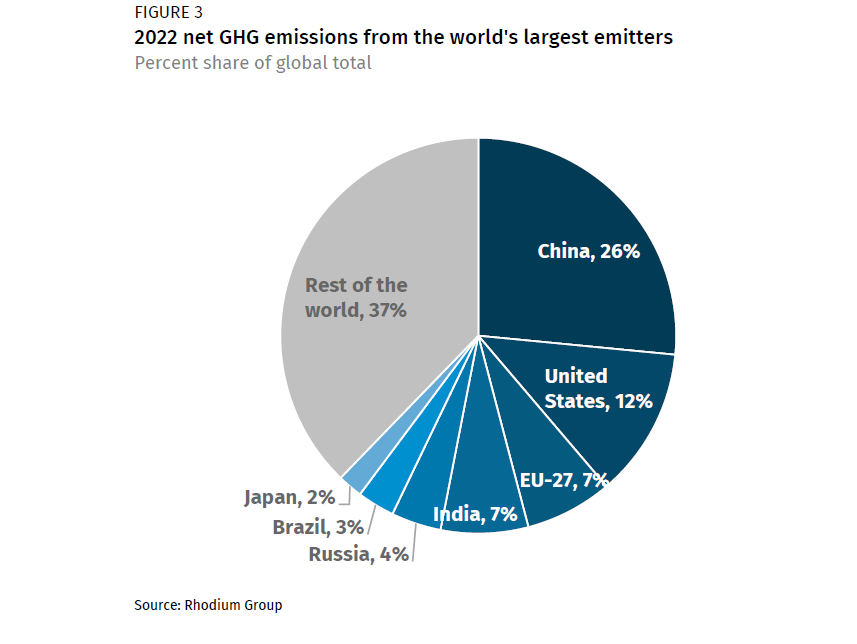
Seven economies were responsible for close to two-thirds of global emissions in 2022 (Figure 3). Relative emissions shares among the world’s major economies remained the same as previous years. China was the highest-emitting economy, contributing 26% of global emissions, followed by the US at 12%, and the EU and India each at 7%.
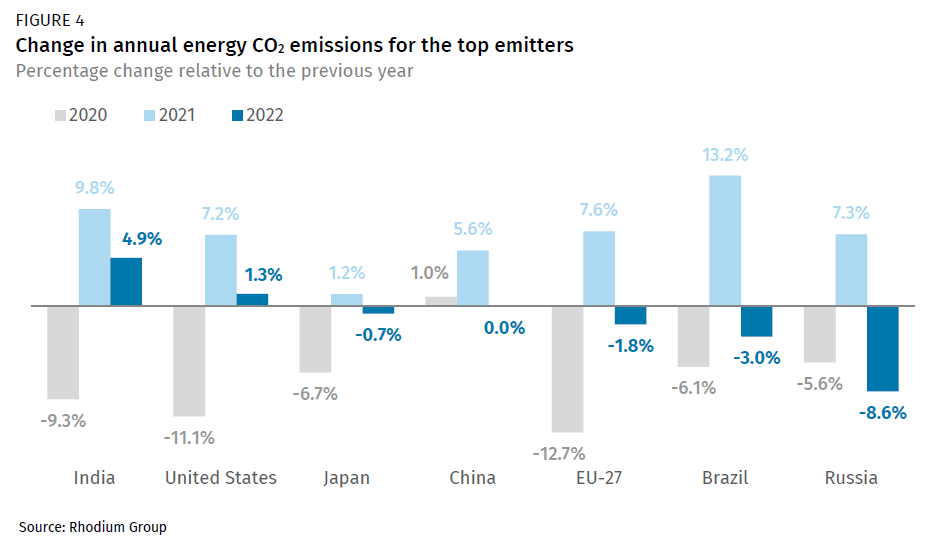
The vast majority of global GHG emissions are produced as CO2 from the combustion of fossil fuels (here referenced as “energy CO2”), which to date have powered the global economy. In 2020, energy CO2 declined 4.8% worldwide, with some major economies seeing reductions of as much as 12.7% (Figure 4). In 2021, global energy CO2 bounced back by 4.7%, with several major economies—India, China, Brazil and Russia—exceeding their pre-pandemic levels. In 2022, emissions from the combustion of fossil fuels continued to rise in India and the US, though US emissions did not exceed pre-pandemic levels. Energy CO2 remained relatively flat in Japan and China, while the EU, Brazil, and Russia each saw emissions decline. Russia experienced the most pronounced drop in energy CO2 with an 8.6% reduction, which can be largely attributed to international sanctions following its invasion of Ukraine, which contributed to a 14% reduction in natural gas production and a 7% decrease in coal production in 2022.
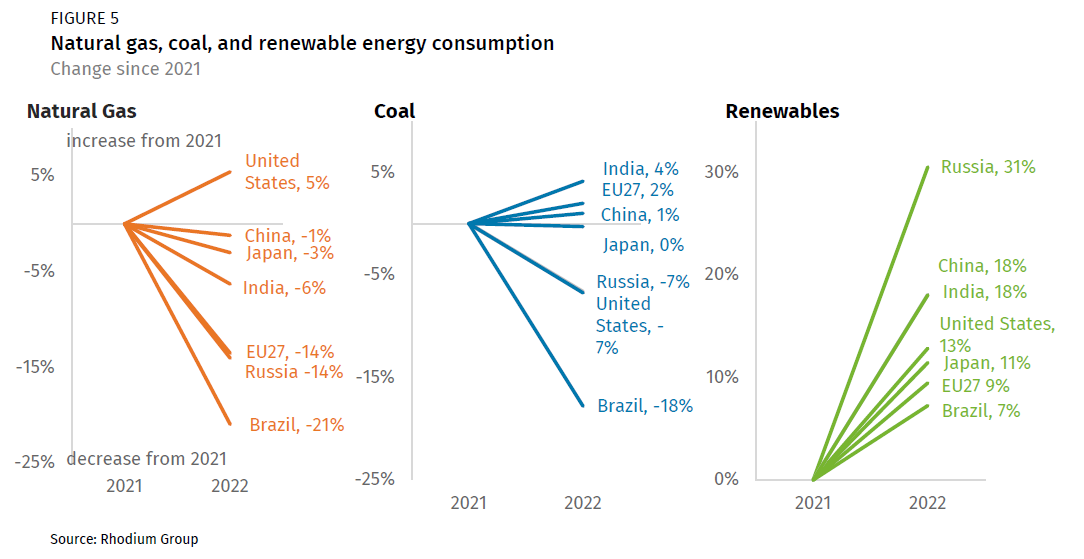
Digging deeper into the dynamics affecting energy CO2 emissions, the impact of the war in Ukraine significantly disrupted global fuel markets, inducing inflationary pressures worldwide and altering CO2 emission sources among major economies. As the second-largest natural gas exporter, Russia’s sanctioned trade impacted the global gas market. As a result, many of the world’s major economies saw a sharp decrease in natural gas consumption, leading to a 3% drop in global natural gas consumption in 2022. Nowhere was this more evident than in the EU, which reduced its consumption by 14% in 2022 (Figure 5). In Brazil, demand for natural gas dropped 21% as higher hydropower availability cut gas-fired power generation. Within Russia—a country that relies on natural gas for 55% of its total fuel consumption—gas demand dropped 14% last year.
Many countries that have traditionally relied heavily on natural gas were forced by high prices to turn to more carbon-intensive fuels like coal, demand for which increased 0.6% in 2022. China and India—both net natural gas importers—reported increases in coal usage by 1% and 4%, respectively. However, the US diverged from this trend. Coal supply chain disruptions in the US pushed for an increased reliance on both natural gas and renewables to meet energy demand.
Amid a global surge in natural gas prices, many nations pivoted to renewable energy to meet their energy needs. Excluding hydropower, worldwide consumption of renewable energy rose by 13%. Among the major economies, Russia led with a 31% jump in renewable consumption. China and India followed with an 18% increase, while the US registered a 13% rise. Collectively, this shift from natural gas to renewables significantly reduced the carbon intensity of the global economy.
Emissions by sector: Industry and electric power generate more than half of global emissions
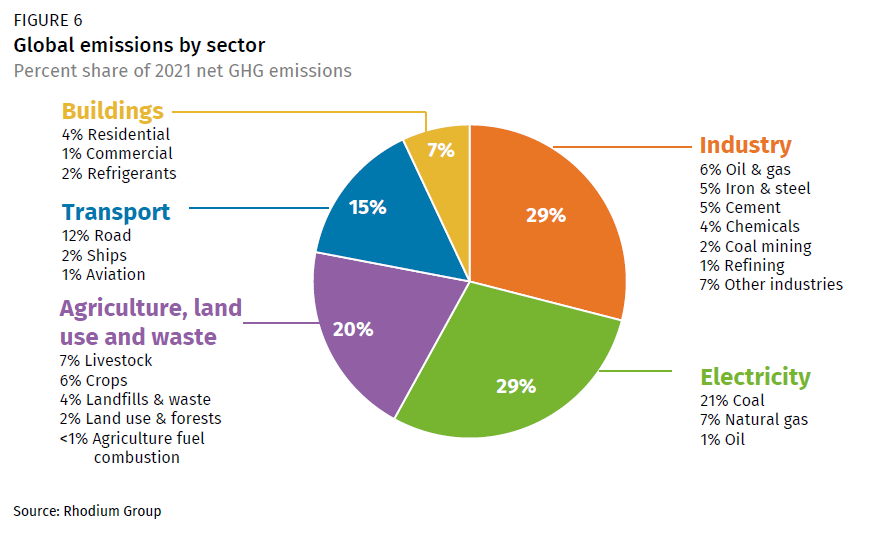
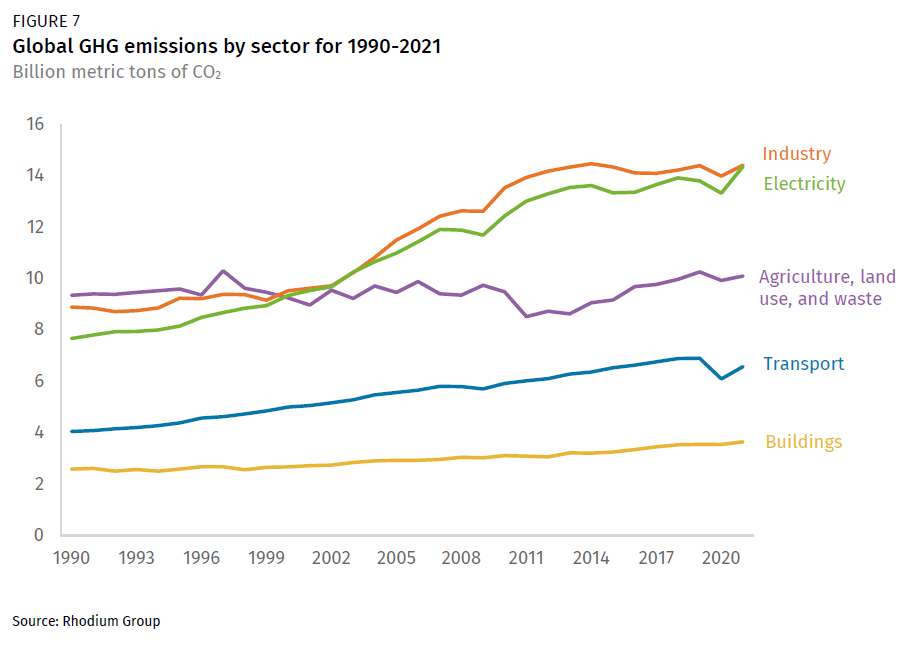
In 2021, the most recent year with detailed sectoral data, industry and the electric power sector were neck-and-neck in their contribution to global GHG emissions, together constituting nearly 60% of the global total (Figure 6). The industry and the electric power sector each accounted for 29% of total GHG emissions, with the vast majority coming from coal combustion. Land use, agriculture, and waste collectively contributed 20% (though this excludes the impact of forest fires), while transportation and buildings contributed 15% and 7%, respectively.
Methodology
The data described here are available on Rhodium’s ClimateDeck data platform, with support from Breakthrough Energy. The ClimateDeck features GHG emissions and energy data for all 190+ countries in the world and all 50 US states and provides users the ability to filter by region, GHG, sector and sub-sector, as well as socioeconomic indicators (e.g., emissions per capita and per GDP), and full inventory tables for each country.
These estimates differ slightly from previous versions of our global GHG emissions data due to methodological improvements and updates that incorporate new data sources. The most significant changes from our 2022 report are due to: 1) use of Global Warming Potentials (GWP) of non-CO2 gases from the Fifth Assessment Report (AR5) of the IPCC, in alignment with UNFCCC reporting guidelines; and 2) the transition toward third party datasets for Agriculture, Forestry and other Land Use (AFOLU) and energy CO2 to ensure methodological consistency across all countries (which means our data will not necessarily align with self-reported UNFCCC inventory data).
In deriving our global and country-specific GHG emissions estimates, we incorporate data from IEA’s energy consumption flows and BP’s 2023 Statistical Review for fossil fuel CO2. For emissions from AFOLU and waste, our primary data source is FAOSTAT and our preliminary estimates for 2022 also incorporate projections from IIASA’s GLOBIOM 2021. These estimates do not take into account emissions from forest fires. For all other non-CO2 gases, we use Annex I inventories and EPA’s Global Non-CO2 data.
For more information about the ClimateDeck, please email [email protected].