Expanding the Industrial Decarbonization Toolkit
The industrial sector is on a path to becoming the highest-emitting sector in the US in the early 2030s, pointing to the critical need to rapidly deploy decarbonization solutions if the US is to achieve meaningful economy-wide decarbonization.
The industrial sector is on a path to becoming the highest-emitting sector in the US economy in the early 2030s, pointing to the critical need to rapidly deploy decarbonization solutions if the US is to achieve meaningful economy-wide decarbonization. The Inflation Reduction Act and the Infrastructure Investment and Jobs Act make substantial investments in such solutions, including carbon capture and clean hydrogen, but there is still a long way to go to deep decarbonization of the industrial sector.
Using our updated industrial decarbonization model, the Industrial Carbon Abatement Platform (RHG-ICAP), in this note we estimate the deployment and emissions impact of decarbonization solutions at existing industrial facilities under current policy, to begin to unpack what a longer-term decarbonization strategy can look like in industry. We find that deployment of carbon capture retrofits and new electrolyzer installations driven by current policy could reduce emissions by 81-132 million metric tons in 2040, resulting in 5-10% lower total industrial sector emissions, with notable uptake of both solutions in key subsectors. Though this abatement marks an important start to bending the emissions curve downward, more ambition on a faster pace is required on the technology and policy fronts to drive substantial emission reductions.
An industrial-sized challenge
Since 2005, direct emissions from the industrial sector in the US (inclusive of emissions associated with oil and gas production) have decreased by just under 7% and account today for more than 1.5 gigatons of GHG emissions annually (Figure 1). In 2023, we estimate that direct emissions from industry edged out the power sector as the second-highest-emitting sector in the US, accounting for 29% of total US GHG emissions. Globally, the picture is even starker: there has been a 21% increase in emissions from industry since 2005. Of the 49 gigatons of worldwide GHG emissions in 2021, more than 14 gigatons (29%) are direct emissions from industry.
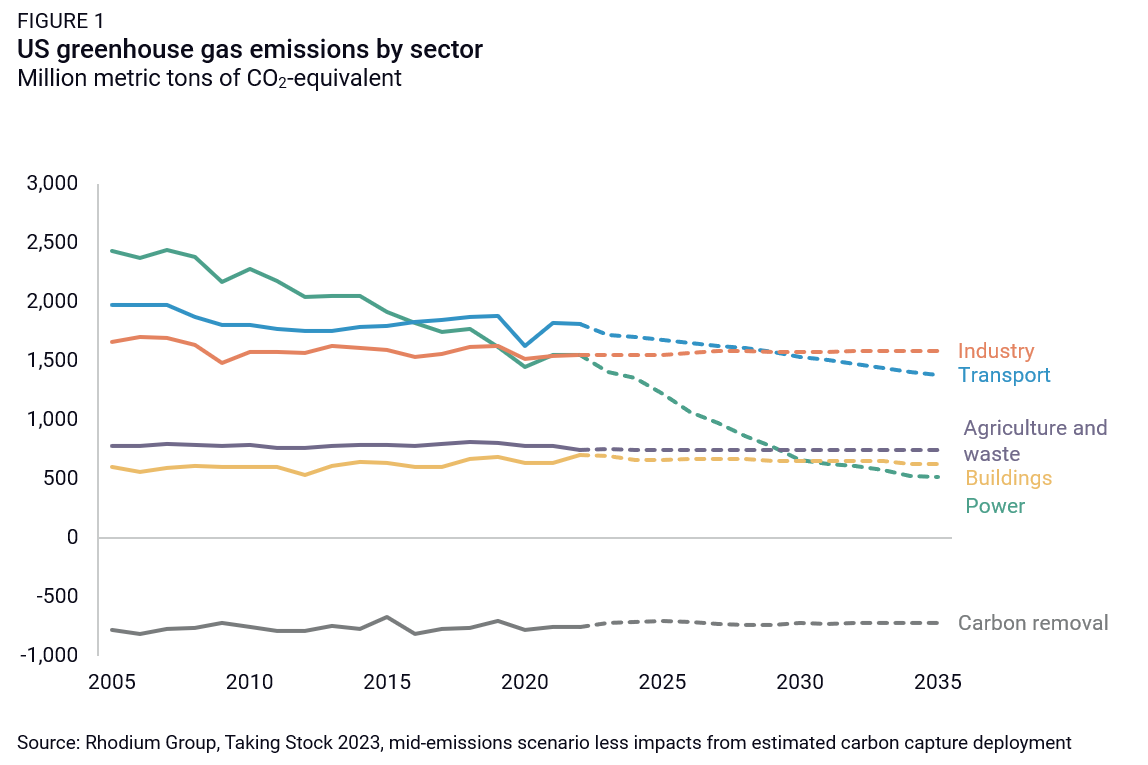
In the US, the industrial sector stands out among other major emitting sectors for that relatively small decrease in emissions since 2005—over the same period, emissions from power generation and transportation have declined by 36% and 8%, respectively. Unlike in the power or transportation sector, where large-scale deployment of clean energy technologies like solar panels and electric vehicles is ramping up in a real way and has been for years, many decarbonization options in the industrial sector have not yet been deployed at scale.
What’s more, domestically and globally, we project that industrial emissions are likely to increase in the coming decades. In the US, we project GHG emissions produced by industry could increase by as much as 12% from 2022 levels by 2035 under current policy.1 Globally, based on probabilistic modeling in the Rhodium Climate Outlook, we find that industrial emissions remain flat through 2035, with a likely (67% probability) range between a decline of 13% and growth of 13%. However, the upper bound for global industrial emissions increases in the latter half of the century as developing regions with uncertain economic outlooks industrialize, and by 2100 the likely range for emissions is between a decline of 16% and growth of 59%.
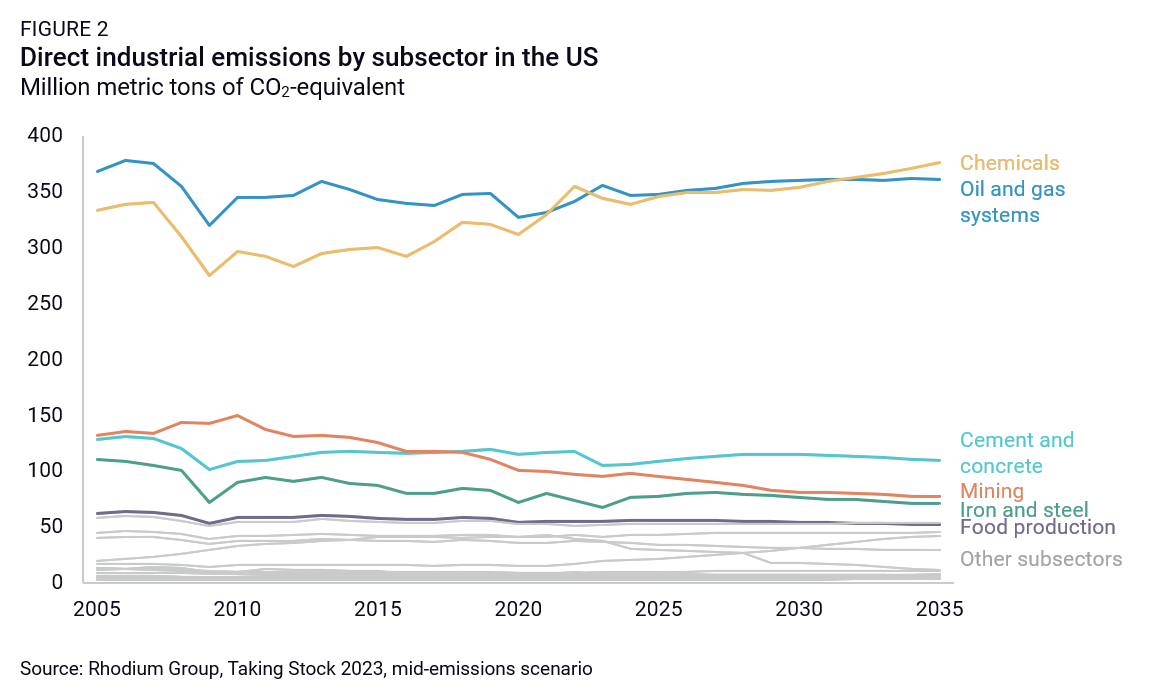
One of the challenges in discussing industrial decarbonization is that the sector is far from a monolith. As opposed to the power sector, which is focused solely on generating one commodity product, the industrial sector encompasses making all the things the world uses on a daily basis—a wildly heterogeneous set of outputs. The highest-emitting subsectors in industry, like oil and gas production and refining, chemical production, cement production, and steelmaking (Figure 2), tend to occur at large, complex industrial facilities, often producing commodities in highly competitive markets with thin margins. In addition, major industrial players and financiers have been risk-averse when considering the installation of new clean technologies. The highest-emitting subsectors tend to have fewer, higher-emitting firms, while there are many times more companies involved in less emissions-intensive subsectors like food manufacturing and metal fabrication, presenting a challenge in the sheer scale of stakeholders.
How to decarbonize industry
In recent years, the path to a deeply decarbonized industrial sector has come more clearly into focus. In 2022, the US Department of Energy released its Industrial Decarbonization Roadmap, which identified four pillars of industrial decarbonization that will be necessary for the US to meaningfully reduce industrial emissions: energy efficiency, electrification (powered by clean electricity), low-carbon fuels and feedstocks, and carbon capture and storage. They estimate that deployment of these pillars across five energy-intensive subsectors (iron and steel, chemical production, food and beverage manufacturing, petroleum refining, and cement production) can reduce CO2 emissions in those subsectors by 87% by 2050. Though beyond the scope of DOE’s work, many of those pillars can apply across the entire industrial sector, pointing to even greater opportunity for emission reductions. Novel, low- or zero-emitting production techniques for industrial outputs like steel and cement can also help reduce emissions, though many of these approaches are still at relatively early stages in the research, development, and demonstration pipeline. In addition to point-of-production interventions, other key factors that can reduce industrial emissions include improved material efficiency and planning for material circularity.
Some of these approaches to decarbonization are available at commercial scale and have a history of success in industry, but others rely on novel technologies or technological applications, with inherent associated risk. The federal government has taken action to help buy down some of that risk. The Infrastructure Investment and Jobs Act (IIJA) and Inflation Reduction Act (IRA) contain major provisions to help strengthen the economic case for new decarbonization technologies in industry. Among the most impactful of these provisions are enhancements to the carbon capture tax credit (45Q) as well as new hydrogen production (45V) and clean fuels (45Z) tax credits, clean hydrogen hubs, funding for carbon capture demonstration and pilots, and increases in loan authority for the Department of Energy’s Loan Programs Office. The US Department of Energy also recently announced $6 billion in grants to demonstrate decarbonization approaches at industrial facilities, putting into practice many of the techniques identified in DOE’s Industrial Decarbonization Roadmap and helping to expand the toolkit available to industry.
Despite these promising efforts, emissions in most major industrial subsectors are either trending upward or remaining relatively flat from today through 2035 (Figure 2). When we first quantified the emissions impacts of the Inflation Reduction Act, we found its industrial provisions, together with broader economic trends, could reduce net emissions by around 80 million metric tons (MMT) of CO2 in 2030, reflecting about 20 MMT lower emissions than in our pre-IRA baseline. As deployment continued post-2030, we estimated net emission reductions of 179-201 MMT by 2035, or 120-142 MMT below our pre-IRA baseline. But a lot has changed in the industrial decarbonization space, as we outline below, which necessitates updates to our modeling approach.
We estimated these emissions impacts in part using Rhodium Group’s Industrial Carbon Abatement Platform (RHG-ICAP), our flagship tool for assessing the economics of decarbonization of existing industrial facilities within the broader energy system context. Since we originally developed ICAP in 2020, and especially with the increased attention on industrial decarbonization that accompanied the IIJA and IRA, there have been several important changes that impact the model. Progress in research, development, demonstration, and deployment has added more data to our understanding of the cost and performance attributes of industrial decarbonization technologies, in many cases increasing expected capital costs for these technologies. Delays and cancellations of CO2 pipeline construction projects necessitate a hard look at cost assumptions for that critical supporting infrastructure. In addition, as the Internal Revenue Service has proposed implementing regulations for IRA tax credits, more analytical questions have arisen, including the interaction between various tax credits and how certain technologies can qualify as “clean.”
In this note, we describe changes we have made to our RHG-ICAP tool in light of these developments. We then apply the new version of the tool to help advance understanding of some key questions around the implementation of industrial decarbonization policy in the US, and we wrap up by identifying some further work we hope to complete in the future.
The Industrial Carbon Abatement Platform (RHG-ICAP)
In 2020, Rhodium Group developed the Industrial Carbon Abatement Platform to estimate capture, transportation, and storage (CCS) costs for carbon capture retrofits at key types of industrial facilities, including high CO2-purity sources (like ammonia production and natural gas processing) and low CO2-purity sources (like cement production and steelmaking), driven by the 45Q tax credit. We have since integrated this tool into our suite of energy system-wide modeling tools and have used it as part of our Taking Stock current policy baselines as well as our estimates of the policy impacts, including the Energy Policy Act of 2020 and the Inflation Reduction Act.
At a high level, ICAP calculates the internal rate of return (IRR) of one or more decarbonization opportunities at a given existing industrial facility, factoring in capital investment costs; ongoing operations, maintenance, and fuel costs; costs relating to the transportation and storage of CO2 and hydrogen; tax credits and carbon taxes (as appropriate); and changes to revenue and other economic factors. The model projects the deployment of these clean technologies, prioritizing the most economically promising facilities first within an annually constrained scale-up framework reflecting supply chain, labor, and other limitations and incorporating regionally resolved fuel cost projections. As each decarbonization technology deploys, we project capital cost declines from learning by doing. The model produces estimates of deployment by location and year as well as scope 1 and 2 emissions reductions. Additional details on inputs, assumptions, and methodologies are available in the technical appendix.
Over the past few months, we have expanded the capabilities of ICAP in several ways:
- Carbon capture coverage: We expanded the industries for which we can estimate capture retrofits to include pulp and paper mills, ethylene production, and liquified natural gas (LNG) export facilities. We also reviewed recent studies on CCS costs, notably an important update from the National Energy Technology Laboratory, and integrated findings into our cost projections.
- CO2 transportation and storage: We incorporated new cost ranges into our estimates for CO2 transportation and storage, which were previously fixed across all scenarios.
- Electrolytic hydrogen production: ICAP has always included the option to retrofit steam methane reformers (SMRs) with carbon capture at merchant hydrogen facilities as well as refineries that produce their own hydrogen. We expanded the available decarbonization solutions to allow the installation of electrolyzers at merchant hydrogen facilities and at ammonia and methanol production facilities, which compete on an economic basis with capture retrofits. We also allow fuel switching from natural gas to hydrogen at direct reduction of iron (DRI) steelmaking facilities.
- Facility-level hydrogen consumption: To support the integration of hydrogen production into the model, we also estimated hydrogen consumption at current hydrogen-using facilities.
Finally, to allow for a deeper dive into our results, we created a new dashboard on ClimateDeck, Rhodium Group’s interactive data visualization platform. Users on ClimateDeck can look at deployment and emission abatement outcomes on a state level, enabling a more geographically resolved consideration of the clean energy transition in industry. We also provide much more detail on the nuts and bolts of RHG-ICAP in the technical appendix accompanying this note.
Decarbonization technologies move the needle on emissions
Using the new version of ICAP, we’ve modeled the impact of decarbonization retrofits at existing industrial facilities, driven by current policy. We estimate that carbon capture retrofits and new electrolyzer installations at existing industrial facilities could contribute to a net reduction of 71-79 million metric tons of CO2 in 2030 in the industrial sector, a 4-5% reduction in total industrial emissions. This figure is roughly aligned with our previous 2030 estimates: we find slightly lower deployment of carbon capture retrofits, made up for by increased deployment of electrolyzers. Net abatement expands to 81-132 MMT in 2040, or a 5-10% reduction in total industrial sector emissions and a downward revision from our previous estimates, especially in capture deployment. We unpack these dynamics further below.
These ranges reflect emission abatement estimates under low, mid, and high emissions scenarios that correspond with our Taking Stock 2023 scenarios. Briefly, the low emissions scenario corresponds with our lowest clean energy technology prices (including carbon capture and hydrogen) and more expensive fossil fuel prices. The high emissions scenario is the inverse, with more expensive cleantech and cheaper fossil fuels, while the mid scenario splits the difference. More detail is available in the Taking Stock report and technical appendix.
Industrial carbon capture retrofits
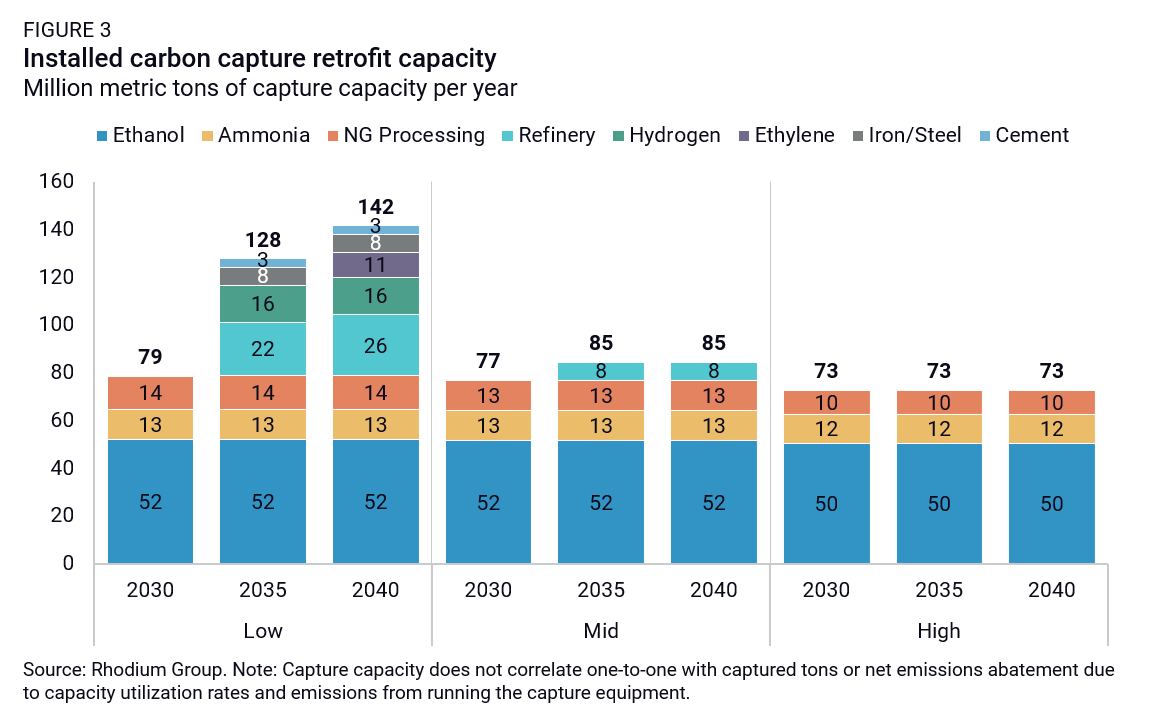
By 2030, we estimate economic deployment of 73-79 MMT of carbon capture capacity, concentrated at high-purity capture sources: ethanol production, ammonia production, and natural gas processing (Figure 3). In the high emissions case, the cost of retrofitting other facilities is not met by the available tax credits, and capture retrofits remain at the same level through 2040. In the low emissions case (with lower costs for carbon capture equipment), capture retrofits reach 142 MMT in 2040 as the point source categories diversify to include lower purity sources of CO2 like refineries, SMRs, and integrated steelmaking facilities. Compared with our post-IRA deployment estimates, we find fewer capture retrofits across all three emissions scenarios, particularly in the installation of capture at refineries and cement facilities. Our review of recent estimates and industry trends found higher capital and operational costs at these facilities, resulting in lower deployment in our modeling.
Electrolyzer installations
ICAP is flexible in its approach to the source of electricity powering the electrolyzer. This is critical, as electricity costs are the single largest determinant of production price for electrolytic hydrogen, and requirements around how that electricity is sourced have a meaningful impact on the emissions associated with electrolytic hydrogen production. For this analysis, we assume that electrolyzers must match electricity consumption on an hourly basis from a new, in-region generating facility. This assumption is aligned with the proposed guidance from IRS on what would be required to claim the 45V tax credit. To run in this hourly matching mode, we assume that electrolyzer developers oversize their renewable power purchase agreements (PPA) to enable high levels of capacity utilization of the electrolyzer, leveraging other analysis in this space (e.g., from Energy Innovation and Ricks et. al.)
Most electrolyzer installations in our modeling occur at existing merchant hydrogen facilities (Figure 4), where we assume the retirement of existing SMRs and replacement with electrolyzer capacity with equivalent hydrogen production output. A trade-off between carbon capture retrofits and electrolyzer replacements at these facilities is evidenced by the deployment of these technologies between the low and mid emissions cases. Given the low-cost assumptions for both technologies in the low emissions scenario, investing in carbon capture makes economic sense at more facilities, leaving fewer facilities available for electrolyzer replacement. In the mid emissions, mid technology cost case, capture retrofits on SMRs do not make economic sense, but electrolyzer replacements do—so we see higher deployment levels of that technology. Across both of these cases, the electrolyzer installations represent a massive increase from the level of installed electrolyzers in mid-2023 of around 0.07 GW. In 2040, installed electrolyzer capacity reaches 15 GW in our low emissions scenario and 18 GW in our mid emissions scenario (Figure 4).
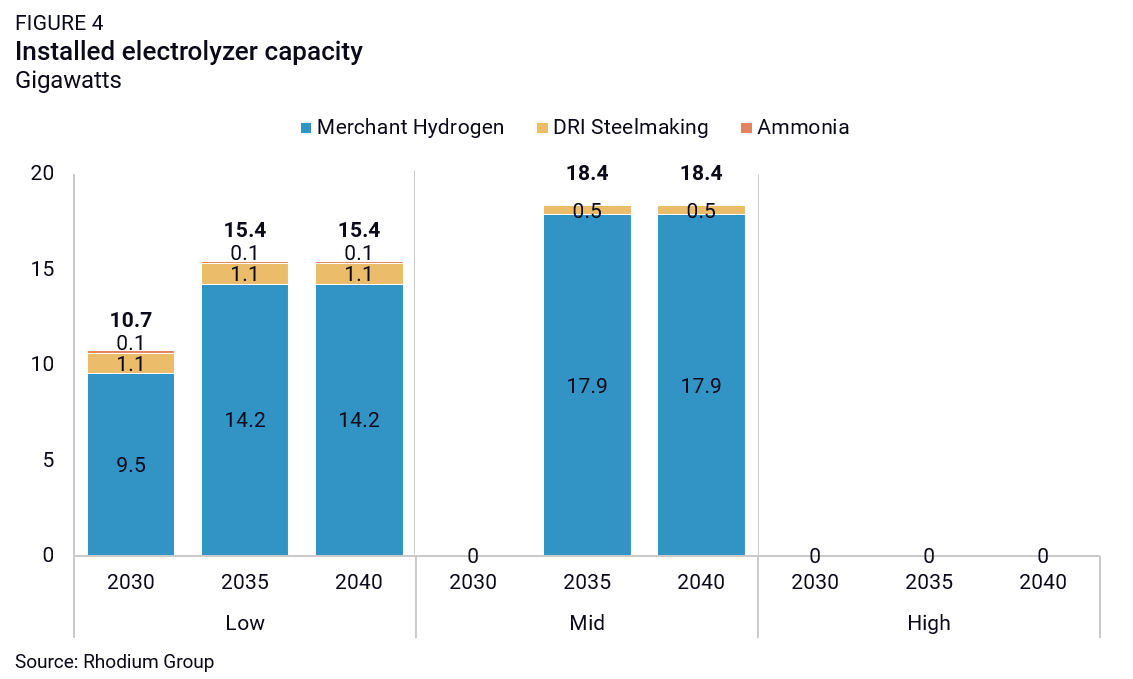
In the high emissions case, high costs for both electrolyzer installation and for clean electricity result in no economic opportunities for electrolyzers under our baseline assumptions. One key aspect of that baseline is that consumers demand hydrogen from electrolyzers at a post-subsidy price competitive with current SMR production—around $1/kg. Under a $3/kg price sensitivity, more opportunities for electrolyzer deployment exist, even with these high capital and electricity prices. If current hydrogen consumers are willing to pay a green premium for low-carbon hydrogen, or if this hydrogen is consumed in other end uses with a higher willingness to pay for clean hydrogen, current policy can drive deployment.
Notably, carbon capture retrofits and new electrolyzers don’t necessarily have equivalent emissions outcomes: we only assess the economics of carbon capture on higher purity process emissions at SMRs, so facility-wide emissions aren’t fully captured, while there are no point source emissions from the electrolyzer (though there may be upstream power sector emissions depending on electricity sourcing requirements). Beyond merchant hydrogen facilities, we also project a small amount of electrolyzer deployment at DRI steelmaking facilities currently running on natural gas and ammonia production facilities.
When we run the model in annual matching mode, we increase the demand for power from the grid for these electrolyzers and account for the consequential power sector emissions when calculating the net emissions effects of these investments. The result is somewhat higher levels of electrolyzer installation (as much as 15-23 GW in 2040) but also less emissions abatement attributable to these electrolyzers.
A coming wave of SMR replacement opportunities
To assess the economics of replacing SMRs with electrolyzers, we needed to collect the age of each facility in the existing SMR fleet. We did not want to assume that SMRs with remaining useful life would opt to retire economically and be replaced with electrolyzers on the basis of going-forward production costs. We found that the expected lifetime of an SMR is around 20 years, and we chose that as the point at which SMRs could have the economic option to retire and replace with new electrolyzers.
Nearly 40% of all SMRs for which we could find vintage data have been in operation for twenty years or longer, and another 35% of existing SMRs will reach that mark in the next decade (Figure 5). As such, the US is on the cusp of a significant stock turnover opportunity for these SMRs, providing an opportunity to reduce industrial emissions at a natural point in the equipment stock lifecycle. It’s important for the US to focus on this opportunity, as the next chance won’t come for another generation.

A long way to go to decarbonize industry
Our modeling using ICAP demonstrates that there are a host of decarbonization solutions that are becoming available today that can economically reduce GHG emissions in the industrial sector. Carbon capture retrofits and electrolyzer installations can reduce industrial sector emissions by 81-132 MMT in 2040, driving down the sector’s total emissions by 5-10% to 1,251 to 1,709 MMT. That’s an important step for parts of the economy that have not seen structural signs of emissions abatement over the last decade—unlike the power sector and (more recently) the transportation sector. Still, there’s a long way to go to decarbonize industry in the US deeply, and not a lot of time to do so.
Part of this gap can likely be closed by a range of technologies that are available but less discussed and less modeled. Critical among these approaches is the electrification of various temperatures of industrial heat. We’ve integrated some preliminary data to assess the economics of this electrification pathway into ICAP, but we have more work to do to understand the costs and industrial process implications of these replacements before we can estimate their economic deployment as we do for carbon capture and electrolyzers. In addition, we currently only consider the use of electrolytic hydrogen at industrial end uses that currently use SMR-produced hydrogen, but there is very likely a suite of new end uses for hydrogen that could further advance net decarbonization, especially as a feedstock in the chemicals sector—but more data is needed on those opportunities. ICAP is currently only focused on retrofits at existing facilities, but promising new production processes and future potential new low-carbon steel and low-carbon (or even carbon-negative) cement facilities will likely have an important role to play in this industrial transition.
Finally, additional decarbonization will not occur without meaningful new policy action at all levels of government. Government actions like economy-wide or sectoral emissions targets, GHG regulations targeting industries, clean product standards, additional investment through the tax code or direct investment (including government procurement), or border carbon policies with meaningful in-country limits are needed to drive investment in R&D and deployment of these technologies, improve investor confidence, and overcome a host of non-cost barriers.
This nonpartisan, independent research was conducted with support from Breakthrough Energy. The results presented reflect the views of the authors and not necessarily those of the supporting organization.
Footnotes
This estimate excludes emissions impacts from deployment of the decarbonization technologies modeled in RHG-ICAP, which we discuss below.